by Gary Alexander
March 26, 2024
Dad was a rocket scientist. That was painfully obvious when he moved our family from peaceful Seattle to politically charged Huntsville, Alabama, in the summer of 1963, just after I graduated from high school. Dad supervised a team of professionals, just one tier below rocket-ace Wernher von Braun at the Marshall Space Flight Center, making the Saturn-V launching rocket, in order to fulfill President Kennedy’s 1961 promise of “landing a man on the Moon and returning him safely to the Earth before this decade is out.”
What I didn’t know, until the early 1960s, that dad was also a rocket scientist during the 1950s. I didn’t know that because his work was classified, and he dutifully kept his mouth shut. In the summer of 1945, when I was born, two weapons were born – the atom bomb, as dramatized in the 7-Oscar-winning film, “Oppenheimer,” and the Bell Labs/U.S. Army Project Nike, a surface-to-air missile (SAM) designed to intercept attacking aircraft or missiles: Nike is the Greek goddess of winged victory, not the sneaker firm.
Nike was fully developed in the early 1950s at over 250 hidden sites, including half a dozen around our home city of Seattle, one on Vashon Island, right across from our home, where dad’s team worked on the SAMs. After the Nike Project was declassified, dad loved to diagram the four-dimensional forces of space and time required to compute the intersection of a rocket with a plane, to cause an aerial explosion. That’s rocket science. If your math is precise, you are guaranteed to hit your target, be it a bomber, or the moon.
Later in life, dad was confused about investing because the math didn’t add up. Trends in place did not continue. P/E ratios rose and fell. Companies (or economists or politicians) lied or “bent the numbers.” I had the honor of telling dad that economics and (by extension, investing) is not a “hard” science, like the physics he knew so well. Economics is a hybrid science, part math and part psychology, relying on human reactions and trillions of individual choices. The problem with academic economics is that the math geeks have hijacked the craft, using econometric models to project current trends into a mostly fictional future.

Econometricians have ignored the psycho-social side of human practices (praxeology), relegating them to the boutique school of Austrian economists, led by Ludwig von Mises in his mid-century masterpiece, “Human Action” (1949). Von Mises said that real people have different goals, making personal decisions to fulfill those goals. Not all economic decisions involve money. Some goals involve soul satisfaction.
If this sounds too theoretical, consider two monetary angles on personal economics: Debt and taxes. As the face of the $100 bill might say: “There’s nothing more certain than debt and taxes.” — Ben Franklin.
Question #1: “If the economy is so good, why are so many families so unsatisfied?”
Inflation is coming down, the jobless rate is at, or near, 50-year lows, we’ve dodged a recession, and our GDP growth rates are the envy of the world. The major stock market indexes are at, or near, all-time highs. National wealth is also at record highs. Yet poll after poll shows only 15% to 25% of voters think they are better off under President Biden. Are they all misinformed by a negative media, or reacting rationally?
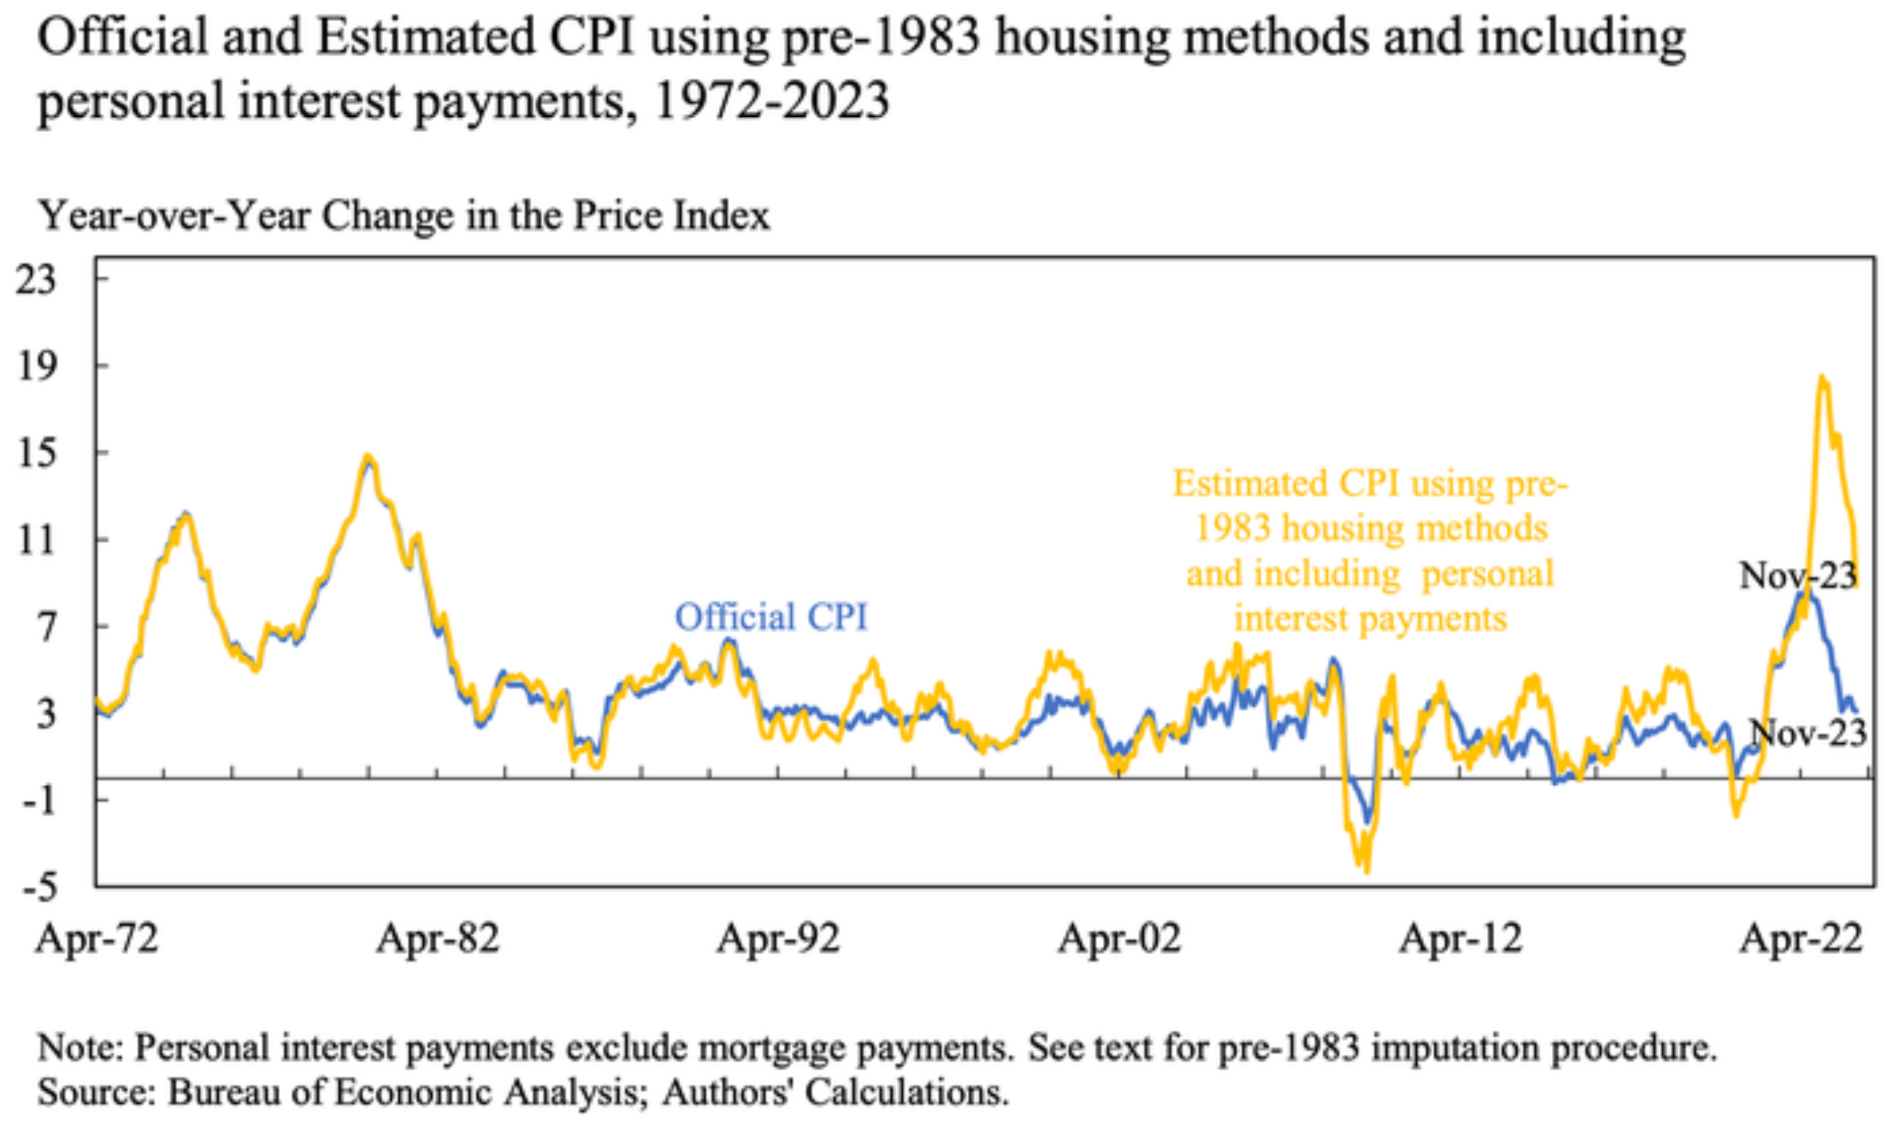
A paper published by the National Bureau of Economic Research (NBER) in February 2024 asks that very question, calling it, “The Consumer Sentiment Anomaly.” (“The Cost of Money is Part of the Cost of Living: New Evidence on the Consumer Sentiment Anomaly” by Marijn A. Bolhuis, Judd N.L. Cramer, Karl Oskar Schulz and Lawrence Summers). They pointed out that the cost of debt service is not included in the Consumer Price Index. For nearly 15 years – including all eight years under Obama – we had near-0% short-term interest rates, so this was no big problem, but with the monetary over-reaction to COVID by the over-printing of fiat money, we saw the most rapid rise in interest rates in history (over 5% in 15 months), resulting in huge debt increases and rising rates at all levels. This study calculated that this rise in rates pushed mortgage rates over 140% higher, and car loans about 80% higher, while credit card rates rose from an average 15% a year, to 23%. This pushed the “real” Consumer Price Index to a peak of 18% (annual rate) in April 2022 and a recent real reading of 7% (rather than 3%) as of the end of 2023.
Graphs are for illustrative and discussion purposes only. Please read important disclosures at the end of this commentary.
That’s important, because the poor are hurt most by inflation and debt service, while the rich seldom take out loans, paying by cash in full. The middle class is also hurt badly, and that’s where most of the votes are. It’s a basic human desire to want more things in life than we can afford, so we tend to buy big items (like homes and cars) on time, paying for them through debt service, but then we want even more, so we charge small things, too. Kudos to those who remain debt free, especially college kids, but so few do.
Also, inflation is cumulative, while wages lag. Food and gasoline prices are each up 20% in the last three years and wages aren’t, so “real wages” have declined. Shoppers look at prices, not the latest decline in monthly inflation data. When their wages don’t match rising costs, they register this angst in public polls. Add to this a tax increase (taxes are not part of the CPI), and watch the sentiment polls drop further.
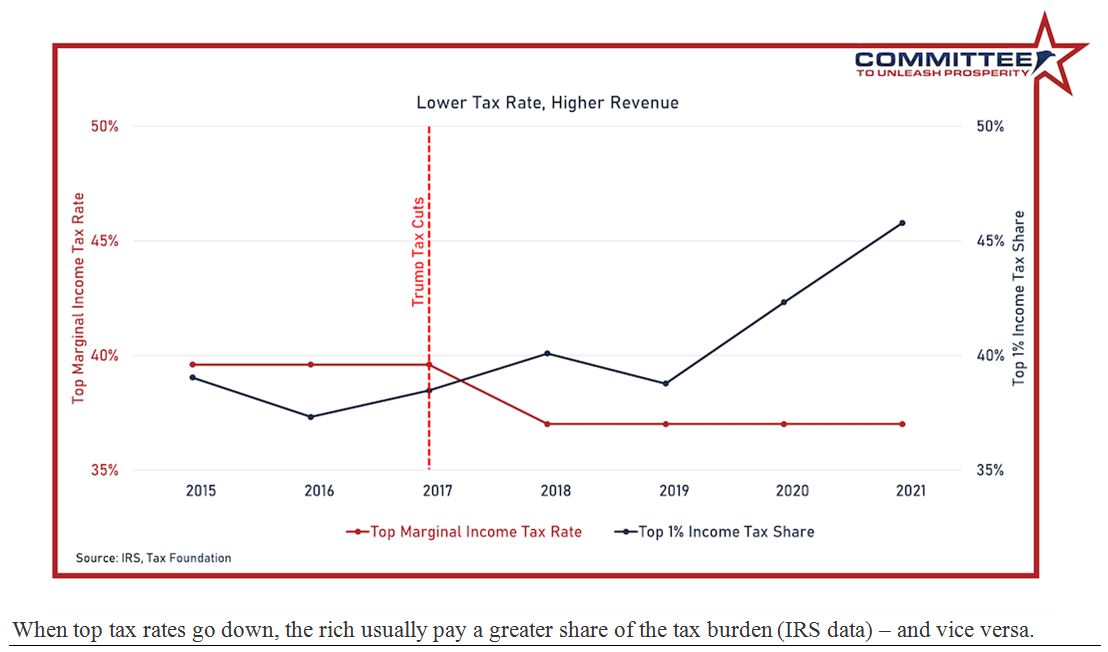
Question #2: “If deficits are rising (and they are), why not just raise taxes on the rich?”
If a government raises tax rates, they will collect more taxes, right? That seems to be the reasoning behind President Biden’s budget plan for Fiscal Year 2025. Raise taxes on businesses and the rich and we can close the budget gap, but raising taxes on the rich invariably causes lower tax collection on the rich, and vice versa, an example of changed behavior by carrot and stick motivation. This is proven under Coolidge (1920s), Kennedy/Johnson (1960s), Reagan (1980s), Bush (2000s) and now in the 2017 Trump tax cuts.
Graphs are for illustrative and discussion purposes only. Please read important disclosures at the end of this commentary.
Art Laffer shows, in his 2022 book, “Taxes Have Consequences,” if you raise tax rates on the rich and businesses, you raise incentives for tax avoidance, or kill economic growth, which reduces tax receipts.
Three examples from Biden’s 2025 budget demonstrate the economic consequences of raising tax rates:
#1: Raise business taxes from 21% to 28%: If you add-in the average 6% state tax on businesses, this would make U.S. corporate tax rates the second highest among the 38 countries of the Organization for Economic Cooperation and Development (OECD) consortium, behind only Colombia. This tax increase would cause many big companies to move overseas, and small companies to stop hiring or close up shop.
#2: Tax unrealized capital gains: Imagine a business owner with nearly all of his $200 million in net assets tied up in his growing company, which doubled in the last year. If he is required to pay 25% of the $100 million capital gain, that would require selling one-eighth of his stock, thereby depressing the price, and he would have to do this each year. The same applies to a wealth tax, requiring a “fire sale” of stocks.
#3: Ending Trump’s middle-class tax cuts. The Trump tax cuts will automatically end after 2025, unless they are renewed. This will increase tax rates for most Americans. Self-employed workers are motivated to work if their total tax rate is under 30%, but not if it creeps over 40% (counting FICA). When the government demands two pounds of flesh instead of one, lots of folks might stop working for Uncle Sam.
Where does that leave the investor? My rocket scientist dad put together a retirement portfolio that wasn’t working for him – mostly gold and bonds – in the 1990s, and that’s when I told him the basic story about “this isn’t rocket science dad, it’s harder than that. It’s about human beings, emotions, sentiment and contrarian thinking.” He knew I worked with some of the best minds in the business, including Louis Navellier, so he said, “Would you manage this mess for me?” I agreed, and we got lucky. He let me make his portfolio decisions right at the dawn of the high-tech revolution, at the start of a huge market move.
Sometimes, being lucky is better than being smart, so we both profited from the market’s rocket ride.
Navellier & Associates does not own Boeing Company (BA), in managed accounts. Gary Alexander does not own Boeing Company (BA), personally.
All content above represents the opinion of Gary Alexander of Navellier & Associates, Inc.
Also In This Issue
A Look Ahead by Louis Navellier
The Role of Nvidia and Super-Data in this “Brave New World”
Income Mail by Bryan Perry
It’s Time to Lock in High Yields
Growth Mail by Gary Alexander
Economics Isn’t Rocket Science (It’s Harder than That)
Global Mail by Ivan Martchev
If the Fed Plans to Cut Rates, Then Why is the Dollar Firm?
Sector Spotlight by Jason Bodner
Is This Bull Market Boring You to Death?
View Full Archive
Read Past Issues Here
About The Author

Gary Alexander
SENIOR EDITOR
Gary Alexander has been Senior Writer at Navellier since 2009. He edits Navellier’s weekly Marketmail and writes a weekly Growth Mail column, in which he uses market history to support the case for growth stocks. For the previous 20 years before joining Navellier, he was Senior Executive Editor at InvestorPlace Media (formerly Phillips Publishing), where he worked with several leading investment analysts, including Louis Navellier (since 1997), helping launch Louis Navellier’s Blue Chip Growth and Global Growth newsletters.
Prior to that, Gary edited Wealth Magazine and Gold Newsletter and wrote various investment research reports for Jefferson Financial in New Orleans in the 1980s. He began his financial newsletter career with KCI Communications in 1980, where he served as consulting editor for Personal Finance newsletter while serving as general manager of KCI’s Alexandria House book division. Before that, he covered the economics beat for news magazines. All content of “Growth Mail” represents the opinion of Gary Alexander
Important Disclosures:
Although information in these reports has been obtained from and is based upon sources that Navellier believes to be reliable, Navellier does not guarantee its accuracy and it may be incomplete or condensed. All opinions and estimates constitute Navellier’s judgment as of the date the report was created and are subject to change without notice. These reports are for informational purposes only and are not a solicitation for the purchase or sale of a security. Any decision to purchase securities mentioned in these reports must take into account existing public information on such securities or any registered prospectus.To the extent permitted by law, neither Navellier & Associates, Inc., nor any of its affiliates, agents, or service providers assumes any liability or responsibility nor owes any duty of care for any consequences of any person acting or refraining to act in reliance on the information contained in this communication or for any decision based on it.
Past performance is no indication of future results. Investment in securities involves significant risk and has the potential for partial or complete loss of funds invested. It should not be assumed that any securities recommendations made by Navellier. in the future will be profitable or equal the performance of securities made in this report. Dividend payments are not guaranteed. The amount of a dividend payment, if any, can vary over time and issuers may reduce dividends paid on securities in the event of a recession or adverse event affecting a specific industry or issuer.
None of the stock information, data, and company information presented herein constitutes a recommendation by Navellier or a solicitation to buy or sell any securities. Any specific securities identified and described do not represent all of the securities purchased, sold, or recommended for advisory clients. The holdings identified do not represent all of the securities purchased, sold, or recommended for advisory clients and the reader should not assume that investments in the securities identified and discussed were or will be profitable.
Information presented is general information that does not take into account your individual circumstances, financial situation, or needs, nor does it present a personalized recommendation to you. Individual stocks presented may not be suitable for every investor. Investment in securities involves significant risk and has the potential for partial or complete loss of funds invested. Investment in fixed income securities has the potential for the investment return and principal value of an investment to fluctuate so that an investor’s holdings, when redeemed, may be worth less than their original cost.
One cannot invest directly in an index. Index is unmanaged and index performance does not reflect deduction of fees, expenses, or taxes. Presentation of Index data does not reflect a belief by Navellier that any stock index constitutes an investment alternative to any Navellier equity strategy or is necessarily comparable to such strategies. Among the most important differences between the Indices and Navellier strategies are that the Navellier equity strategies may (1) incur material management fees, (2) concentrate its investments in relatively few stocks, industries, or sectors, (3) have significantly greater trading activity and related costs, and (4) be significantly more or less volatile than the Indices.
ETF Risk: We may invest in exchange traded funds (“ETFs”) and some of our investment strategies are generally fully invested in ETFs. Like traditional mutual funds, ETFs charge asset-based fees, but they generally do not charge initial sales charges or redemption fees and investors typically pay only customary brokerage fees to buy and sell ETF shares. The fees and costs charged by ETFs held in client accounts will not be deducted from the compensation the client pays Navellier. ETF prices can fluctuate up or down, and a client account could lose money investing in an ETF if the prices of the securities owned by the ETF go down. ETFs are subject to additional risks:
- ETF shares may trade above or below their net asset value;
- An active trading market for an ETF’s shares may not develop or be maintained;
- The value of an ETF may be more volatile than the underlying portfolio of securities the ETF is designed to track;
- The cost of owning shares of the ETF may exceed those a client would incur by directly investing in the underlying securities; and
- Trading of an ETF’s shares may be halted if the listing exchange’s officials deem it appropriate, the shares are delisted from the exchange, or the activation of market-wide “circuit breakers” (which are tied to large decreases in stock prices) halts stock trading generally.
Grader Disclosures: Investment in equity strategies involves substantial risk and has the potential for partial or complete loss of funds invested. The sample portfolio and any accompanying charts are for informational purposes only and are not to be construed as a solicitation to buy or sell any financial instrument and should not be relied upon as the sole factor in an investment making decision. As a matter of normal and important disclosures to you, as a potential investor, please consider the following: The performance presented is not based on any actual securities trading, portfolio, or accounts, and the reported performance of the A, B, C, D, and F portfolios (collectively the “model portfolios”) should be considered mere “paper” or pro forma performance results based on Navellier’s research.
Investors evaluating any of Navellier & Associates, Inc.’s, (or its affiliates’) Investment Products must not use any information presented here, including the performance figures of the model portfolios, in their evaluation of any Navellier Investment Products. Navellier Investment Products include the firm’s mutual funds and managed accounts. The model portfolios, charts, and other information presented do not represent actual funded trades and are not actual funded portfolios. There are material differences between Navellier Investment Products’ portfolios and the model portfolios, research, and performance figures presented here. The model portfolios and the research results (1) may contain stocks or ETFs that are illiquid and difficult to trade; (2) may contain stock or ETF holdings materially different from actual funded Navellier Investment Product portfolios; (3) include the reinvestment of all dividends and other earnings, estimated trading costs, commissions, or management fees; and, (4) may not reflect prices obtained in an actual funded Navellier Investment Product portfolio. For these and other reasons, the reported performances of model portfolios do not reflect the performance results of Navellier’s actually funded and traded Investment Products. In most cases, Navellier’s Investment Products have materially lower performance results than the performances of the model portfolios presented.
This report contains statements that are, or may be considered to be, forward-looking statements. All statements that are not historical facts, including statements about our beliefs or expectations, are “forward-looking statements” within the meaning of The U.S. Private Securities Litigation Reform Act of 1995. These statements may be identified by such forward-looking terminology as “expect,” “estimate,” “plan,” “intend,” “believe,” “anticipate,” “may,” “will,” “should,” “could,” “continue,” “project,” or similar statements or variations of such terms. Our forward-looking statements are based on a series of expectations, assumptions, and projections, are not guarantees of future results or performance, and involve substantial risks and uncertainty as described in Form ADV Part 2A of our filing with the Securities and Exchange Commission (SEC), which is available at www.adviserinfo.sec.gov or by requesting a copy by emailing info@navellier.com. All of our forward-looking statements are as of the date of this report only. We can give no assurance that such expectations or forward-looking statements will prove to be correct. Actual results may differ materially. You are urged to carefully consider all such factors.
FEDERAL TAX ADVICE DISCLAIMER: As required by U.S. Treasury Regulations, you are informed that, to the extent this presentation includes any federal tax advice, the presentation is not written by Navellier to be used, and cannot be used, for the purpose of avoiding federal tax penalties. Navellier does not advise on any income tax requirements or issues. Use of any information presented by Navellier is for general information only and does not represent tax advice either express or implied. You are encouraged to seek professional tax advice for income tax questions and assistance.
IMPORTANT NEWSLETTER DISCLOSURE:The hypothetical performance results for investment newsletters that are authored or edited by Louis Navellier, including Louis Navellier’s Growth Investor, Louis Navellier’s Breakthrough Stocks, Louis Navellier’s Accelerated Profits, and Louis Navellier’s Platinum Club, are not based on any actual securities trading, portfolio, or accounts, and the newsletters’ reported hypothetical performances should be considered mere “paper” or proforma hypothetical performance results and are not actual performance of real world trades. Navellier & Associates, Inc. does not have any relation to or affiliation with the owner of these newsletters. There are material differences between Navellier Investment Products’ portfolios and the InvestorPlace Media, LLC newsletter portfolios authored by Louis Navellier. The InvestorPlace Media, LLC newsletters contain hypothetical performance that do not include transaction costs, advisory fees, or other fees a client might incur if actual investments and trades were being made by an investor. As a result, newsletter performance should not be used to evaluate Navellier Investment services which are separate and different from the newsletters. The owner of the newsletters is InvestorPlace Media, LLC and any questions concerning the newsletters, including any newsletter advertising or hypothetical Newsletter performance claims, (which are calculated solely by Investor Place Media and not Navellier) should be referred to InvestorPlace Media, LLC at (800) 718-8289.
Please note that Navellier & Associates and the Navellier Private Client Group are managed completely independent of the newsletters owned and published by InvestorPlace Media, LLC and written and edited by Louis Navellier, and investment performance of the newsletters should in no way be considered indicative of potential future investment performance for any Navellier & Associates separately managed account portfolio. Potential investors should consult with their financial advisor before investing in any Navellier Investment Product.
Navellier claims compliance with Global Investment Performance Standards (GIPS). To receive a complete list and descriptions of Navellier’s composites and/or a presentation that adheres to the GIPS standards, please contact Navellier or click here. It should not be assumed that any securities recommendations made by Navellier & Associates, Inc. in the future will be profitable or equal the performance of securities made in this report.
FactSet Disclosure: Navellier does not independently calculate the statistical information included in the attached report. The calculation and the information are provided by FactSet, a company not related to Navellier. Although information contained in the report has been obtained from FactSet and is based on sources Navellier believes to be reliable, Navellier does not guarantee its accuracy, and it may be incomplete or condensed. The report and the related FactSet sourced information are provided on an “as is” basis. The user assumes the entire risk of any use made of this information. Investors should consider the report as only a single factor in making their investment decision. The report is for informational purposes only and is not intended as an offer or solicitation for the purchase or sale of a security. FactSet sourced information is the exclusive property of FactSet. Without prior written permission of FactSet, this information may not be reproduced, disseminated or used to create any financial products. All indices are unmanaged and performance of the indices include reinvestment of dividends and interest income, unless otherwise noted, are not illustrative of any particular investment and an investment cannot be made in any index. Past performance is no guarantee of future results.