by Jason Bodner
March 21, 2023
Did you feel extra hungry last week?
I only ask that because stocks were “red-washed” last week. Heavy selling, especially in financials, but spreading to energy stocks as well, rocked the markets and left most stocks in the red.
Confused? Well, red can evoke feelings of hunger. That’s why it’s often used in restaurants and food packaging. Studies show that people tend to eat more when they are exposed to the color red. This may be rooted in biology. People get red in the face when mad or embarrassed. And studies suggest that drivers are more aggressive and quicker when being blocked by red cars than other-colored cars.
I try to invest unemotionally, but when I see an all-red stock market – it makes me uncomfortable. I notice physiological instinctual behaviors rising. I grab a snack to help with stress. I try to look away. I try to “clear my head.” What’s really happening here?
Emotional and psychological instincts can easily cloud sound judgment in the form of rational thought. In other words, red stock listings trigger emotional responses, and not always logical ones.
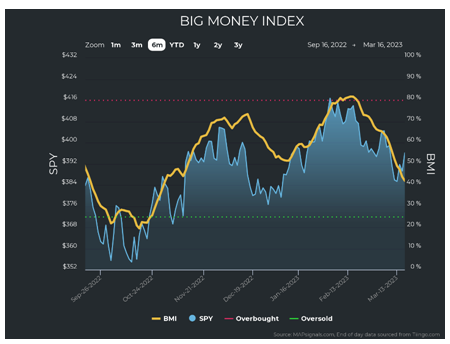
After we digest that fact (pun intended), we can look objectively at what the data presents. Let’s begin with institutional inflows and outflows. It should come as no big surprise that outflows are dominant. The BMI went overbought February 8th. After peaking it fell out of overbought February 17th and SPY troughed -5.4% ever since. Currently the BMI reads 42% and is closer to oversold than overbought.
Graphs are for illustrative and discussion purposes only. Please read important disclosures at the end of this commentary.
That might cause alarm, but if the 25-day average of buying vs. selling continues – getting to oversold could take longer than you might think. The past 25 trading days has 40 average buys 87 average sells. That carried forward would bring us to oversold levels 16 trading days from now, or roughly 3+ weeks.
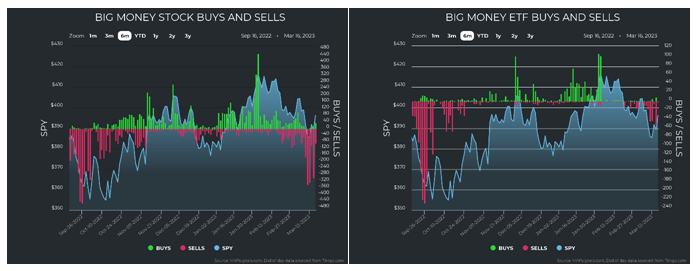
Naturally, there’s a potentially cheerier alternative: selling exhausts itself and the market rallies. I’m not saying that will happen, only that it could. And more importantly did. Looking at the BMI chart above you can see similar action from December to January, after a sustained rally period – again similar to February. The main caveat here, is that recent selling is significantly more severe than December/January but less severe than the dismal September of last year. We see this for both stocks and ETFs:
Graphs are for illustrative and discussion purposes only. Please read important disclosures at the end of this commentary.
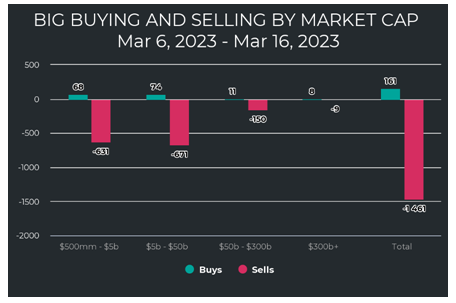
Now we can start to look at where selling was concentrated. Since March 6th– we see clearly that small and midcap stocks bore the brunt of the pressure:
Graphs are for illustrative and discussion purposes only. Please read important disclosures at the end of this commentary.
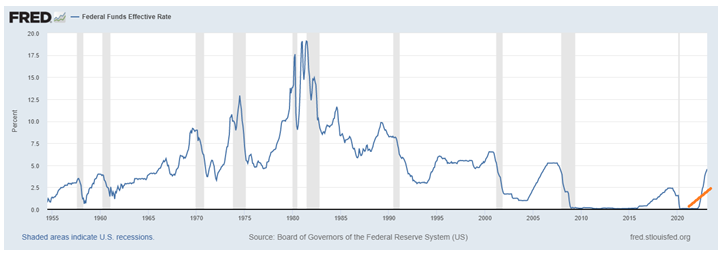
Next, we will look at sector strength and weakness. But before we do – let’s take a moment to discuss how we got here in the first place… The Fed is fighting its war on inflation. The fact is, with the benefit of hindsight, they were slow to react from the fears from COVID. Looking at the chart below of the Fed funds rate, we see that the latest cycle of rate hikes was actually the fastest on record.
Imagine that these rate hikes were slower and started earlier… perhaps we wouldn’t be in the current conundrum. Speaking of which, the fault of the bank failures which occurred over the last few days is debatable. On the one hand, SVB was collateralizing deposits with government bonds, the perceived safest investments out there. That’s good – unless of course, the Dodd-Frank act was rolled back, thus reducing the amount required to be kept in reserves, and unless SVB was buying treasuries in a zero interest rate environment. If rates were almost certain to go up, the value of the collateral (bonds) was sure to go down. Now we get back to the chart of the Fed funds rate… notice the parabolic spike in rates:
Graphs are for illustrative and discussion purposes only. Please read important disclosures at the end of this commentary.
I took the liberty of adding an orange line depicting a slower, steadier hypothetical hiking cycle. Should that have taken place, perhaps the ailing banks would have had more time to adjust. So, was it the fault of SVB and other banks for poor choices in collateral? Yes. Was it the fault of abolishing of the fractional reserve system in favor of a zero-reserve system? Yes. Was it the fed’s fault for zapping us with aggressive chemo style rate hikes? Yes.
Does it ultimately matter who’s fault it is?
Maybe.
Will it change where we are?
No.
So, panic rocked depositors who made a run on the bank (SVB) faster than they could liquidate collateral. Assuredly, this will be researched and documented for years to come. Needless to say, this is what rocked markets of late. The Fed came out and guaranteed deposits for SVB and Silvergate. First Republic got a $30 billion injection from JP Morgan and Bank of America. Credit Suisse came under fire for liquidity and accounting concerns. The Swiss National Bank intervened and failure thus far, is averted.
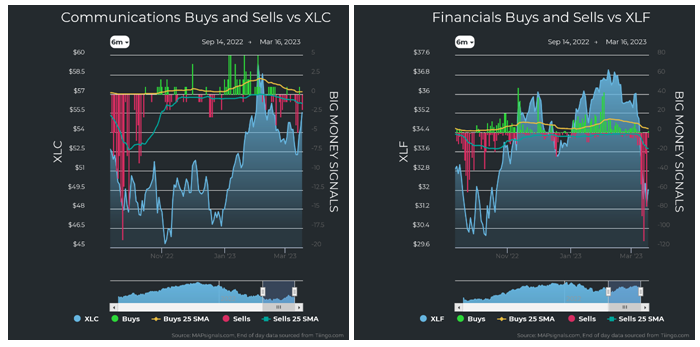
Moving on to sectors, we see that the strength and safety trade is in the unlikeliest of places: tech and discretionary stocks… Bizarro World continues. Unsurprisingly, financials was a bottom-dweller:
![]()
Graphs are for illustrative and discussion purposes only. Please read important disclosures at the end of this commentary.
Fleshing this out a bit, we see that selling hit the whole market last week. That said, tech and discretionary stocks didn’t see as intense selling as they did last September. While we see heavy selling in Industrials, Materials, and Healthcare stocks, it’s plain to see the real pain was in Financials and Energy stocks:
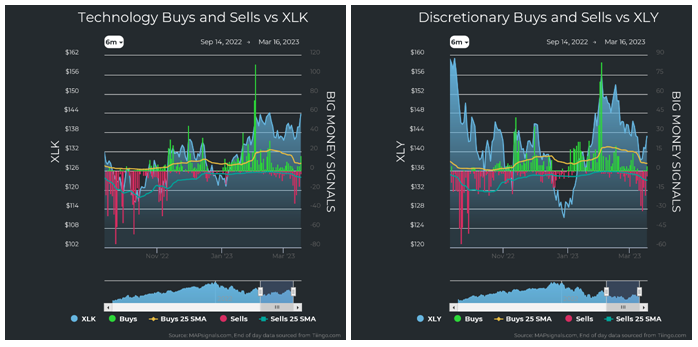
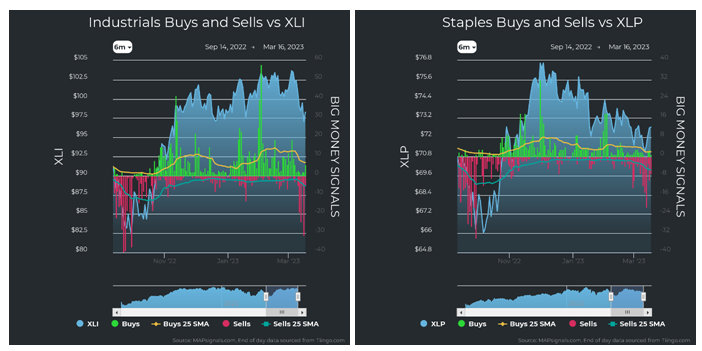
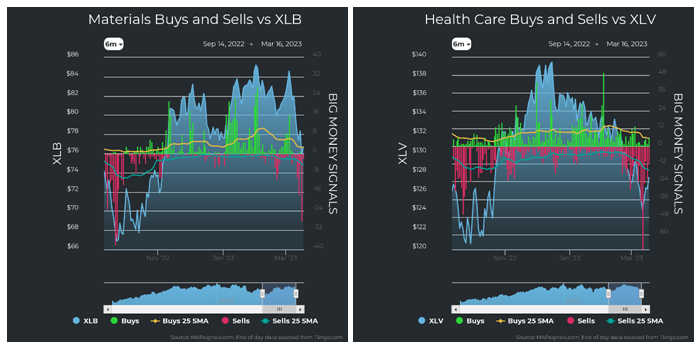
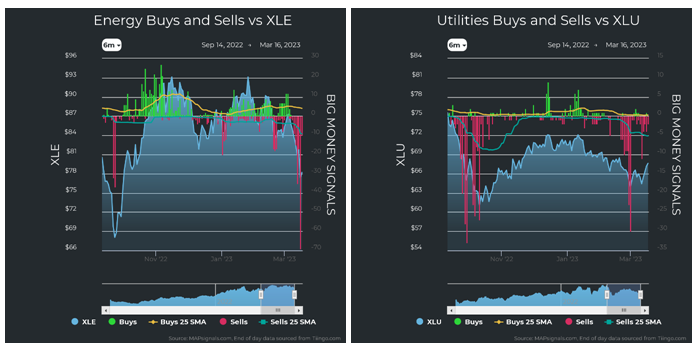
Graphs are for illustrative and discussion purposes only. Please read important disclosures at the end of this commentary.
Where does the market go from here? The BMI visually implies we are on the way to oversold. The law of averages, however, says that’s possibly 3+ weeks away. The potential pivot comes tomorrow, at the FOMC meeting and Summary of Economic Projections… the “dot plots.” Should Powell give dovish statements, stocks could soar. Should he be stubbornly hawkish, stocks could swoon.
I’d add that after a week of grilling at the House/Senate Committee hearings, and the latest financial shoes to drop, that there is real risk of tough-talk, triggering another serious crack in our financial system.
All eyes will be on this week’s Fed meeting. Let’s hope Mr. Powell recalls James 3:5, which says, “The tongue is a small thing, but what enormous damage it can do.”
Navellier & Associates Inc. does not own Silicon Valley Bank (SVB), Silvergate Bank, JpMorgan Chase & Co. (JPM), Bank of America (BAC), Credit Suisse Group (CS), or First Republic Bank (FRC) in managed accounts. Jason Bodner does not personally own Silicon Valley Bank (SVB), Silvergate Bank, JpMorgan Chase & Co. (JPM), Bank of America (BAC), Credit Suisse Group (CS), or First Republic Bank (FRC).
All content above represents the opinion of Jason Bodner of Navellier & Associates, Inc.
Also In This Issue
A Look Ahead by Louis Navellier
The Best and Quickest Ways Out of This Banking Crisis
Income Mail by Bryan Perry
Rapid Transparency Can Quell Any Crisis of Confidence in the Banking Sector
Growth Mail by Gary Alexander
Beware The Ides of March (Part 2)
Global Mail by Ivan Martchev
QE Has Restarted
Sector Spotlight by Jason Bodner
What To Do When You See Red
View Full Archive
Read Past Issues Here

Jason Bodner
MARKETMAIL EDITOR FOR SECTOR SPOTLIGHT
Jason Bodner writes Sector Spotlight in the weekly Marketmail publication and has authored several white papers for the company. He is also Co-Founder of Macro Analytics for Professionals which produces proprietary equity accumulation/distribution research for its clients. Previously, Mr. Bodner served as Director of European Equity Derivatives for Cantor Fitzgerald Europe in London, then moved to the role of Head of Equity Derivatives North America for the same company in New York. He also served as S.V.P. Equity Derivatives for Jefferies, LLC. He received a B.S. in business administration in 1996, with honors, from Skidmore College as a member of the Periclean Honors Society. All content of “Sector Spotlight” represents the opinion of Jason Bodner
Important Disclosures:
Jason Bodner is a co-founder and co-owner of Mapsignals. Mr. Bodner is an independent contractor who is occasionally hired by Navellier & Associates to write an article and or provide opinions for possible use in articles that appear in Navellier & Associates weekly Market Mail. Mr. Bodner is not employed or affiliated with Louis Navellier, Navellier & Associates, Inc., or any other Navellier owned entity. The opinions and statements made here are those of Mr. Bodner and not necessarily those of any other persons or entities. This is not an endorsement, or solicitation or testimonial or investment advice regarding the BMI Index or any statements or recommendations or analysis in the article or the BMI Index or Mapsignals or its products or strategies.
Although information in these reports has been obtained from and is based upon sources that Navellier believes to be reliable, Navellier does not guarantee its accuracy and it may be incomplete or condensed. All opinions and estimates constitute Navellier’s judgment as of the date the report was created and are subject to change without notice. These reports are for informational purposes only and are not a solicitation for the purchase or sale of a security. Any decision to purchase securities mentioned in these reports must take into account existing public information on such securities or any registered prospectus.To the extent permitted by law, neither Navellier & Associates, Inc., nor any of its affiliates, agents, or service providers assumes any liability or responsibility nor owes any duty of care for any consequences of any person acting or refraining to act in reliance on the information contained in this communication or for any decision based on it.
Past performance is no indication of future results. Investment in securities involves significant risk and has the potential for partial or complete loss of funds invested. It should not be assumed that any securities recommendations made by Navellier. in the future will be profitable or equal the performance of securities made in this report. Dividend payments are not guaranteed. The amount of a dividend payment, if any, can vary over time and issuers may reduce dividends paid on securities in the event of a recession or adverse event affecting a specific industry or issuer.
None of the stock information, data, and company information presented herein constitutes a recommendation by Navellier or a solicitation to buy or sell any securities. Any specific securities identified and described do not represent all of the securities purchased, sold, or recommended for advisory clients. The holdings identified do not represent all of the securities purchased, sold, or recommended for advisory clients and the reader should not assume that investments in the securities identified and discussed were or will be profitable.
Information presented is general information that does not take into account your individual circumstances, financial situation, or needs, nor does it present a personalized recommendation to you. Individual stocks presented may not be suitable for every investor. Investment in securities involves significant risk and has the potential for partial or complete loss of funds invested. Investment in fixed income securities has the potential for the investment return and principal value of an investment to fluctuate so that an investor’s holdings, when redeemed, may be worth less than their original cost.
One cannot invest directly in an index. Index is unmanaged and index performance does not reflect deduction of fees, expenses, or taxes. Presentation of Index data does not reflect a belief by Navellier that any stock index constitutes an investment alternative to any Navellier equity strategy or is necessarily comparable to such strategies. Among the most important differences between the Indices and Navellier strategies are that the Navellier equity strategies may (1) incur material management fees, (2) concentrate its investments in relatively few stocks, industries, or sectors, (3) have significantly greater trading activity and related costs, and (4) be significantly more or less volatile than the Indices.
ETF Risk: We may invest in exchange traded funds (“ETFs”) and some of our investment strategies are generally fully invested in ETFs. Like traditional mutual funds, ETFs charge asset-based fees, but they generally do not charge initial sales charges or redemption fees and investors typically pay only customary brokerage fees to buy and sell ETF shares. The fees and costs charged by ETFs held in client accounts will not be deducted from the compensation the client pays Navellier. ETF prices can fluctuate up or down, and a client account could lose money investing in an ETF if the prices of the securities owned by the ETF go down. ETFs are subject to additional risks:
- ETF shares may trade above or below their net asset value;
- An active trading market for an ETF’s shares may not develop or be maintained;
- The value of an ETF may be more volatile than the underlying portfolio of securities the ETF is designed to track;
- The cost of owning shares of the ETF may exceed those a client would incur by directly investing in the underlying securities; and
- Trading of an ETF’s shares may be halted if the listing exchange’s officials deem it appropriate, the shares are delisted from the exchange, or the activation of market-wide “circuit breakers” (which are tied to large decreases in stock prices) halts stock trading generally.
Grader Disclosures: Investment in equity strategies involves substantial risk and has the potential for partial or complete loss of funds invested. The sample portfolio and any accompanying charts are for informational purposes only and are not to be construed as a solicitation to buy or sell any financial instrument and should not be relied upon as the sole factor in an investment making decision. As a matter of normal and important disclosures to you, as a potential investor, please consider the following: The performance presented is not based on any actual securities trading, portfolio, or accounts, and the reported performance of the A, B, C, D, and F portfolios (collectively the “model portfolios”) should be considered mere “paper” or pro forma performance results based on Navellier’s research.
Investors evaluating any of Navellier & Associates, Inc.’s, (or its affiliates’) Investment Products must not use any information presented here, including the performance figures of the model portfolios, in their evaluation of any Navellier Investment Products. Navellier Investment Products include the firm’s mutual funds and managed accounts. The model portfolios, charts, and other information presented do not represent actual funded trades and are not actual funded portfolios. There are material differences between Navellier Investment Products’ portfolios and the model portfolios, research, and performance figures presented here. The model portfolios and the research results (1) may contain stocks or ETFs that are illiquid and difficult to trade; (2) may contain stock or ETF holdings materially different from actual funded Navellier Investment Product portfolios; (3) include the reinvestment of all dividends and other earnings, estimated trading costs, commissions, or management fees; and, (4) may not reflect prices obtained in an actual funded Navellier Investment Product portfolio. For these and other reasons, the reported performances of model portfolios do not reflect the performance results of Navellier’s actually funded and traded Investment Products. In most cases, Navellier’s Investment Products have materially lower performance results than the performances of the model portfolios presented.
This report contains statements that are, or may be considered to be, forward-looking statements. All statements that are not historical facts, including statements about our beliefs or expectations, are “forward-looking statements” within the meaning of The U.S. Private Securities Litigation Reform Act of 1995. These statements may be identified by such forward-looking terminology as “expect,” “estimate,” “plan,” “intend,” “believe,” “anticipate,” “may,” “will,” “should,” “could,” “continue,” “project,” or similar statements or variations of such terms. Our forward-looking statements are based on a series of expectations, assumptions, and projections, are not guarantees of future results or performance, and involve substantial risks and uncertainty as described in Form ADV Part 2A of our filing with the Securities and Exchange Commission (SEC), which is available at www.adviserinfo.sec.gov or by requesting a copy by emailing info@navellier.com. All of our forward-looking statements are as of the date of this report only. We can give no assurance that such expectations or forward-looking statements will prove to be correct. Actual results may differ materially. You are urged to carefully consider all such factors.
FEDERAL TAX ADVICE DISCLAIMER: As required by U.S. Treasury Regulations, you are informed that, to the extent this presentation includes any federal tax advice, the presentation is not written by Navellier to be used, and cannot be used, for the purpose of avoiding federal tax penalties. Navellier does not advise on any income tax requirements or issues. Use of any information presented by Navellier is for general information only and does not represent tax advice either express or implied. You are encouraged to seek professional tax advice for income tax questions and assistance.
IMPORTANT NEWSLETTER DISCLOSURE:The hypothetical performance results for investment newsletters that are authored or edited by Louis Navellier, including Louis Navellier’s Growth Investor, Louis Navellier’s Breakthrough Stocks, Louis Navellier’s Accelerated Profits, and Louis Navellier’s Platinum Club, are not based on any actual securities trading, portfolio, or accounts, and the newsletters’ reported hypothetical performances should be considered mere “paper” or proforma hypothetical performance results and are not actual performance of real world trades. Navellier & Associates, Inc. does not have any relation to or affiliation with the owner of these newsletters. There are material differences between Navellier Investment Products’ portfolios and the InvestorPlace Media, LLC newsletter portfolios authored by Louis Navellier. The InvestorPlace Media, LLC newsletters contain hypothetical performance that do not include transaction costs, advisory fees, or other fees a client might incur if actual investments and trades were being made by an investor. As a result, newsletter performance should not be used to evaluate Navellier Investment services which are separate and different from the newsletters. The owner of the newsletters is InvestorPlace Media, LLC and any questions concerning the newsletters, including any newsletter advertising or hypothetical Newsletter performance claims, (which are calculated solely by Investor Place Media and not Navellier) should be referred to InvestorPlace Media, LLC at (800) 718-8289.
Please note that Navellier & Associates and the Navellier Private Client Group are managed completely independent of the newsletters owned and published by InvestorPlace Media, LLC and written and edited by Louis Navellier, and investment performance of the newsletters should in no way be considered indicative of potential future investment performance for any Navellier & Associates separately managed account portfolio. Potential investors should consult with their financial advisor before investing in any Navellier Investment Product.
Navellier claims compliance with Global Investment Performance Standards (GIPS). To receive a complete list and descriptions of Navellier’s composites and/or a presentation that adheres to the GIPS standards, please contact Navellier or click here. It should not be assumed that any securities recommendations made by Navellier & Associates, Inc. in the future will be profitable or equal the performance of securities made in this report.
FactSet Disclosure: Navellier does not independently calculate the statistical information included in the attached report. The calculation and the information are provided by FactSet, a company not related to Navellier. Although information contained in the report has been obtained from FactSet and is based on sources Navellier believes to be reliable, Navellier does not guarantee its accuracy, and it may be incomplete or condensed. The report and the related FactSet sourced information are provided on an “as is” basis. The user assumes the entire risk of any use made of this information. Investors should consider the report as only a single factor in making their investment decision. The report is for informational purposes only and is not intended as an offer or solicitation for the purchase or sale of a security. FactSet sourced information is the exclusive property of FactSet. Without prior written permission of FactSet, this information may not be reproduced, disseminated or used to create any financial products. All indices are unmanaged and performance of the indices include reinvestment of dividends and interest income, unless otherwise noted, are not illustrative of any particular investment and an investment cannot be made in any index. Past performance is no guarantee of future results.