by Gary Alexander
February 19, 2025
President’s Day this year (Monday, February 17) marked the midpoint between Lincoln’s birthday (February 12) and Washington’s birthday (February 22). When I was in school, those birthday holidays were celebrated separately, on their exact dates, but since 1968, the two have been combined by the “Uniform Monday Holiday Act” to be the third Monday in February, renamed President’s Day.
Expanding beyond those two giants, if I were to name our four most consequential Presidents, they were all born in “Greater February,” adding Franklin Roosevelt’s natal day, January 30 (1882), plus Ronald Reagan (February 6, 1911) as our four top candidates for a winter-born Mount Rushmore. One more could be an asterisk – our shortest-running leader, William Henry Harrison, born February 9, 1773. He gave a two-hour Inauguration talk, sans coat, in freezing weather and died a month into his 1841 term.
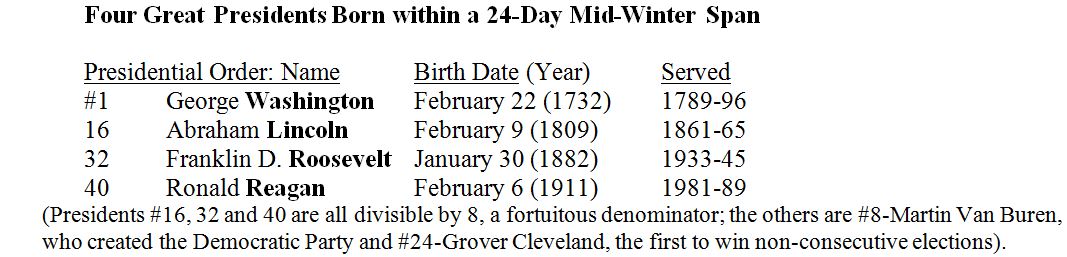
President Washington’s greatest act was perhaps to resign to his farm and not become King George. He was also elected unanimously and refused to start (or join) a political party. Then came the partisan wars, first Adams vs. Jefferson, then the Whigs (like Harrison), and (since 1856) Republicans vs. Democrats.
Presidents #7-Andrew Jackson and #8-Martin Van Buren ran the first Democratic National Convention in 1832, making the Democrats the oldest political party in the world. The Republican Party, founded in 1854, is now #3. (Britain’s Conservative Party, the Tories are now the second oldest, founded in 1834).
Turning to the stock market, pundits have long argued about whether the Republicans (who dominated the White House from 1860 to 1932), are better for business than the Democrats (who dominated from 1932 to 1980, and recently). There are several charts that show stock markets performing better under Democratic leaders – ignoring the composition of Congress. I have long argued, and shown through charts, that “gridlock” (one party controlling Congress, the other controlling the White House), is the best mix for market performance, because it provides checks and balances against too much federal mischief.
However, I will pull back somewhat from that easy generalization now, since there are too many other variables, one of them being Jason Bodner’s recent research into the widely variable volatility under various presidencies since Clinton. Considering the tech stock bubbles, the Great Recession, COVID and other crises, one’s market returns depend greatly on entry and exit points, and an investor’s willingness to ride these massive waves up and down. In addition, the times and dates for measuring presidencies come into question: Do you measure from: (1) election day, (2) the start of calendar years, (3) inauguration day, or (4) long before election day, when markets tend to anticipate the next president’s victory in advance?
So, here are a few caveats for measuring presidencies, parties, and market performance during their terms:
- VOLATILITY is a big deal, as Jason Bodner shows in his columns here.
- The content of CONGRESS is a big deal, for instance in the Clinton years.
- How much the President cooperates with Congress makes a big difference.
- You also must account for inflation, which most charts don’t do.
- It’s probably better to measure from election-day than Inauguration Day.
- Also, Markets ANTICIPATE Presidential wins, in many cases, months in advance.
So, all the historical charts of performances of markets based on Presidents by parties are basically either woefully incomplete or worthless. It’s far better, in my view, to look at the policies-passed in their years:
To measure presidential performance more accurately:
- Examine the Economic POLICIES passed by that President and Congress together (for instance Clinton and the Gingrich Republicans passed capital gains tax cuts and balanced budgets, 1997-2001)
- Adjust all returns for inflation and volatility.
Example #1: Higher Revenues Came from Trump Tax Cuts – Under Biden
The Trump Tax Cuts passed in late 2017 and took effect in 2018. Trump’s final “normal” fiscal year was 2019, before COVID changed our world. Since President Biden did not repeal or change the Trump tax cuts, we now have what amounts to six years of prosperity under Trump’s tax cuts interrupted by one year of COVID-shutdowns in 2020. Who gets credits for rising tax revenues and stock prices, Biden or Trump?
Since 2019, revenues are way up, +42% since 2019, but federal spending is up more, 52% in those same five years, with the five-year cumulative deficits reaching $10.8-trillion, averaging $2.16-trillion per year.
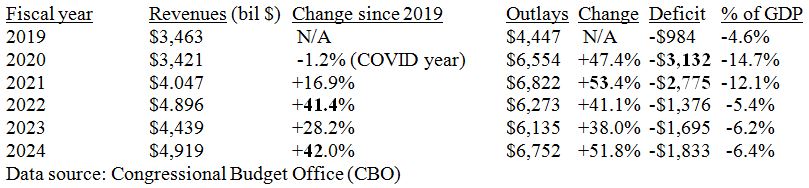
It’s understandable to see spending rise 50% in the COVID year 2020, but why did spending stay well over $6 trillion every year thereafter? The Consumer Price Index (CPI) rose 22.8% from September 30, 2019 – the last day of fiscal year 2019 – to September 30, 2024, while federal spending rose by 51.8%.
Examples 2 & 3: Democrats (Like Kennedy-Johnson and Clinton) Cut Taxes, Too
In “Taxes Have Consequences: An Income Tax History of the United States” (2022), Art Laffer and two other PhD economists (Jeanne Carnes Sinquefield and Brian Domatrovic), focused on the 110 years since the birth of the Fed and income taxes in 1913. Here are two of their examples of Democratic tax cuts:
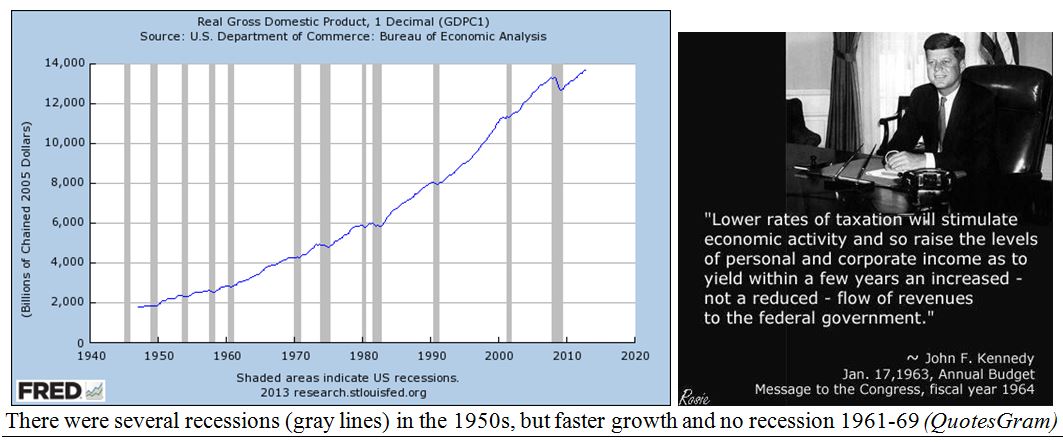
1960s: Kennedy-Johnson: From 1952 to 1963, the top income tax rate was over 90%, resulting in slow growth under President Eisenhower, including three recessions, but Democratic President John Kennedy proposed a cut in top tax rates from 91% to 70% plus a cut in corporate taxes and trade tariffs. He was assassinated before his ideas passed, but Lyndon Johnson passed the “Kennedy-Johnson tax cuts,” and the nation prospered for the rest of the 1960s, with the longest, strongest postwar recovery to that date.
Graphs are for illustrative and discussion purposes only. Please read important disclosures at the end of this commentary.
1997-2001: When the Republicans took over Congress for the first time in 40 years (in 1994), President Bill Clinton changed his policy directives. He made dramatic statements such as “the era of big government is over” and “this is the end of welfare as we know it.” He also cut capital gains taxes from 28% to 20% at the start of his second term, creating a growth spurt, not to mention five straight years of 20% or greater growth in the S&P 500, from 1995 to 1999. The end result was four straight balanced budgets in the federal fiscal years 1998 through 2001, before debt returned with a vengeance since 2001.
So, the first order of business in Trump’s first 100-days is the extension of his 2017 tax cuts, a proven President’s Day formula for generating more revenue as well as more prosperity during the Roaring ‘20s.
All content above represents the opinion of Gary Alexander of Navellier & Associates, Inc.
Also In This Issue
A Look Ahead by Louis Navellier
Europe Fears a Revolution – In German Elections and Trump’s Tariffs
Income Mail by Bryan Perry
AI is Causing a Rising Wave of White-Collar Layoffs
Growth Mail by Gary Alexander
A President’s Day Formula for Soaring Tax Revenues!
Global Mail by Ivan Martchev
Trump’s Strategy of “Reconnaissance Through Battle”
Sector Spotlight by Jason Bodner
The Market is Embracing Change … So Far
View Full Archive
Read Past Issues Here
About The Author

Gary Alexander
SENIOR EDITOR
Gary Alexander has been Senior Writer at Navellier since 2009. He edits Navellier’s weekly Marketmail and writes a weekly Growth Mail column, in which he uses market history to support the case for growth stocks. For the previous 20-years before joining Navellier, he was Senior Executive Editor at InvestorPlace Media (formerly Phillips Publishing), where he worked with several leading investment analysts, including Louis Navellier (since 1997), helping launch Louis Navellier’s Blue Chip Growth and Global Growth newsletters.
Prior to that, Gary edited Wealth Magazine and Gold Newsletter and wrote various investment research reports for Jefferson Financial in New Orleans in the 1980s. He began his financial newsletter career with KCI Communications in 1980, where he served as consulting editor for Personal Finance newsletter while serving as general manager of KCI’s Alexandria House book division. Before that, he covered the economics beat for news magazines. All content of “Growth Mail” represents the opinion of Gary Alexander
Important Disclosures:
Although information in these reports has been obtained from and is based upon sources that Navellier believes to be reliable, Navellier does not guarantee its accuracy and it may be incomplete or condensed. All opinions and estimates constitute Navellier’s judgment as of the date the report was created and are subject to change without notice. These reports are for informational purposes only and are not a solicitation for the purchase or sale of a security. Any decision to purchase securities mentioned in these reports must take into account existing public information on such securities or any registered prospectus.To the extent permitted by law, neither Navellier & Associates, Inc., nor any of its affiliates, agents, or service providers assumes any liability or responsibility nor owes any duty of care for any consequences of any person acting or refraining to act in reliance on the information contained in this communication or for any decision based on it.
Past performance is no indication of future results. Investment in securities involves significant risk and has the potential for partial or complete loss of funds invested. It should not be assumed that any securities recommendations made by Navellier. in the future will be profitable or equal the performance of securities made in this report. Dividend payments are not guaranteed. The amount of a dividend payment, if any, can vary over time and issuers may reduce dividends paid on securities in the event of a recession or adverse event affecting a specific industry or issuer.
None of the stock information, data, and company information presented herein constitutes a recommendation by Navellier or a solicitation to buy or sell any securities. Any specific securities identified and described do not represent all of the securities purchased, sold, or recommended for advisory clients. The holdings identified do not represent all of the securities purchased, sold, or recommended for advisory clients and the reader should not assume that investments in the securities identified and discussed were or will be profitable.
Information presented is general information that does not take into account your individual circumstances, financial situation, or needs, nor does it present a personalized recommendation to you. Individual stocks presented may not be suitable for every investor. Investment in securities involves significant risk and has the potential for partial or complete loss of funds invested. Investment in fixed income securities has the potential for the investment return and principal value of an investment to fluctuate so that an investor’s holdings, when redeemed, may be worth less than their original cost.
One cannot invest directly in an index. Index is unmanaged and index performance does not reflect deduction of fees, expenses, or taxes. Presentation of Index data does not reflect a belief by Navellier that any stock index constitutes an investment alternative to any Navellier equity strategy or is necessarily comparable to such strategies. Among the most important differences between the Indices and Navellier strategies are that the Navellier equity strategies may (1) incur material management fees, (2) concentrate its investments in relatively few stocks, industries, or sectors, (3) have significantly greater trading activity and related costs, and (4) be significantly more or less volatile than the Indices.
ETF Risk: We may invest in exchange traded funds (“ETFs”) and some of our investment strategies are generally fully invested in ETFs. Like traditional mutual funds, ETFs charge asset-based fees, but they generally do not charge initial sales charges or redemption fees and investors typically pay only customary brokerage fees to buy and sell ETF shares. The fees and costs charged by ETFs held in client accounts will not be deducted from the compensation the client pays Navellier. ETF prices can fluctuate up or down, and a client account could lose money investing in an ETF if the prices of the securities owned by the ETF go down. ETFs are subject to additional risks:
- ETF shares may trade above or below their net asset value;
- An active trading market for an ETF’s shares may not develop or be maintained;
- The value of an ETF may be more volatile than the underlying portfolio of securities the ETF is designed to track;
- The cost of owning shares of the ETF may exceed those a client would incur by directly investing in the underlying securities; and
- Trading of an ETF’s shares may be halted if the listing exchange’s officials deem it appropriate, the shares are delisted from the exchange, or the activation of market-wide “circuit breakers” (which are tied to large decreases in stock prices) halts stock trading generally.
Grader Disclosures: Investment in equity strategies involves substantial risk and has the potential for partial or complete loss of funds invested. The sample portfolio and any accompanying charts are for informational purposes only and are not to be construed as a solicitation to buy or sell any financial instrument and should not be relied upon as the sole factor in an investment making decision. As a matter of normal and important disclosures to you, as a potential investor, please consider the following: The performance presented is not based on any actual securities trading, portfolio, or accounts, and the reported performance of the A, B, C, D, and F portfolios (collectively the “model portfolios”) should be considered mere “paper” or pro forma performance results based on Navellier’s research.
Investors evaluating any of Navellier & Associates, Inc.’s, (or its affiliates’) Investment Products must not use any information presented here, including the performance figures of the model portfolios, in their evaluation of any Navellier Investment Products. Navellier Investment Products include the firm’s mutual funds and managed accounts. The model portfolios, charts, and other information presented do not represent actual funded trades and are not actual funded portfolios. There are material differences between Navellier Investment Products’ portfolios and the model portfolios, research, and performance figures presented here. The model portfolios and the research results (1) may contain stocks or ETFs that are illiquid and difficult to trade; (2) may contain stock or ETF holdings materially different from actual funded Navellier Investment Product portfolios; (3) include the reinvestment of all dividends and other earnings, estimated trading costs, commissions, or management fees; and, (4) may not reflect prices obtained in an actual funded Navellier Investment Product portfolio. For these and other reasons, the reported performances of model portfolios do not reflect the performance results of Navellier’s actually funded and traded Investment Products. In most cases, Navellier’s Investment Products have materially lower performance results than the performances of the model portfolios presented.
This report contains statements that are, or may be considered to be, forward-looking statements. All statements that are not historical facts, including statements about our beliefs or expectations, are “forward-looking statements” within the meaning of The U.S. Private Securities Litigation Reform Act of 1995. These statements may be identified by such forward-looking terminology as “expect,” “estimate,” “plan,” “intend,” “believe,” “anticipate,” “may,” “will,” “should,” “could,” “continue,” “project,” or similar statements or variations of such terms. Our forward-looking statements are based on a series of expectations, assumptions, and projections, are not guarantees of future results or performance, and involve substantial risks and uncertainty as described in Form ADV Part 2A of our filing with the Securities and Exchange Commission (SEC), which is available at www.adviserinfo.sec.gov or by requesting a copy by emailing info@navellier.com. All of our forward-looking statements are as of the date of this report only. We can give no assurance that such expectations or forward-looking statements will prove to be correct. Actual results may differ materially. You are urged to carefully consider all such factors.
FEDERAL TAX ADVICE DISCLAIMER: As required by U.S. Treasury Regulations, you are informed that, to the extent this presentation includes any federal tax advice, the presentation is not written by Navellier to be used, and cannot be used, for the purpose of avoiding federal tax penalties. Navellier does not advise on any income tax requirements or issues. Use of any information presented by Navellier is for general information only and does not represent tax advice either express or implied. You are encouraged to seek professional tax advice for income tax questions and assistance.
IMPORTANT NEWSLETTER DISCLOSURE:The hypothetical performance results for investment newsletters that are authored or edited by Louis Navellier, including Louis Navellier’s Growth Investor, Louis Navellier’s Breakthrough Stocks, Louis Navellier’s Accelerated Profits, and Louis Navellier’s Platinum Club, are not based on any actual securities trading, portfolio, or accounts, and the newsletters’ reported hypothetical performances should be considered mere “paper” or proforma hypothetical performance results and are not actual performance of real world trades. Navellier & Associates, Inc. does not have any relation to or affiliation with the owner of these newsletters. There are material differences between Navellier Investment Products’ portfolios and the InvestorPlace Media, LLC newsletter portfolios authored by Louis Navellier. The InvestorPlace Media, LLC newsletters contain hypothetical performance that do not include transaction costs, advisory fees, or other fees a client might incur if actual investments and trades were being made by an investor. As a result, newsletter performance should not be used to evaluate Navellier Investment services which are separate and different from the newsletters. The owner of the newsletters is InvestorPlace Media, LLC and any questions concerning the newsletters, including any newsletter advertising or hypothetical Newsletter performance claims, (which are calculated solely by Investor Place Media and not Navellier) should be referred to InvestorPlace Media, LLC at (800) 718-8289.
Please note that Navellier & Associates and the Navellier Private Client Group are managed completely independent of the newsletters owned and published by InvestorPlace Media, LLC and written and edited by Louis Navellier, and investment performance of the newsletters should in no way be considered indicative of potential future investment performance for any Navellier & Associates separately managed account portfolio. Potential investors should consult with their financial advisor before investing in any Navellier Investment Product.
Navellier claims compliance with Global Investment Performance Standards (GIPS). To receive a complete list and descriptions of Navellier’s composites and/or a presentation that adheres to the GIPS standards, please contact Navellier or click here. It should not be assumed that any securities recommendations made by Navellier & Associates, Inc. in the future will be profitable or equal the performance of securities made in this report.
FactSet Disclosure: Navellier does not independently calculate the statistical information included in the attached report. The calculation and the information are provided by FactSet, a company not related to Navellier. Although information contained in the report has been obtained from FactSet and is based on sources Navellier believes to be reliable, Navellier does not guarantee its accuracy, and it may be incomplete or condensed. The report and the related FactSet sourced information are provided on an “as is” basis. The user assumes the entire risk of any use made of this information. Investors should consider the report as only a single factor in making their investment decision. The report is for informational purposes only and is not intended as an offer or solicitation for the purchase or sale of a security. FactSet sourced information is the exclusive property of FactSet. Without prior written permission of FactSet, this information may not be reproduced, disseminated or used to create any financial products. All indices are unmanaged and performance of the indices include reinvestment of dividends and interest income, unless otherwise noted, are not illustrative of any particular investment and an investment cannot be made in any index. Past performance is no guarantee of future results.