by Gary Alexander
Dcember 5, 2023
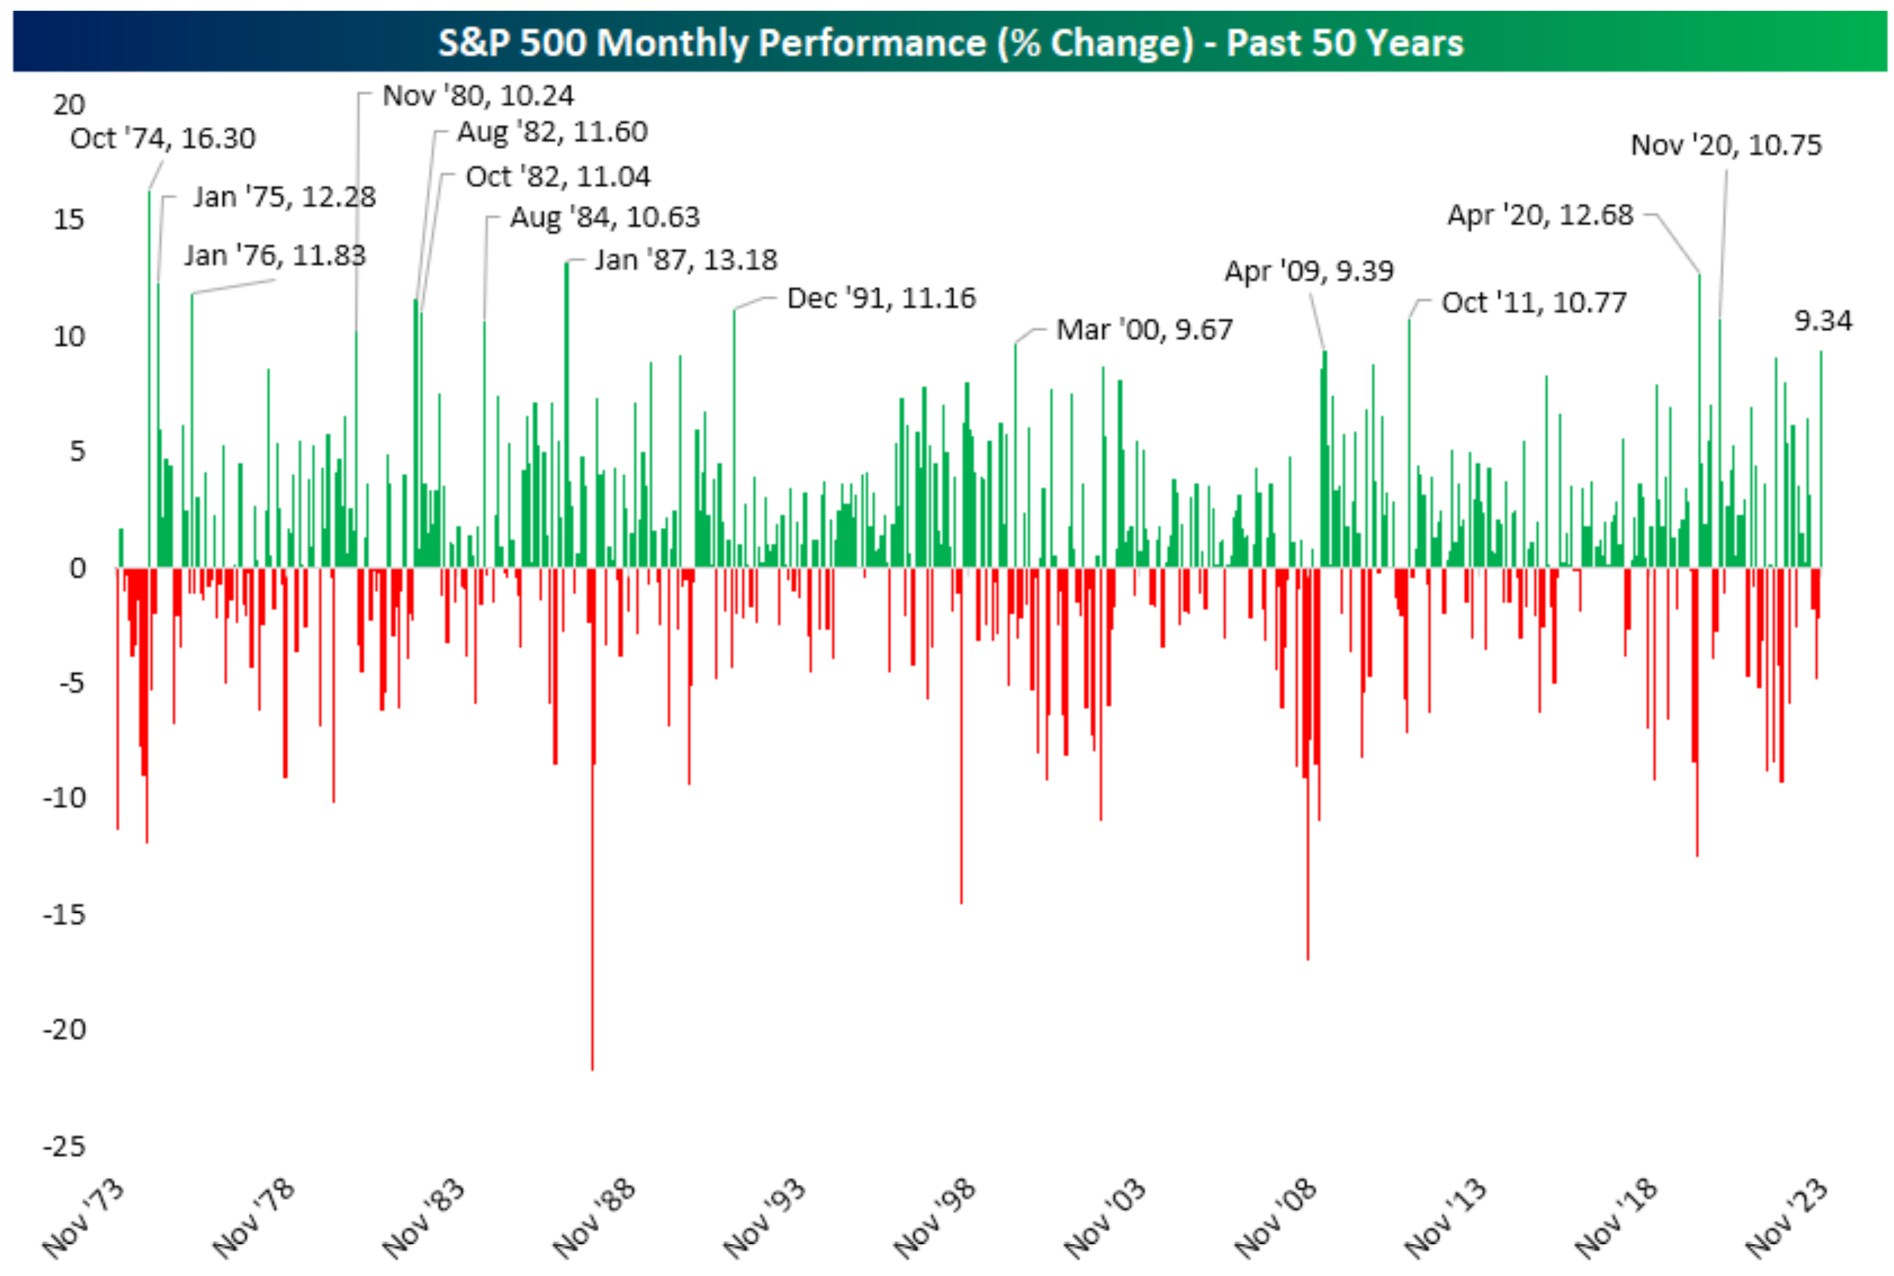
November turned out to be one of the best months in recent market history, gaining 8.92% in the S&P 500, or 9.1%, counting dividends. The NASDAQ Composite gained double-digits, at +10.7%.
November was the sixth best month for the S&P in the last 30 years, according to Bespoke Investment Group, which posted this chart last Thursday, when the S&P was up 9.34%, on the intra-day opening.
Graphs are for illustrative and discussion purposes only. Please read important disclosures at the end of this commentary.
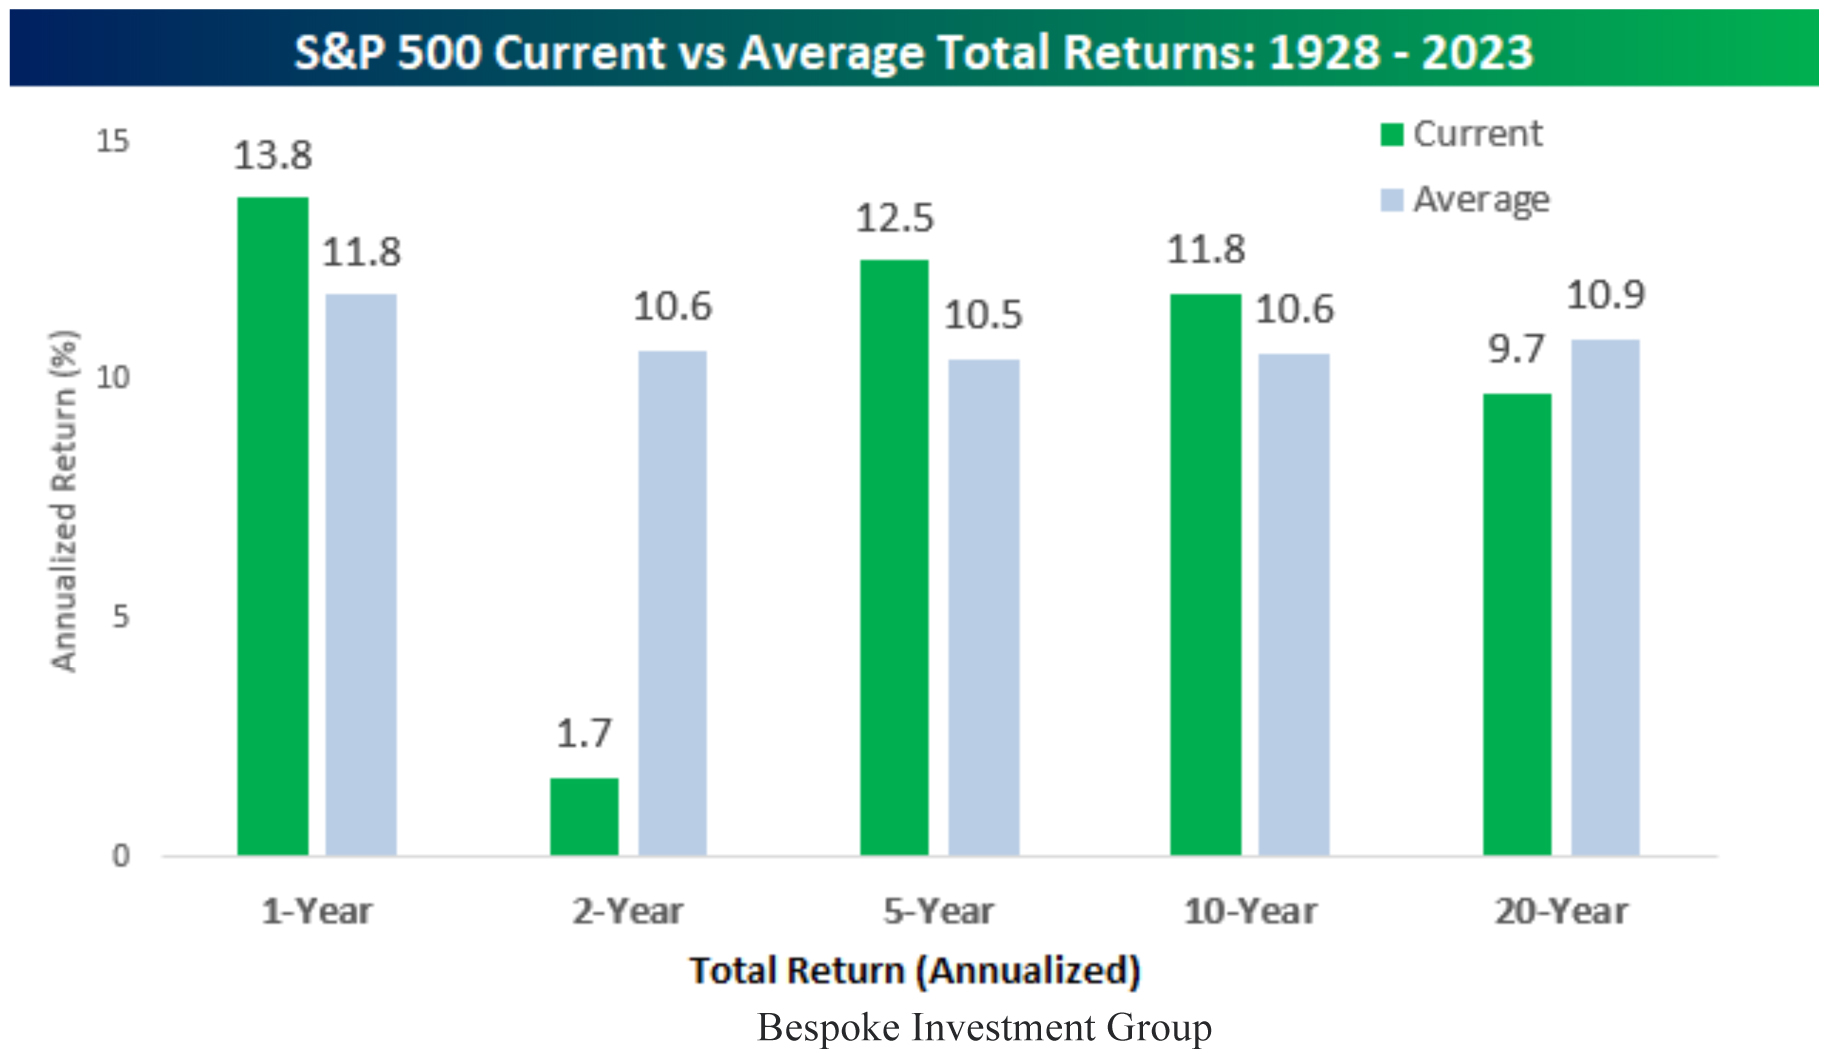
According to Bespoke, “The S&P 500 had its best month since July 2022, and only its 15th monthly gain of over 9% since the start of 1980. With November’s gain, the S&P 500 is up 13.8% over the last year, which is two percentage points better than the one-year average total return of 11.8% dating back to 1928.” But they sobered us up with this two-year total of virtually no change – in fact, down 0.8 points:
S&P 500 close on 11/30/23: 4,567.80
S&P 500 close on 11/30/21: 4,567.00
However, Bespoke assures us that, “Returns for the last five and ten years have been modestly above average, while the 20-year annualized gain of 9.7% is 1.2 percentage points below the historical average.”
Graphs are for illustrative and discussion purposes only. Please read important disclosures at the end of this commentary.
December is Another Great Month in Market History
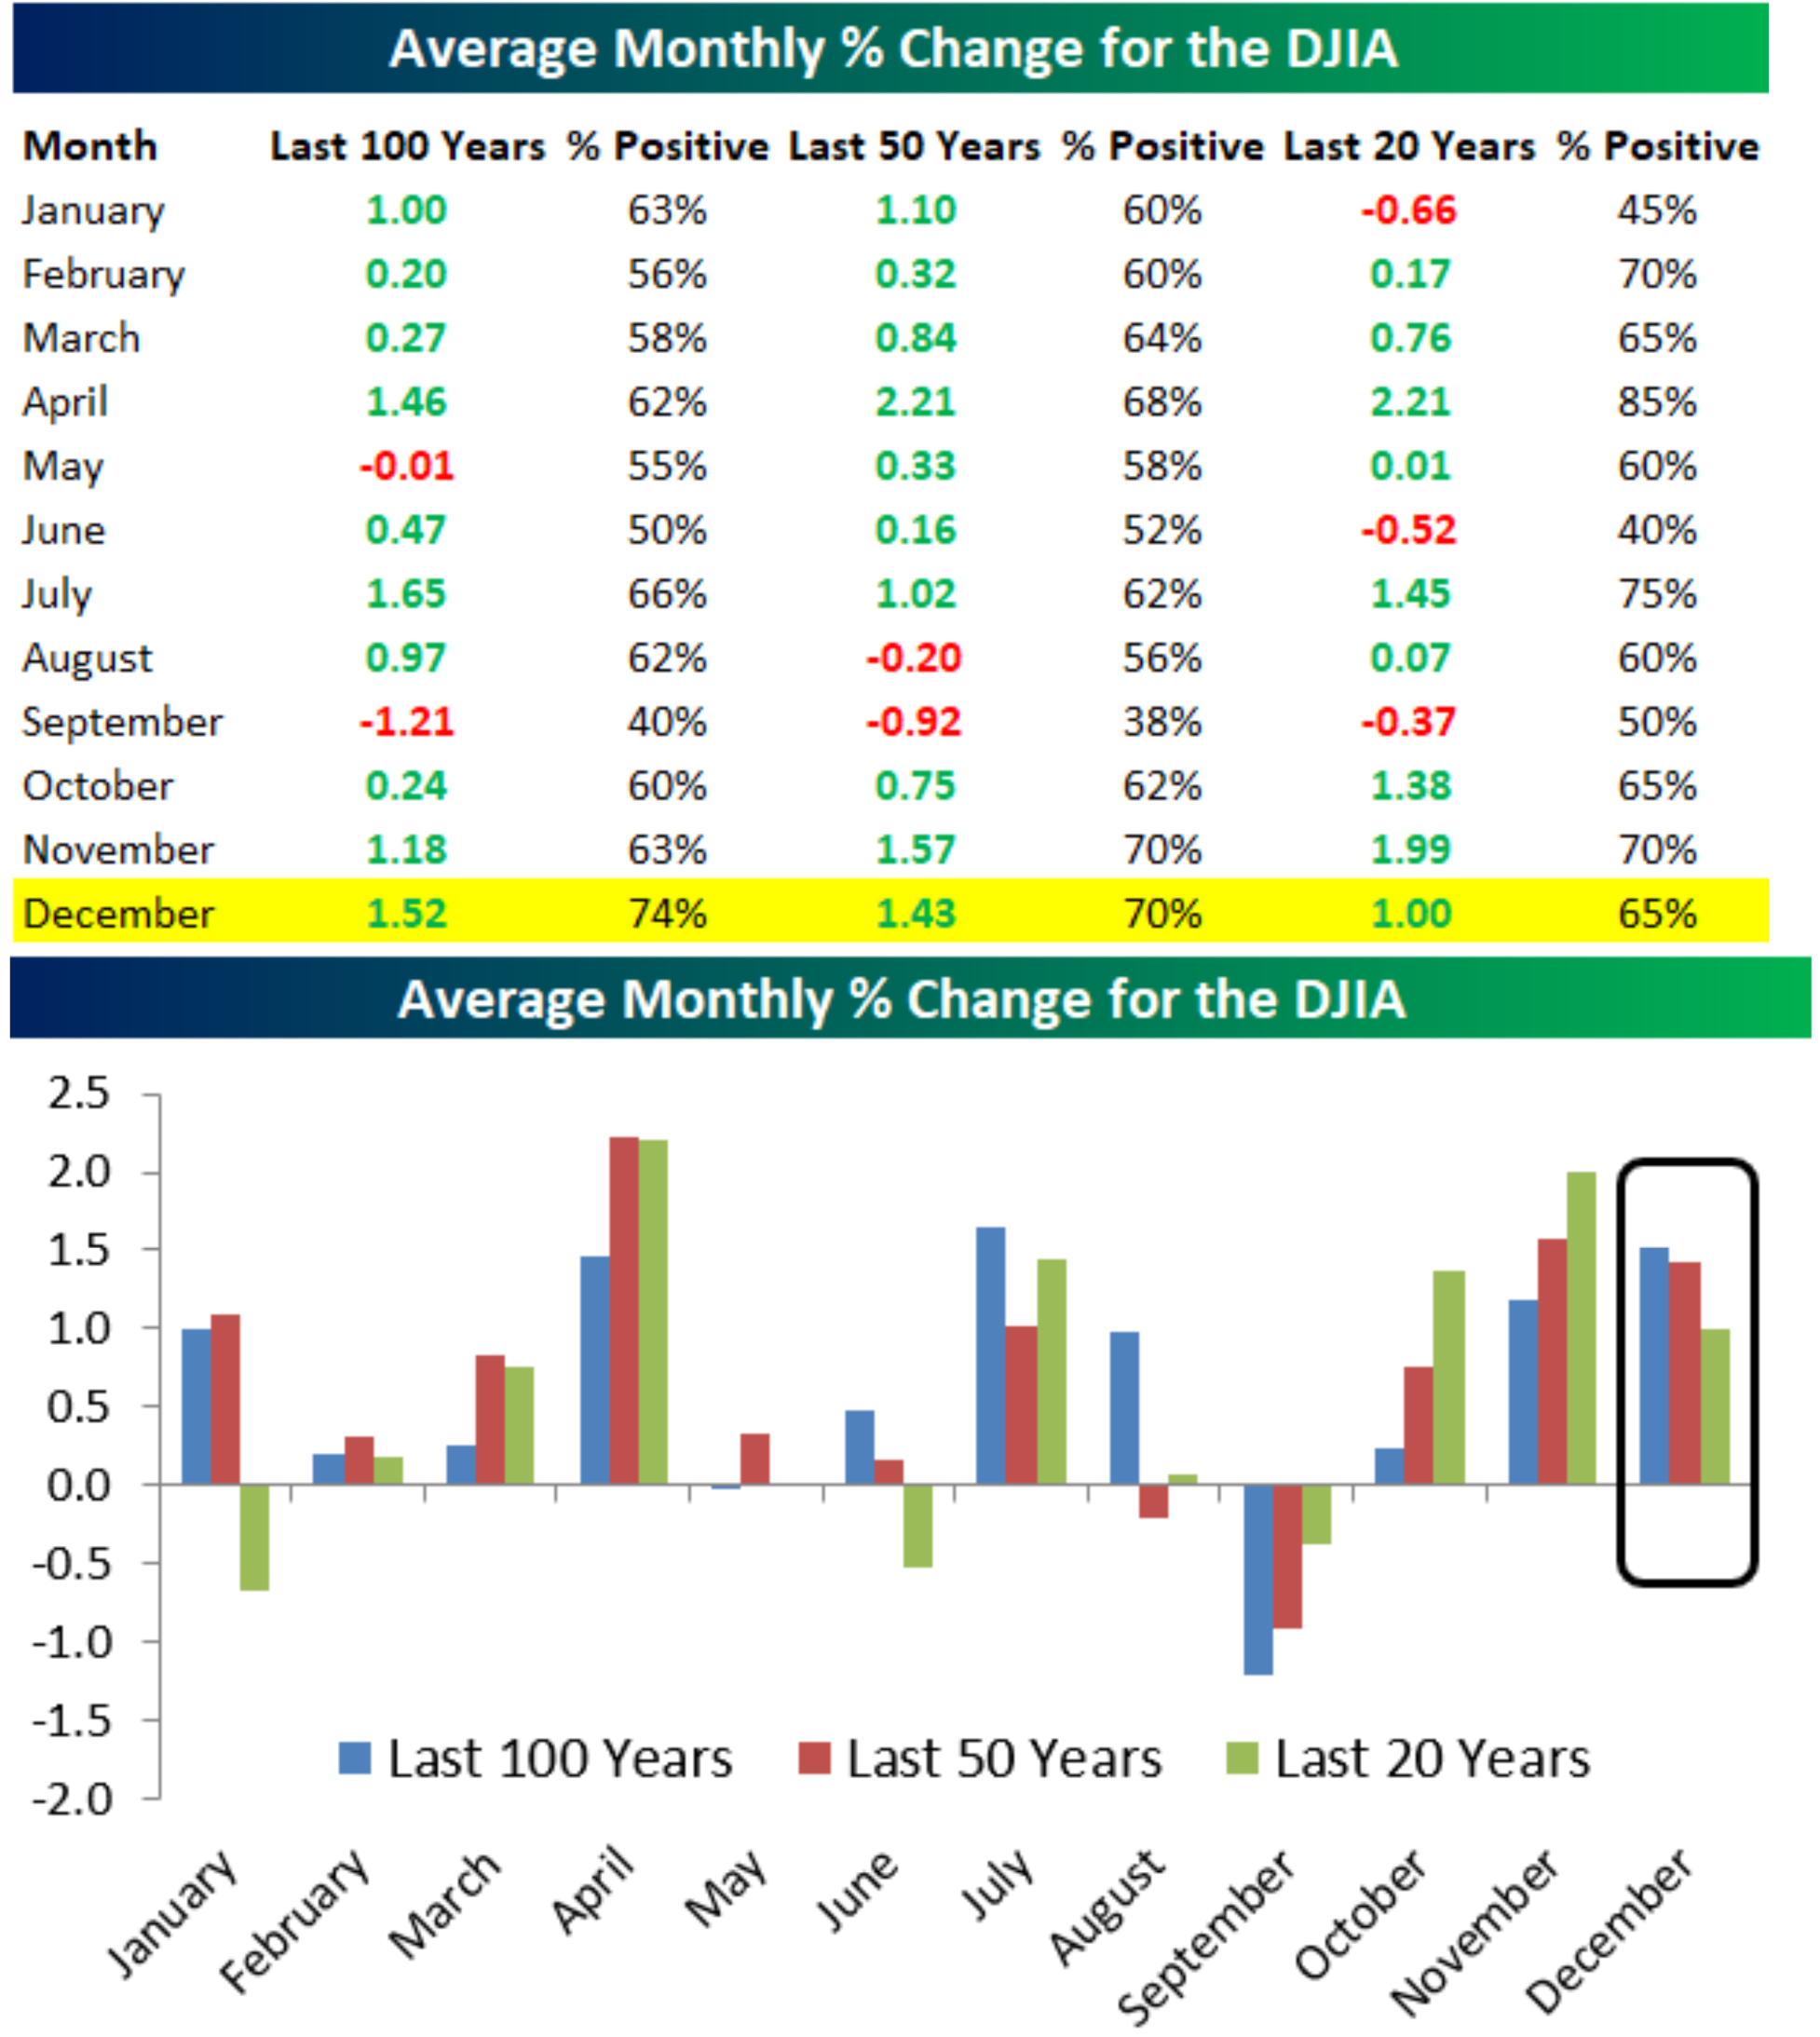
How about December? Bespoke reported that the S&P 500 has historically (since 1929) averaged a 1.3% gain in December, with positive performance 73.7% of the time. More specifically, “Years like this year, with both a 5%+ gain in November and a 15%+ year-to-date gain through the end of November, have averaged a stronger-than-normal 1.4% gain.” From Bespoke’s seasonality table, below, you can see that December ranks as the second strongest month (to July) over the past century, with an average gain of 1.52%, and positive performance 74% of the time (the best of any month), but December is less stellar lately (at #5). At the same time, the fourth quarter has gained in power in the last 20 years versus 100 years.
Graphs are for illustrative and discussion purposes only. Please read important disclosures at the end of this commentary.
The fourth quarter has progressed from cumulative +2.96% average gains over the last 100 years to +4.43% over the last 20 years, and the fourth quarter now surpasses the gains in the first nine months.
Now, let’s turn our eyes to 2024 by looking back to some Greek words and their etymological roots:
Four Greek/English Words that Point to a Better 2024
Here are four four-syllable words of Greek origin that point to a better 2024, especially in America:
- Democracy (Demos = people; kratos = power): The election of 2024 could supercharge growth.
- Demographics (Demos = people; Graph = chart): U.S. labor force and immigration fuel growth.
- Economics (Oikos = household; Nomos = law or management): Business profits also fuel growth.
- Technology (Tekhno = art, craft, technique; Logos = study of): Scientific breakthroughs fuel growth.
Let’s tackle Technology and Economics first, as they usually supercharge each other:
First, let me repeat my alignment with Ed Yardeni’s main thesis, that we can create another Roaring ‘20s through technological innovation, in contradiction to the latest (19th) edition of the reigning Economics textbook (2010) by Paul Samuelson and William Nordhaus, which teaches that economics “is the study of how societies use scarce resources to produce valuable goods and services and distribute them among different individuals.” This definition hasn’t changed since the first edition was published in 1948.
In his excellent 2018 book, Predicting the Markets, Yardeni countered: “I’ve learned that economics isn’t a zero-sum game, as implied by that definition. Economics is about using technology to increase everyone’s standard of living. Technological innovations are driven by the profits that can be earned by solving the problems posed by scarce resources. Free markets provide profit incentives to motivate innovators to solve this problem. As they do so, consumer prices tend to fall, driven by their innovations. The market distributes the resulting benefits to all consumers. From my perspective, economics is about creating and spreading abundance, not about distributing scarcity. In other words, don’t worry, be happy!
Yardeni believes we can solve our biggest economic problems through technology and imagination. For instance, we can solve the global shortage of labor by boosting productivity through AI, automation and robotics. Also, I believe we can solve any climate crisis (real or imagined) by telecommunications (less travel) and cleaner energy through technological innovation, not draconian anti-growth policies. Ed Yardeni seems to agree, saying, “The federal government is implementing subsidies and penalties to force the reallocation of capital investments. Governments have a poor record of allocating resources.”
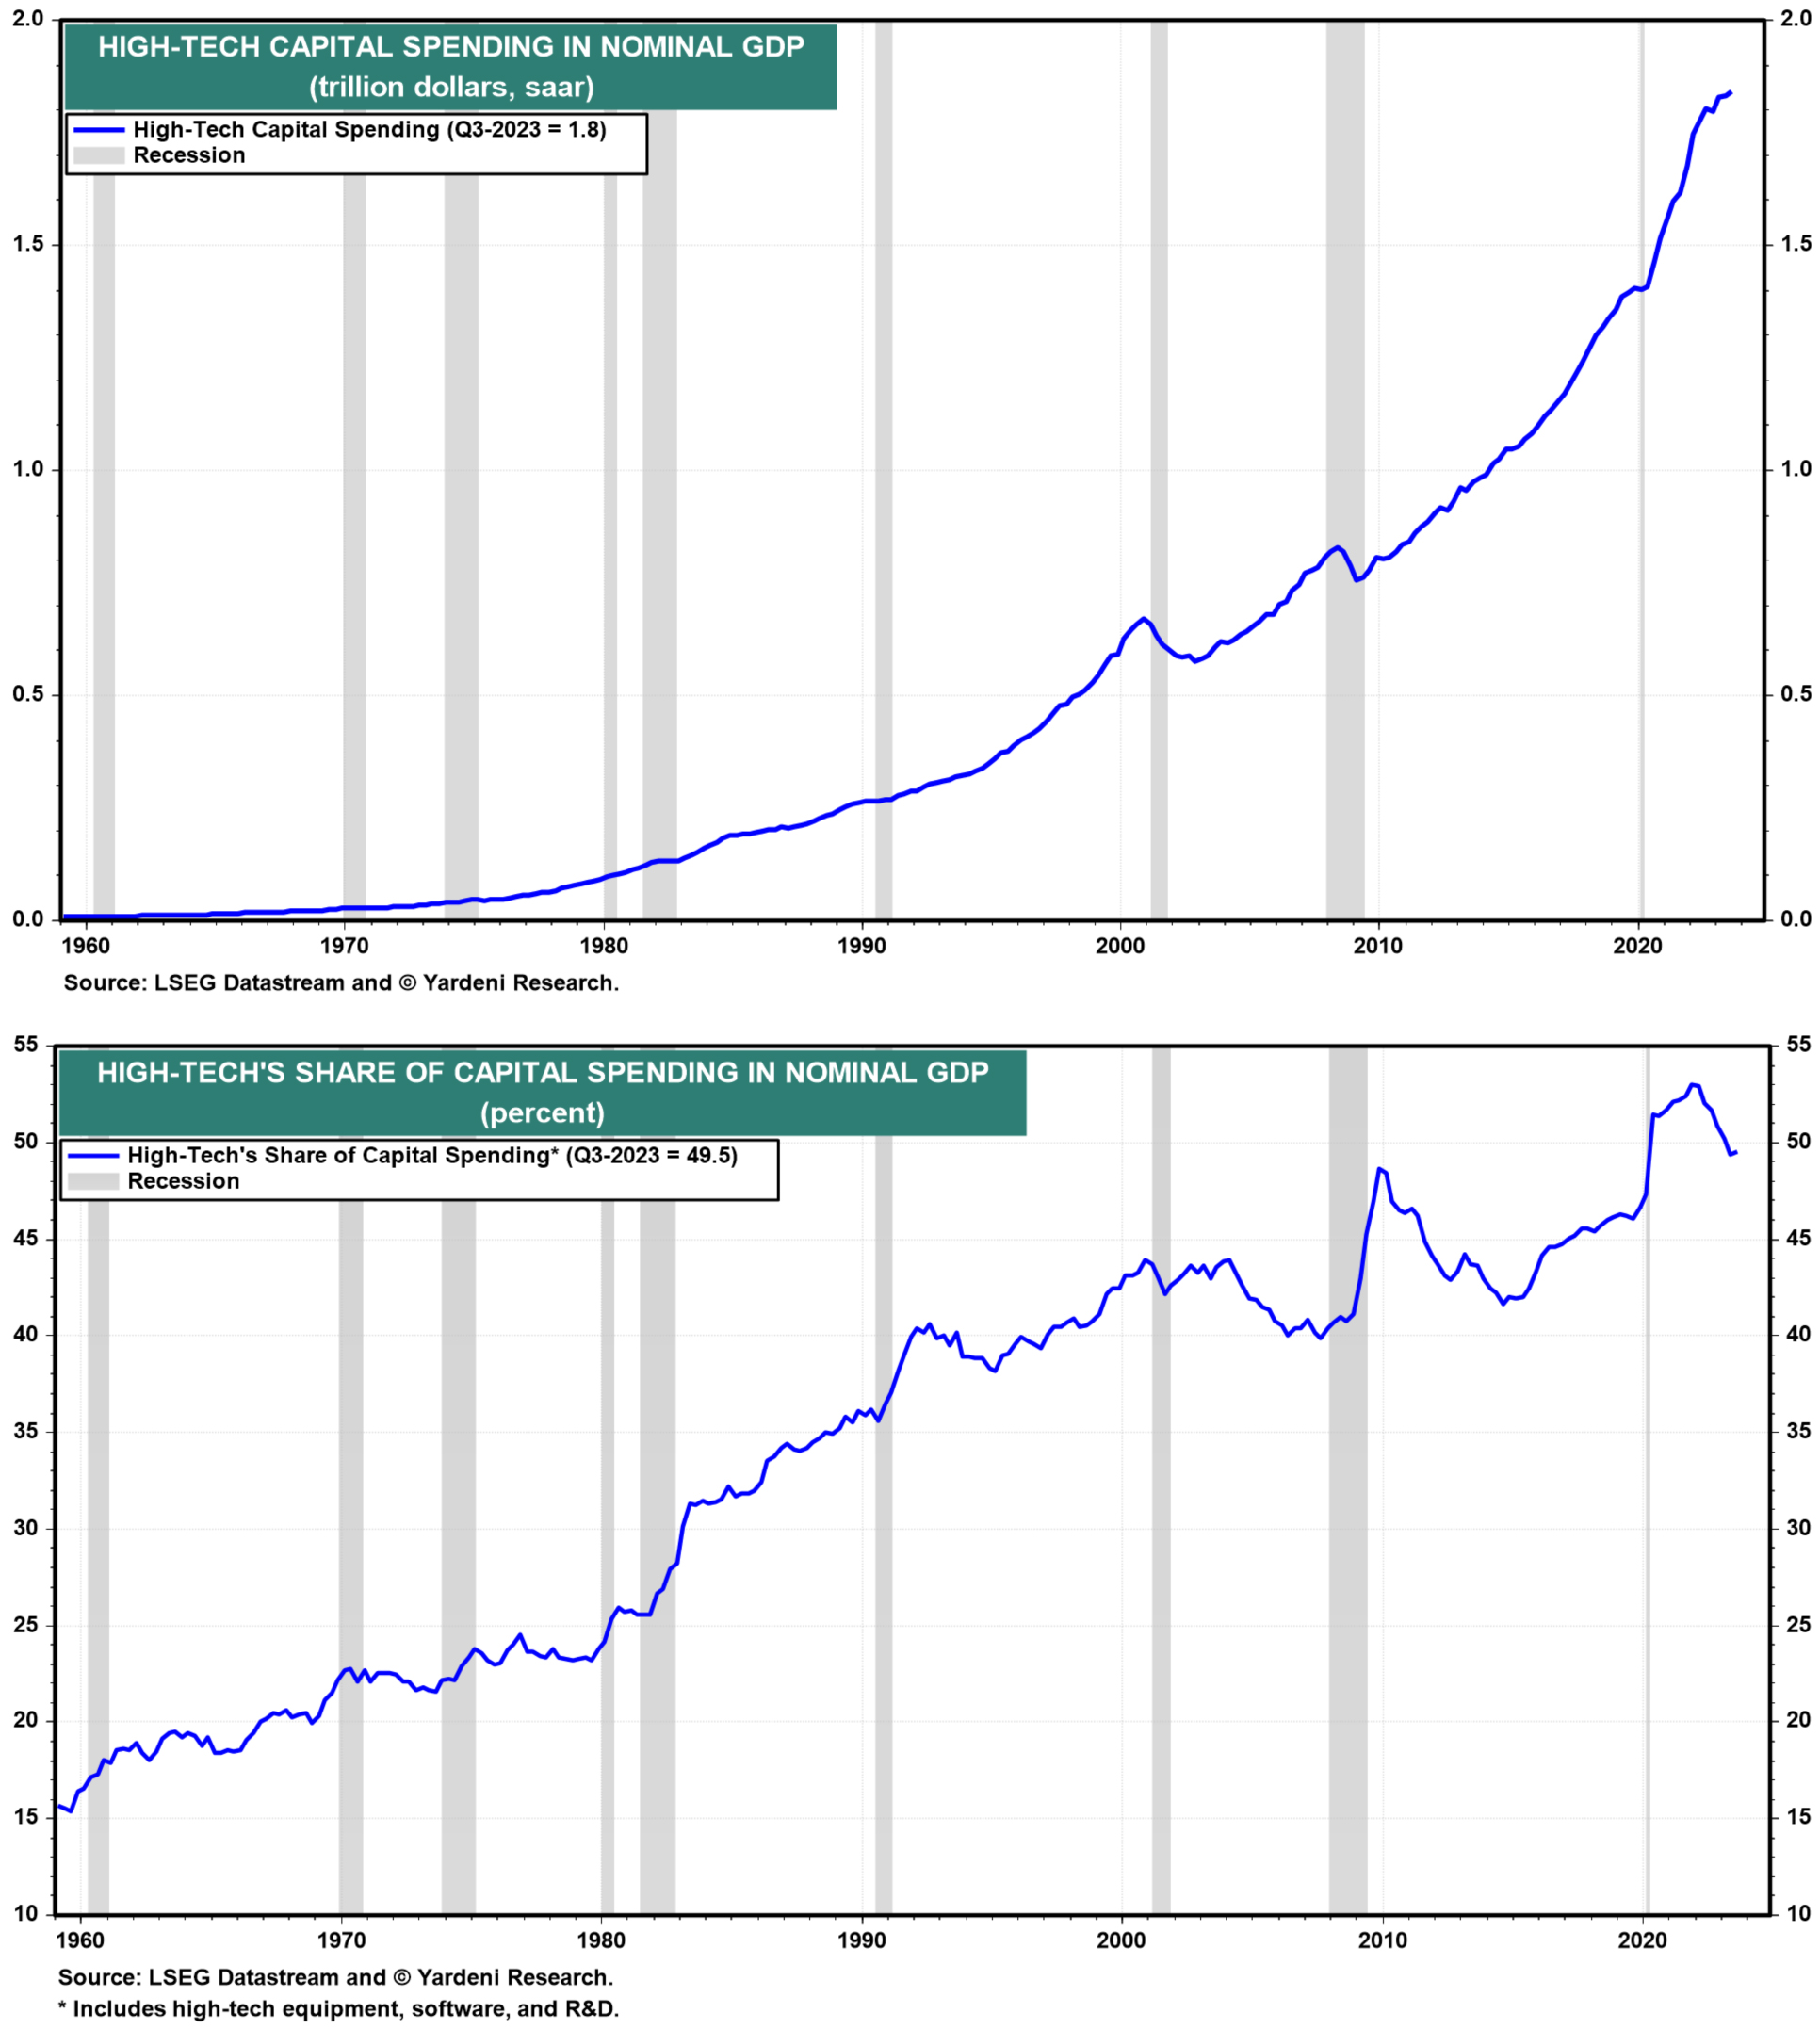
Yardeni cites the value of our soaring high-tech capital spending on IT equipment, software, and R&D in the U.S., rising to a record $1.84 trillion last quarter, and averaging around 50% of total capital spending since the pandemic, up from only about 25% during 1980 (see the two charts, below).
Graphs are for illustrative and discussion purposes only. Please read important disclosures at the end of this commentary.
Now, on to Demographics and Democracy:
Demographics favor the U.S. China’s population actually fell by 850,000 in 2022, their first decline in population since their Great Famine of 1960-61. In a land of 1.4 billion people, there were fewer than one million births (956,000) last year. The implications are widespread and massive. There are not enough young workers for their “Made in China” exporting colossus, nor enough workers to fund pensions and services for the massive army of infirm elderly. There is a deflationary collapse of property values.
The Shenzhen Real Estate stock price index peaked during 2020. It is down 52.5% since then, while the Chinese MSCI is down 54.5% since February 17, 2021. Both Chinese stock markets are flat since 2007:
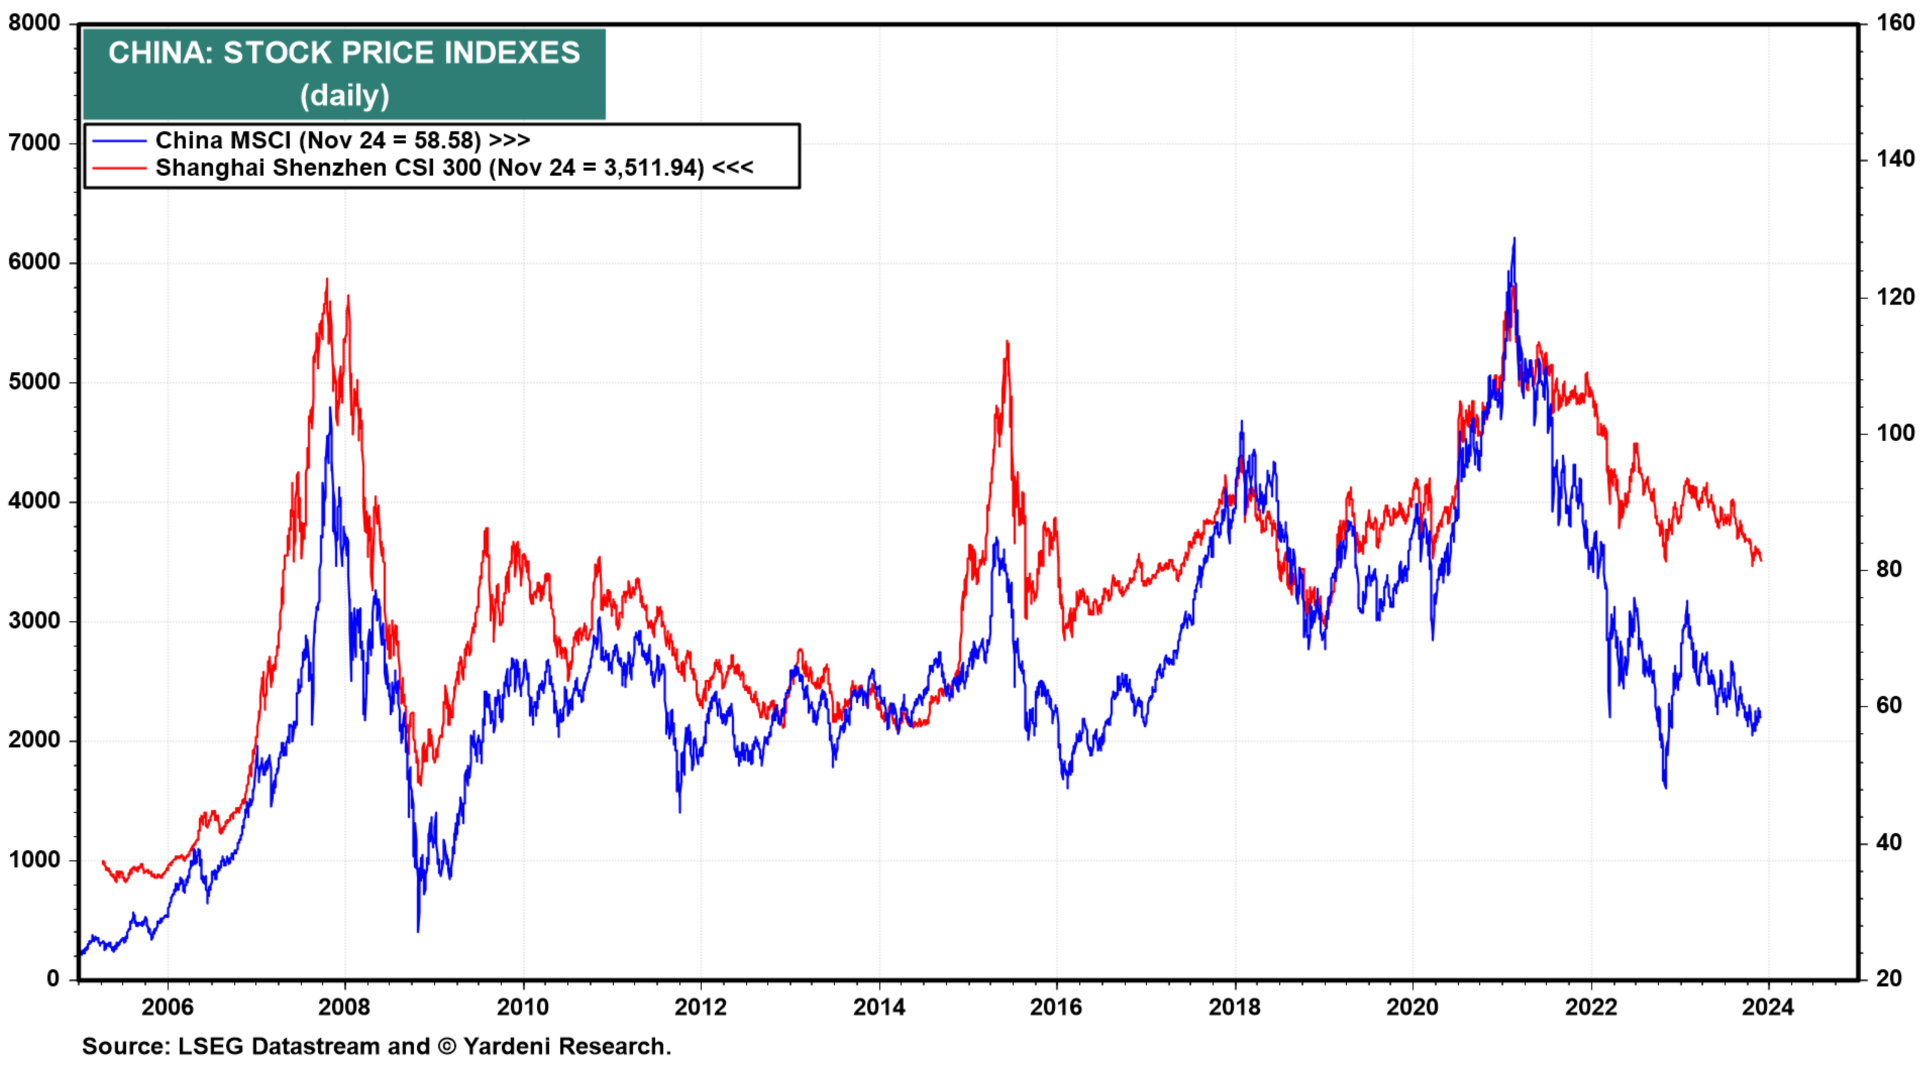
Graphs are for illustrative and discussion purposes only. Please read important disclosures at the end of this commentary.
Japan is also on a negative population curve – they are having fewer and fewer children – and neither China nor Japan generally accepts immigrants that aren’t of their “own breed”. They are “closed societies.”
Many European nations are also in demographic decline, and they are revolting against rapid immigration from Middle Eastern Islamic societies who do not wish to assimilate into European traditional values.
America, as many problems as we seem to have, is still the most welcoming nation for immigrants, and still has a relatively high birth rate. We also have the most mobile work force and the most business-friendly entrepreneurial structure for rewarding technological innovation, as witnessed by the percentage of new companies and scientific breakthroughs that originate here versus the rest of the world combined.
U.S. Household Net Worth (yes, that includes all debts) was $154.3 trillion as of mid-2023. Yardeni says, “There has never been a generation with as much in their retirement nest eggs as the Baby Boomers. Indeed, this cohort holds about half the $154.3 trillion in US household net worth.” A shocking (to me) 40% of U.S. homes (35 million households) are now mortgage free, many occupied by the newly retired.
Democracy will be the key next year. Voters weren’t mad enough at inflation and deficits in 2022 to throw their Congressional miscreants out of office, but maybe they will be next November. The sentiment polls seem to indicate a lot of discontent, but perhaps a decline in inflation, a higher stock market and some interest rate cuts next year will bring sunnier sentiment, wiping out that pessimism in time for most Congressional “drunken sailors” to continue over-spending into oblivion for the rest of the Roaring ‘20s.
That’s the big wild card for 2024. As Yardeni concluded, “With the benefit of hindsight, 2023 has been a year of nothing to fear but fear itself. In 2024, we may have to worry that there isn’t enough fear to temper investor optimism.” My biggest fear is that 2024 will be so good we won’t seek political change.
If we don’t alter the spendthrift politics of the 2020s so far, they will “Roar no More after ‘24*”
*Here’s one final Greek multi-root word: Politics: Poli = many; tics = bloodsucking insects.

All content above represents the opinion of Gary Alexander of Navellier & Associates, Inc.
Also In This Issue
A Look Ahead by Louis Navellier
The Fourth Quarter Started Slow, but It May Finish Strong
Income Mail by Bryan Perry
Stocks Building on Gains Under the Power Of Bullish Fund Flows
Growth Mail by Gary Alexander
After a Bountiful Thanksgiving, Will Santa Deliver Too?
Global Mail by Ivan Martchev
A “Reluctant Rotation” Has Begun
Sector Spotlight by Jason Bodner
Only You Can Prevent (or Profit From) Market “Forest Fires”
View Full Archive
Read Past Issues Here
About The Author

Gary Alexander
SENIOR EDITOR
Gary Alexander has been Senior Writer at Navellier since 2009. He edits Navellier’s weekly Marketmail and writes a weekly Growth Mail column, in which he uses market history to support the case for growth stocks. For the previous 20 years before joining Navellier, he was Senior Executive Editor at InvestorPlace Media (formerly Phillips Publishing), where he worked with several leading investment analysts, including Louis Navellier (since 1997), helping launch Louis Navellier’s Blue Chip Growth and Global Growth newsletters.
Prior to that, Gary edited Wealth Magazine and Gold Newsletter and wrote various investment research reports for Jefferson Financial in New Orleans in the 1980s. He began his financial newsletter career with KCI Communications in 1980, where he served as consulting editor for Personal Finance newsletter while serving as general manager of KCI’s Alexandria House book division. Before that, he covered the economics beat for news magazines. All content of “Growth Mail” represents the opinion of Gary Alexander
Important Disclosures:
Although information in these reports has been obtained from and is based upon sources that Navellier believes to be reliable, Navellier does not guarantee its accuracy and it may be incomplete or condensed. All opinions and estimates constitute Navellier’s judgment as of the date the report was created and are subject to change without notice. These reports are for informational purposes only and are not a solicitation for the purchase or sale of a security. Any decision to purchase securities mentioned in these reports must take into account existing public information on such securities or any registered prospectus.To the extent permitted by law, neither Navellier & Associates, Inc., nor any of its affiliates, agents, or service providers assumes any liability or responsibility nor owes any duty of care for any consequences of any person acting or refraining to act in reliance on the information contained in this communication or for any decision based on it.
Past performance is no indication of future results. Investment in securities involves significant risk and has the potential for partial or complete loss of funds invested. It should not be assumed that any securities recommendations made by Navellier. in the future will be profitable or equal the performance of securities made in this report. Dividend payments are not guaranteed. The amount of a dividend payment, if any, can vary over time and issuers may reduce dividends paid on securities in the event of a recession or adverse event affecting a specific industry or issuer.
None of the stock information, data, and company information presented herein constitutes a recommendation by Navellier or a solicitation to buy or sell any securities. Any specific securities identified and described do not represent all of the securities purchased, sold, or recommended for advisory clients. The holdings identified do not represent all of the securities purchased, sold, or recommended for advisory clients and the reader should not assume that investments in the securities identified and discussed were or will be profitable.
Information presented is general information that does not take into account your individual circumstances, financial situation, or needs, nor does it present a personalized recommendation to you. Individual stocks presented may not be suitable for every investor. Investment in securities involves significant risk and has the potential for partial or complete loss of funds invested. Investment in fixed income securities has the potential for the investment return and principal value of an investment to fluctuate so that an investor’s holdings, when redeemed, may be worth less than their original cost.
One cannot invest directly in an index. Index is unmanaged and index performance does not reflect deduction of fees, expenses, or taxes. Presentation of Index data does not reflect a belief by Navellier that any stock index constitutes an investment alternative to any Navellier equity strategy or is necessarily comparable to such strategies. Among the most important differences between the Indices and Navellier strategies are that the Navellier equity strategies may (1) incur material management fees, (2) concentrate its investments in relatively few stocks, industries, or sectors, (3) have significantly greater trading activity and related costs, and (4) be significantly more or less volatile than the Indices.
ETF Risk: We may invest in exchange traded funds (“ETFs”) and some of our investment strategies are generally fully invested in ETFs. Like traditional mutual funds, ETFs charge asset-based fees, but they generally do not charge initial sales charges or redemption fees and investors typically pay only customary brokerage fees to buy and sell ETF shares. The fees and costs charged by ETFs held in client accounts will not be deducted from the compensation the client pays Navellier. ETF prices can fluctuate up or down, and a client account could lose money investing in an ETF if the prices of the securities owned by the ETF go down. ETFs are subject to additional risks:
- ETF shares may trade above or below their net asset value;
- An active trading market for an ETF’s shares may not develop or be maintained;
- The value of an ETF may be more volatile than the underlying portfolio of securities the ETF is designed to track;
- The cost of owning shares of the ETF may exceed those a client would incur by directly investing in the underlying securities; and
- Trading of an ETF’s shares may be halted if the listing exchange’s officials deem it appropriate, the shares are delisted from the exchange, or the activation of market-wide “circuit breakers” (which are tied to large decreases in stock prices) halts stock trading generally.
Grader Disclosures: Investment in equity strategies involves substantial risk and has the potential for partial or complete loss of funds invested. The sample portfolio and any accompanying charts are for informational purposes only and are not to be construed as a solicitation to buy or sell any financial instrument and should not be relied upon as the sole factor in an investment making decision. As a matter of normal and important disclosures to you, as a potential investor, please consider the following: The performance presented is not based on any actual securities trading, portfolio, or accounts, and the reported performance of the A, B, C, D, and F portfolios (collectively the “model portfolios”) should be considered mere “paper” or pro forma performance results based on Navellier’s research.
Investors evaluating any of Navellier & Associates, Inc.’s, (or its affiliates’) Investment Products must not use any information presented here, including the performance figures of the model portfolios, in their evaluation of any Navellier Investment Products. Navellier Investment Products include the firm’s mutual funds and managed accounts. The model portfolios, charts, and other information presented do not represent actual funded trades and are not actual funded portfolios. There are material differences between Navellier Investment Products’ portfolios and the model portfolios, research, and performance figures presented here. The model portfolios and the research results (1) may contain stocks or ETFs that are illiquid and difficult to trade; (2) may contain stock or ETF holdings materially different from actual funded Navellier Investment Product portfolios; (3) include the reinvestment of all dividends and other earnings, estimated trading costs, commissions, or management fees; and, (4) may not reflect prices obtained in an actual funded Navellier Investment Product portfolio. For these and other reasons, the reported performances of model portfolios do not reflect the performance results of Navellier’s actually funded and traded Investment Products. In most cases, Navellier’s Investment Products have materially lower performance results than the performances of the model portfolios presented.
This report contains statements that are, or may be considered to be, forward-looking statements. All statements that are not historical facts, including statements about our beliefs or expectations, are “forward-looking statements” within the meaning of The U.S. Private Securities Litigation Reform Act of 1995. These statements may be identified by such forward-looking terminology as “expect,” “estimate,” “plan,” “intend,” “believe,” “anticipate,” “may,” “will,” “should,” “could,” “continue,” “project,” or similar statements or variations of such terms. Our forward-looking statements are based on a series of expectations, assumptions, and projections, are not guarantees of future results or performance, and involve substantial risks and uncertainty as described in Form ADV Part 2A of our filing with the Securities and Exchange Commission (SEC), which is available at www.adviserinfo.sec.gov or by requesting a copy by emailing info@navellier.com. All of our forward-looking statements are as of the date of this report only. We can give no assurance that such expectations or forward-looking statements will prove to be correct. Actual results may differ materially. You are urged to carefully consider all such factors.
FEDERAL TAX ADVICE DISCLAIMER: As required by U.S. Treasury Regulations, you are informed that, to the extent this presentation includes any federal tax advice, the presentation is not written by Navellier to be used, and cannot be used, for the purpose of avoiding federal tax penalties. Navellier does not advise on any income tax requirements or issues. Use of any information presented by Navellier is for general information only and does not represent tax advice either express or implied. You are encouraged to seek professional tax advice for income tax questions and assistance.
IMPORTANT NEWSLETTER DISCLOSURE:The hypothetical performance results for investment newsletters that are authored or edited by Louis Navellier, including Louis Navellier’s Growth Investor, Louis Navellier’s Breakthrough Stocks, Louis Navellier’s Accelerated Profits, and Louis Navellier’s Platinum Club, are not based on any actual securities trading, portfolio, or accounts, and the newsletters’ reported hypothetical performances should be considered mere “paper” or proforma hypothetical performance results and are not actual performance of real world trades. Navellier & Associates, Inc. does not have any relation to or affiliation with the owner of these newsletters. There are material differences between Navellier Investment Products’ portfolios and the InvestorPlace Media, LLC newsletter portfolios authored by Louis Navellier. The InvestorPlace Media, LLC newsletters contain hypothetical performance that do not include transaction costs, advisory fees, or other fees a client might incur if actual investments and trades were being made by an investor. As a result, newsletter performance should not be used to evaluate Navellier Investment services which are separate and different from the newsletters. The owner of the newsletters is InvestorPlace Media, LLC and any questions concerning the newsletters, including any newsletter advertising or hypothetical Newsletter performance claims, (which are calculated solely by Investor Place Media and not Navellier) should be referred to InvestorPlace Media, LLC at (800) 718-8289.
Please note that Navellier & Associates and the Navellier Private Client Group are managed completely independent of the newsletters owned and published by InvestorPlace Media, LLC and written and edited by Louis Navellier, and investment performance of the newsletters should in no way be considered indicative of potential future investment performance for any Navellier & Associates separately managed account portfolio. Potential investors should consult with their financial advisor before investing in any Navellier Investment Product.
Navellier claims compliance with Global Investment Performance Standards (GIPS). To receive a complete list and descriptions of Navellier’s composites and/or a presentation that adheres to the GIPS standards, please contact Navellier or click here. It should not be assumed that any securities recommendations made by Navellier & Associates, Inc. in the future will be profitable or equal the performance of securities made in this report.
FactSet Disclosure: Navellier does not independently calculate the statistical information included in the attached report. The calculation and the information are provided by FactSet, a company not related to Navellier. Although information contained in the report has been obtained from FactSet and is based on sources Navellier believes to be reliable, Navellier does not guarantee its accuracy, and it may be incomplete or condensed. The report and the related FactSet sourced information are provided on an “as is” basis. The user assumes the entire risk of any use made of this information. Investors should consider the report as only a single factor in making their investment decision. The report is for informational purposes only and is not intended as an offer or solicitation for the purchase or sale of a security. FactSet sourced information is the exclusive property of FactSet. Without prior written permission of FactSet, this information may not be reproduced, disseminated or used to create any financial products. All indices are unmanaged and performance of the indices include reinvestment of dividends and interest income, unless otherwise noted, are not illustrative of any particular investment and an investment cannot be made in any index. Past performance is no guarantee of future results.