by Jason Bodner
November 7, 2023
Storms come and sometimes bring hail. But storms can bring much better things – as on Jupiter or Saturn, where it likely rains diamonds. The latest media storm may also bring us some diamonds in the rough…
The recent news cycle has been predictably dreadful. With the ongoing Ukraine war, a new war in Israel against Hamas, inflation fears, the UAW auto strike, high yields, and recession fears, to name just a few stories, it makes me wonder: If aliens came down to visit, they might think we are chronically depressed and actually enjoy being negative. But this is the job of the media – since bad news sells like hotcakes.
I am here to tell you that there is reason to be cheerful, after all. I’ve been telling you that the stock market was supposed to rise in October, historically speaking, but clearly, most traders did not get the memo, as it was a dismal and spooky month, so now, there is some good news to get behind.
First, let me address some of the flurry of headlines and stiff headwinds holding back stocks. Then we will look at some of the data buried in the technicals and fundamentals of stocks that has me encouraged.
Last week brought some pretty big news. First, there were big worries over a normally little-heralded calendar item, previously reserved for finance nerds: a Treasury refunding announcement. But, relieving news broke Wednesday. The refinancing tab of $1.12 trillion came in below estimates of $1.14 trillion, a baby step in the right direction. This helped Treasury yields start to back-off their recent highs.
Further relieving those high yields was the FOMC meeting. It was a near certainty that the Fed would hold their target rate steady, which they did, at 5.25-5.50%. While this is still a multi-decade high, the announced second straight pause was a firm indication they are done. I anticipate rates falling in 2024 as early as the first quarter. The FOMC statement and Powell’s Q&A offered clues to back up this scenario.
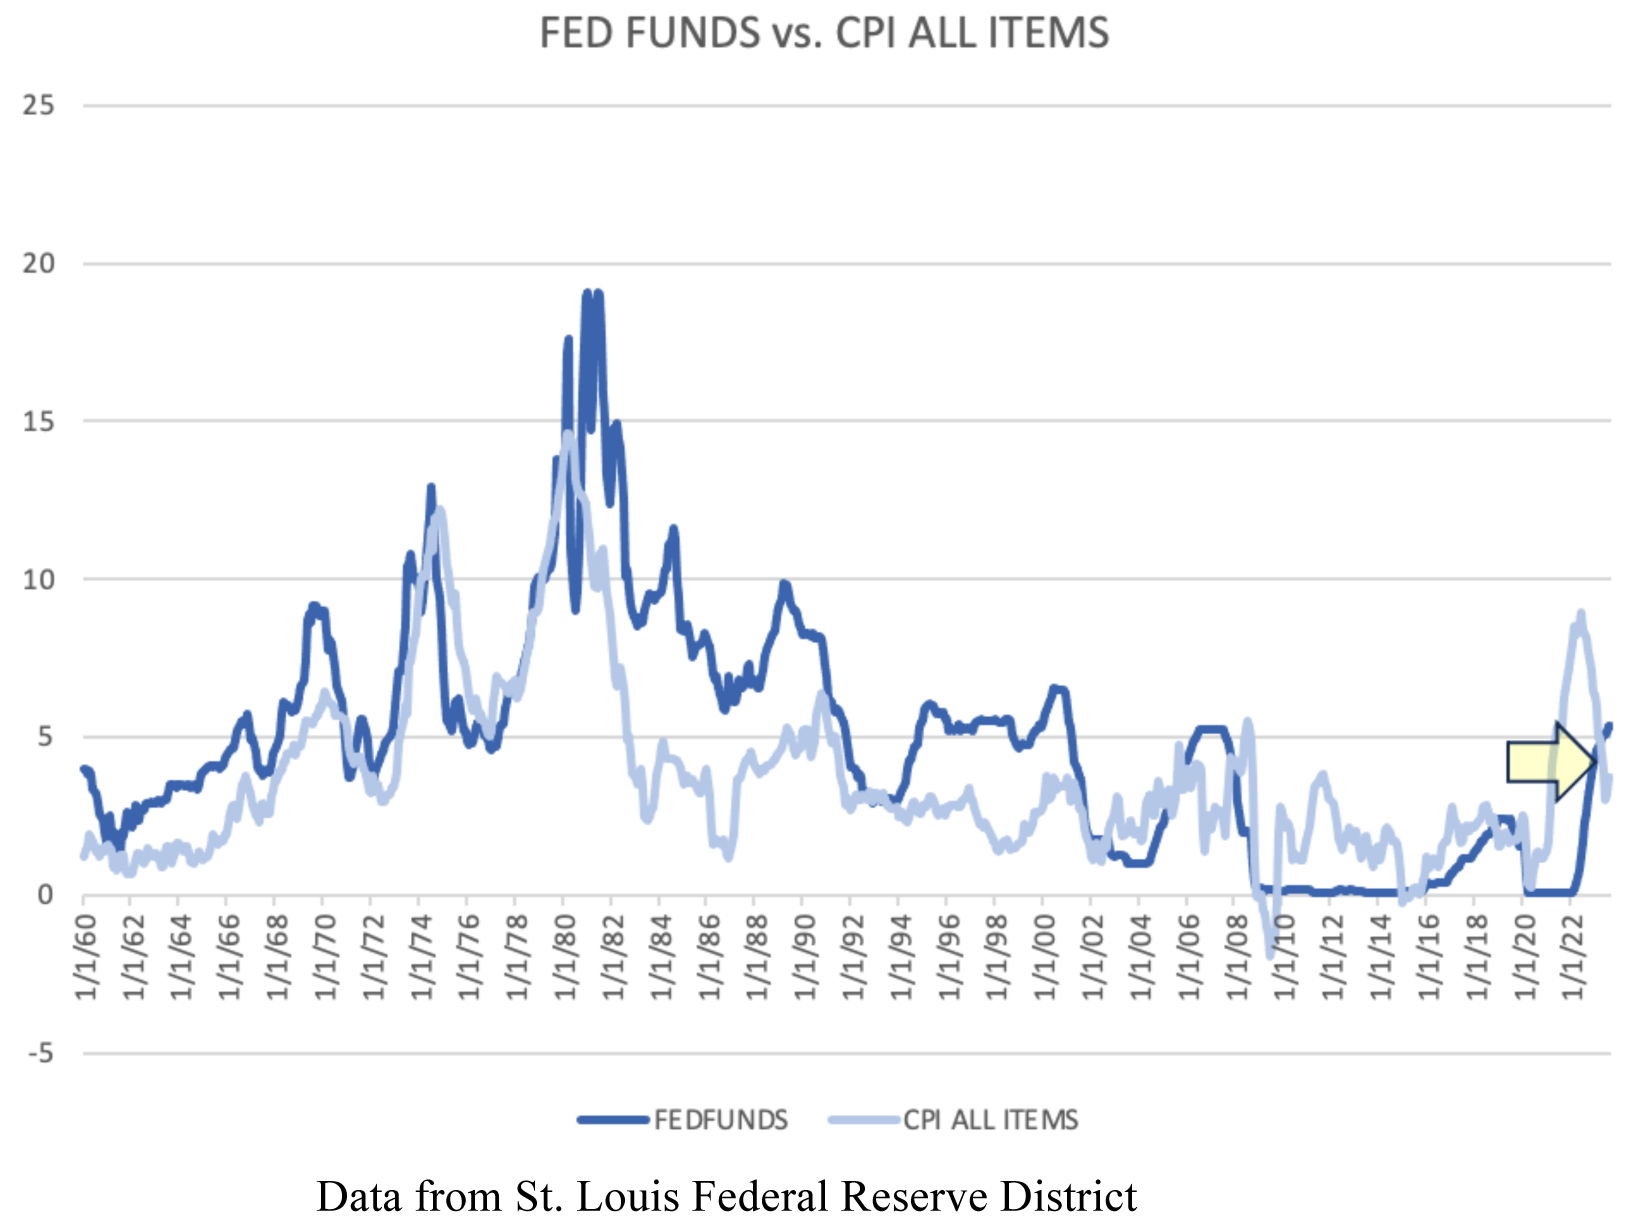
Sure, there was also plenty of tough talk reiterating a commitment to the long-term goal of inflation at 2%, but I’d like to repeat the historical fact that, since 1960, the CPI data shows 2% is a bit of an outlier, as the average CPI rate for the last 63 years is 3.77%, which sits slightly above our latest reading of 3.7%.
I’ll also remind you that the normal relationship with interest rates lower than inflation is heavily inverted right now, which historically does not last long:
Graphs are for illustrative and discussion purposes only. Please read important disclosures at the end of this commentary.
There was also plenty of dovish language in the latest FOMC statement, which is catnip to this paranoid market. Powell indicated that long-term rates were doing some of the Fed’s job – by tightening financial conditions, for instance. He also admitted that inflation is cooling. A key point in the Q&A, for me, was when Powell admitted that the FOMC committee removed recession from the model predictions and did not put it back in. That’s BIG, considering the entire investment world has been waiting for an inevitable recession (since 2020), that just hasn’t come. That’s a pretty clear indication that doom isn’t in the cards.
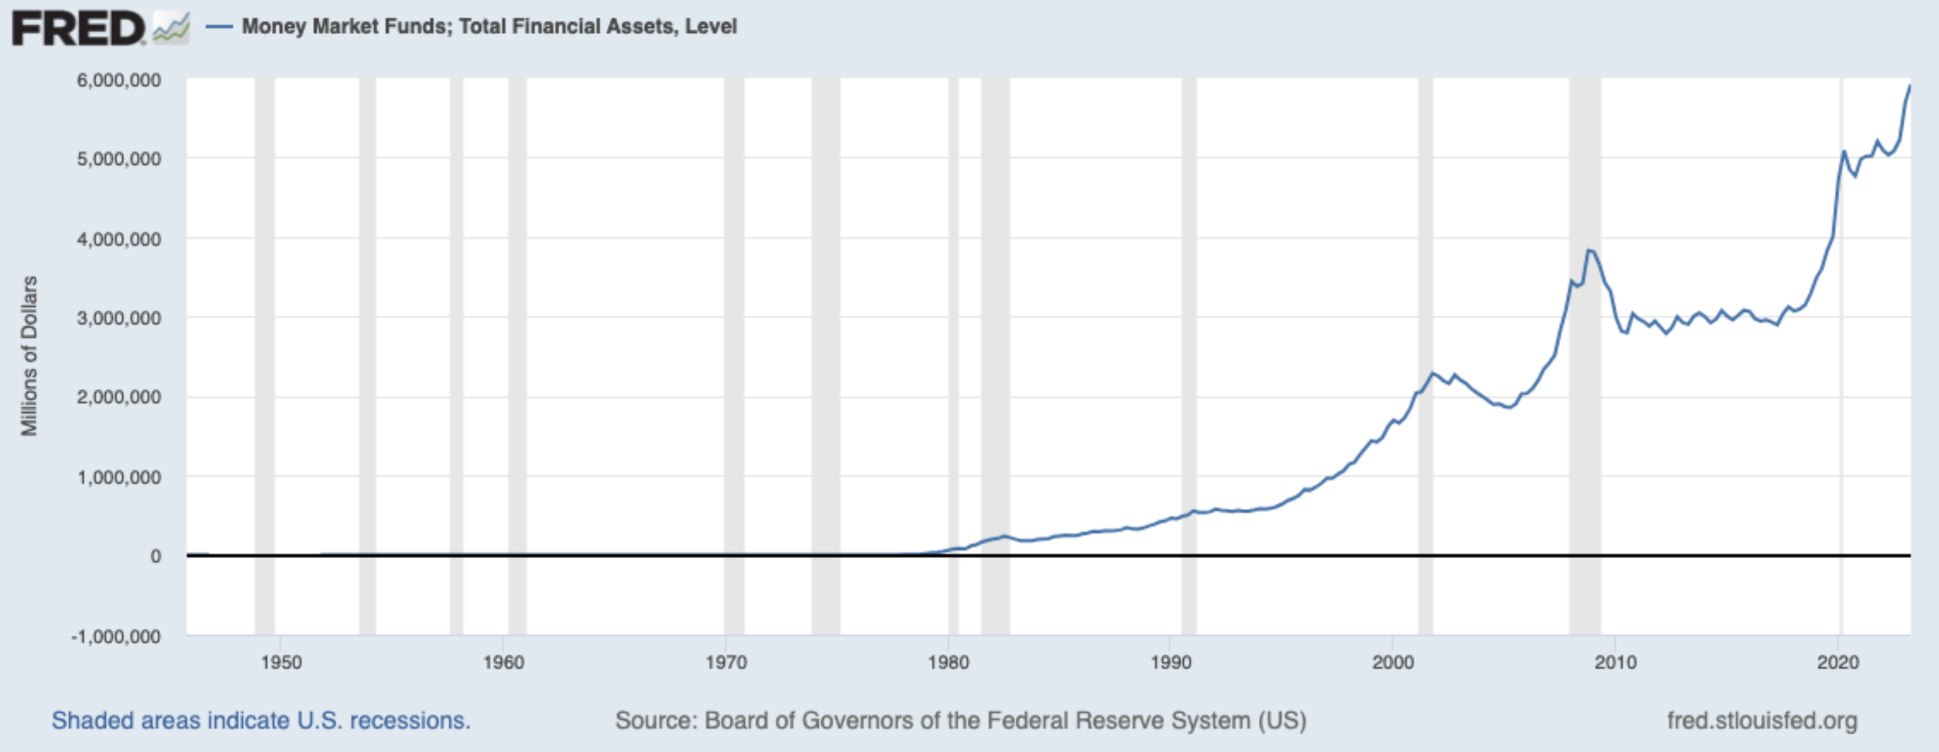
Wall Street naturally rejoiced with two big headwinds removed – rate increases and recession – so we saw significant buying late last week, which is almost certainly comprised, at least somewhat, of short-covering. This is good because a short-covering rally can then spark a real rally. Let me remind you: There is still nearly $6 trillion in cash out there, according to the St. Louis Fed – the highest on record:
Graphs are for illustrative and discussion purposes only. Please read important disclosures at the end of this commentary.
Naturally, that cash is earning respectable rates of income, for a change. But, if rates start to fall – which they certainly will, over time, you can expect a major flood of money crashing into stocks.
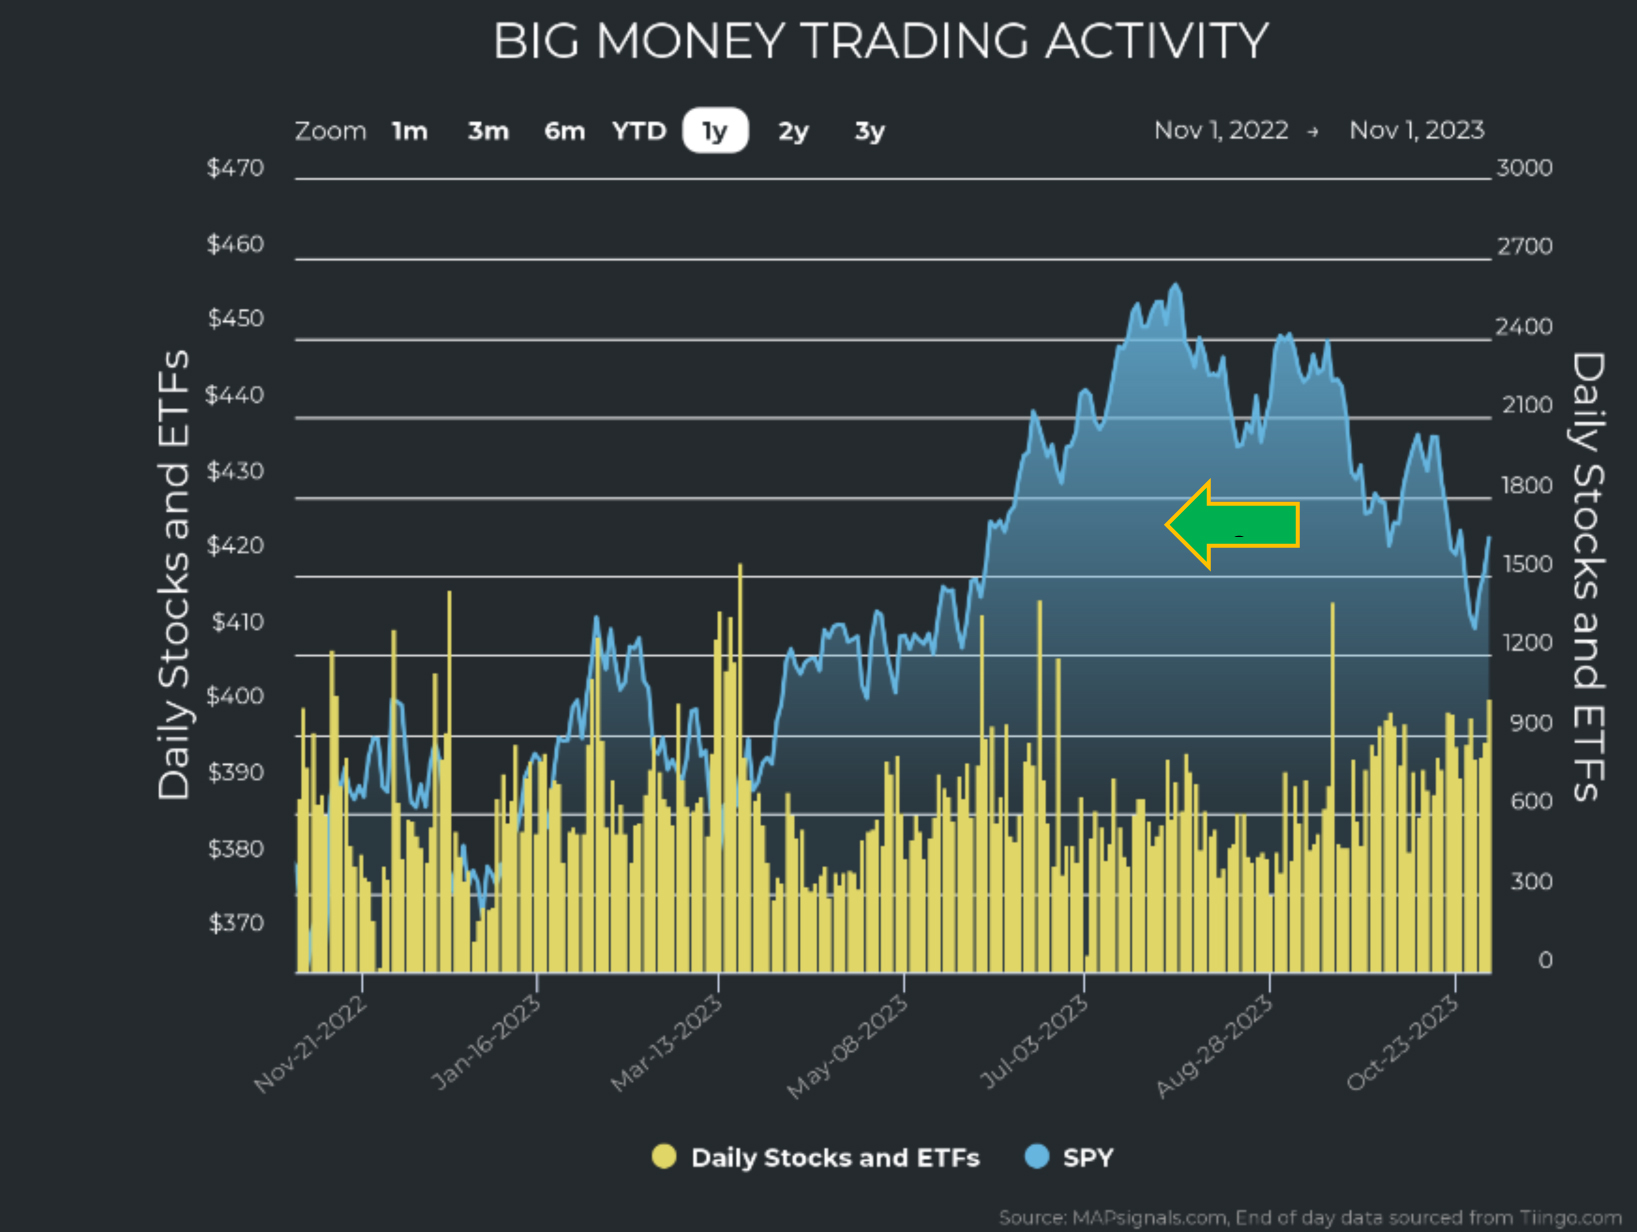
Back to how Wall Street reacted; we can see the latest money flows into stocks. The amber bars below show us unusual volumes surging as markets lifted higher the past two days:
Graphs are for illustrative and discussion purposes only. Please read important disclosures at the end of this commentary.
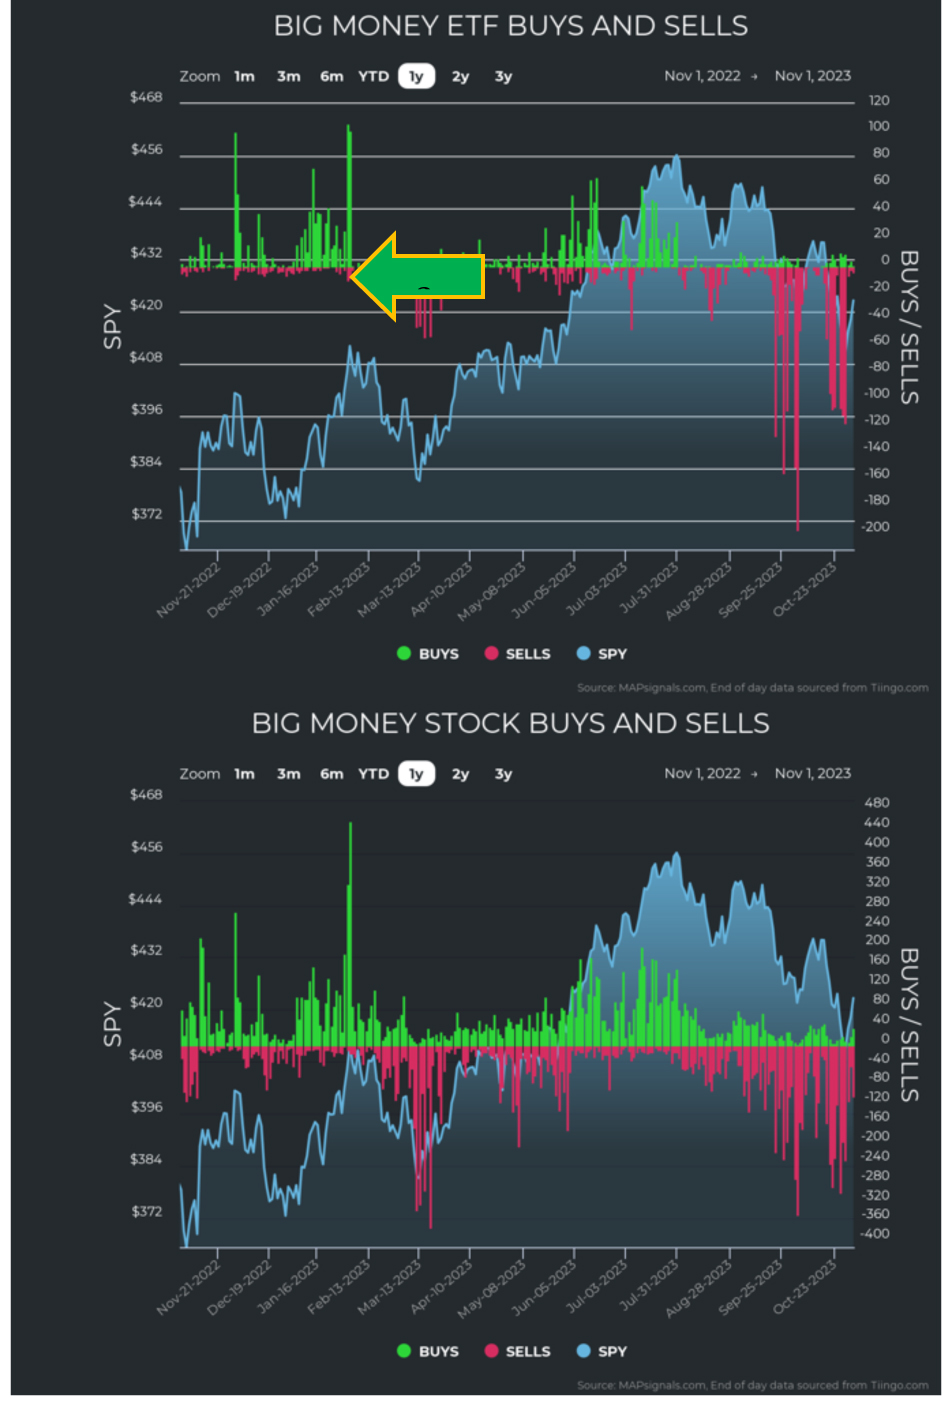
This is a strong indication of a bottom out and a reversal higher. We also see sellers slamming the brakes on stocks and ETFs:
Graphs are for illustrative and discussion purposes only. Please read important disclosures at the end of this commentary.
This has also lifted the BMI from its lows of 17.4 to above 20. This implies the BMI can rise from oversold very soon:
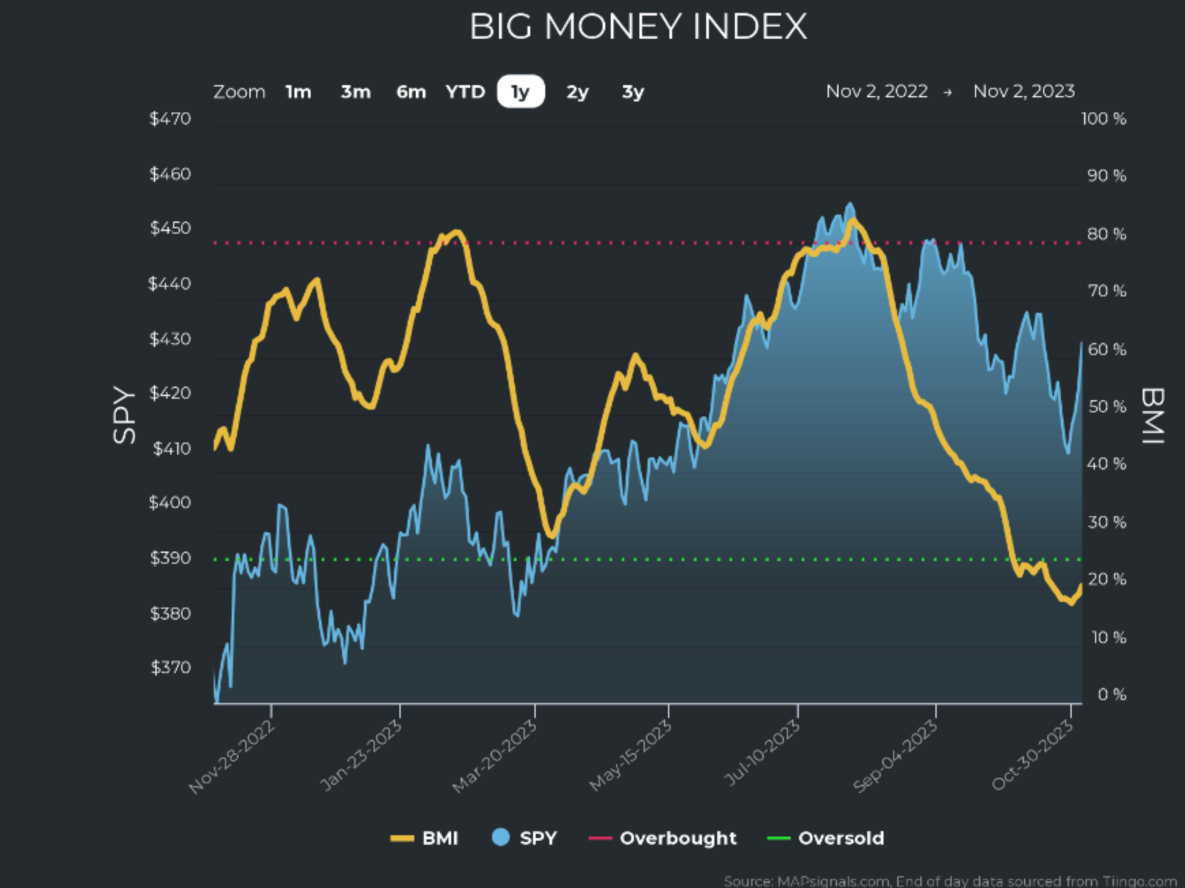
Graphs are for illustrative and discussion purposes only. Please read important disclosures at the end of this commentary.
Now, when we look at all eleven S&P 500 sectors, we see some encouraging signs as well. The previous violent, capitulation-like selling has suddenly vanished – for every sector.
Occasional pain-points still materialize, largely due to earnings disappointments, but for the most part we either see a relief from heavy selling, or even some small green shoots, indicating early buying:
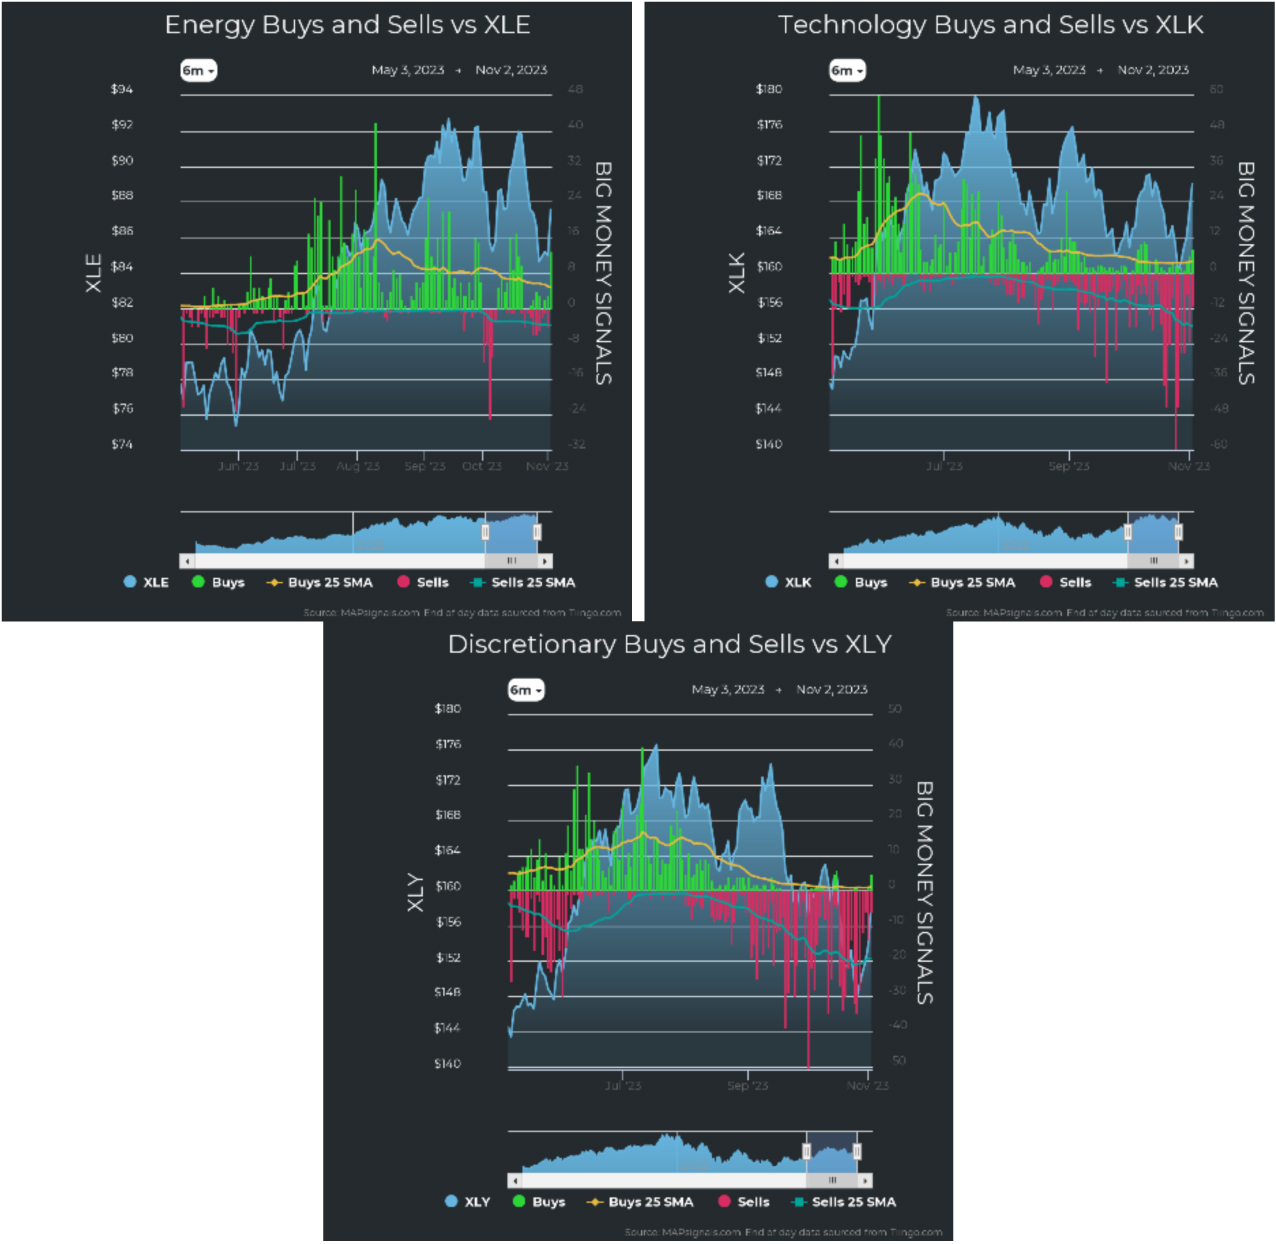
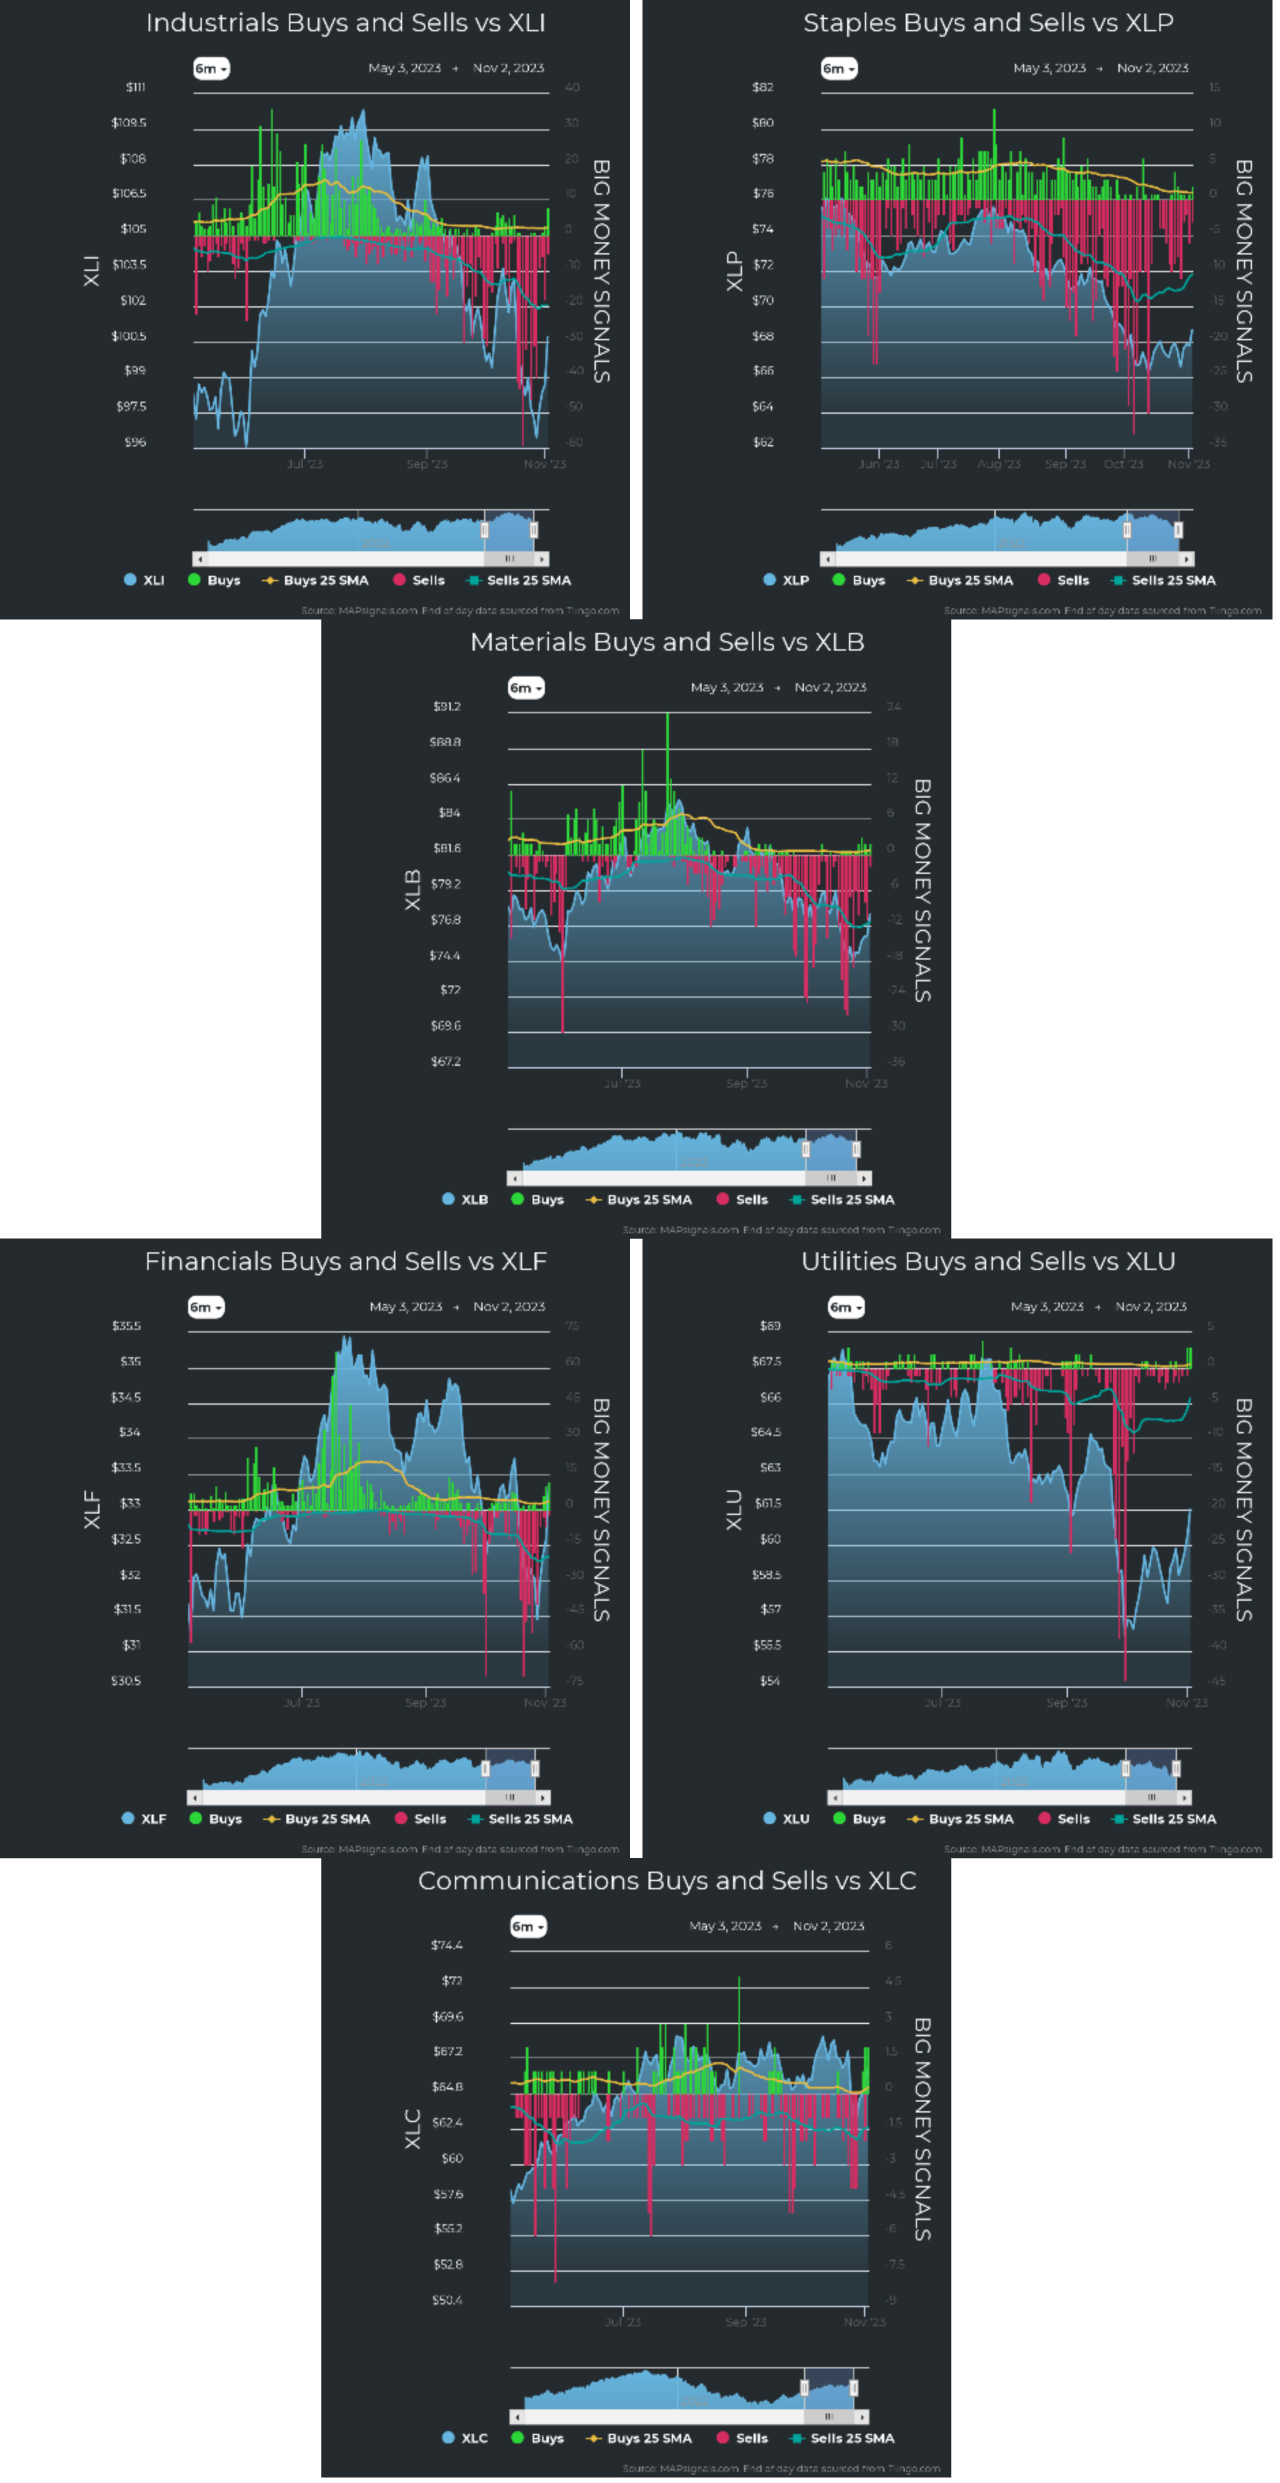
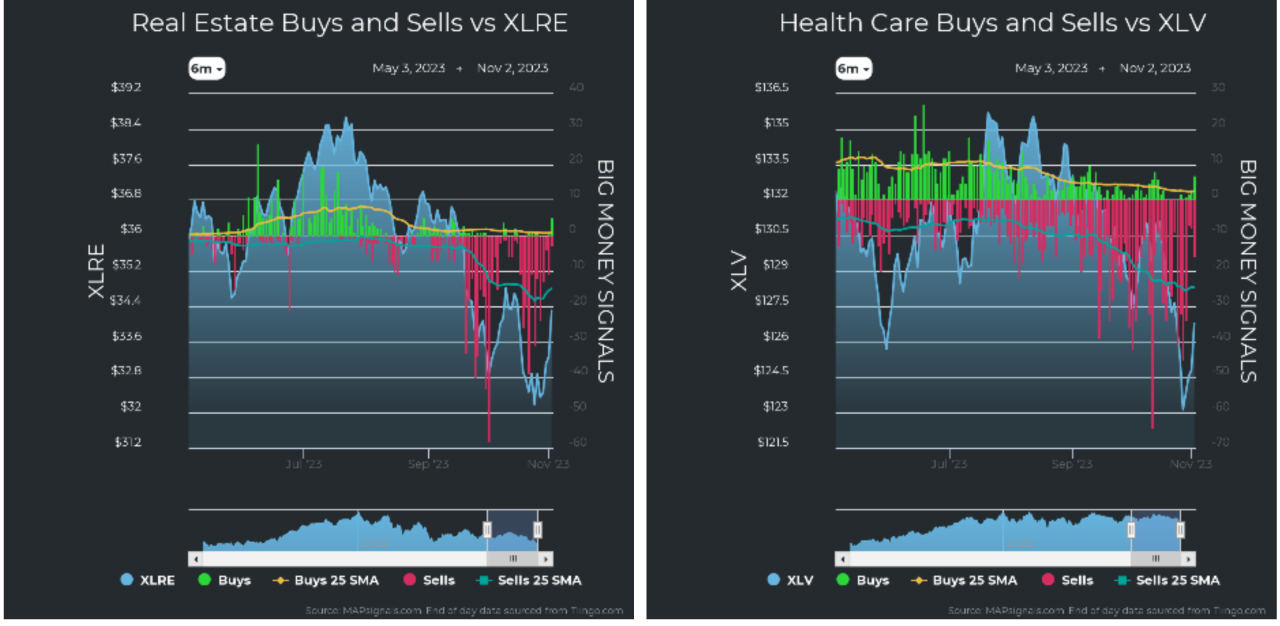
Graphs are for illustrative and discussion purposes only. Please read important disclosures at the end of this commentary.
While I’m on the subject of earnings, according to FactSet, with 81% of S&P 500 companies reporting results, 82% reported a positive EPS surprise and 62% reported a positive revenue surprise. For Q3 2023, the blended (year-over-year) earnings growth rate for the S&P 500 is 3.7%. If the quarter finishes that way, it will mark the first quarter of year-over-year earnings growth reported by the index since Q3 2022.
This means earnings are still working, despite the dour expectations. Sure, some stocks are seeing very outsized negative moves, mostly due to weak guidance or earnings misses, but this looks a lot like forced liquidations, as some levered funds may be on the ropes. There are a few things to keep in mind, though:
- The BMI is still oversold. And based on the levels recently seen, the forward returns since 2016 are stellar, with returns since 1990 being strong as well:
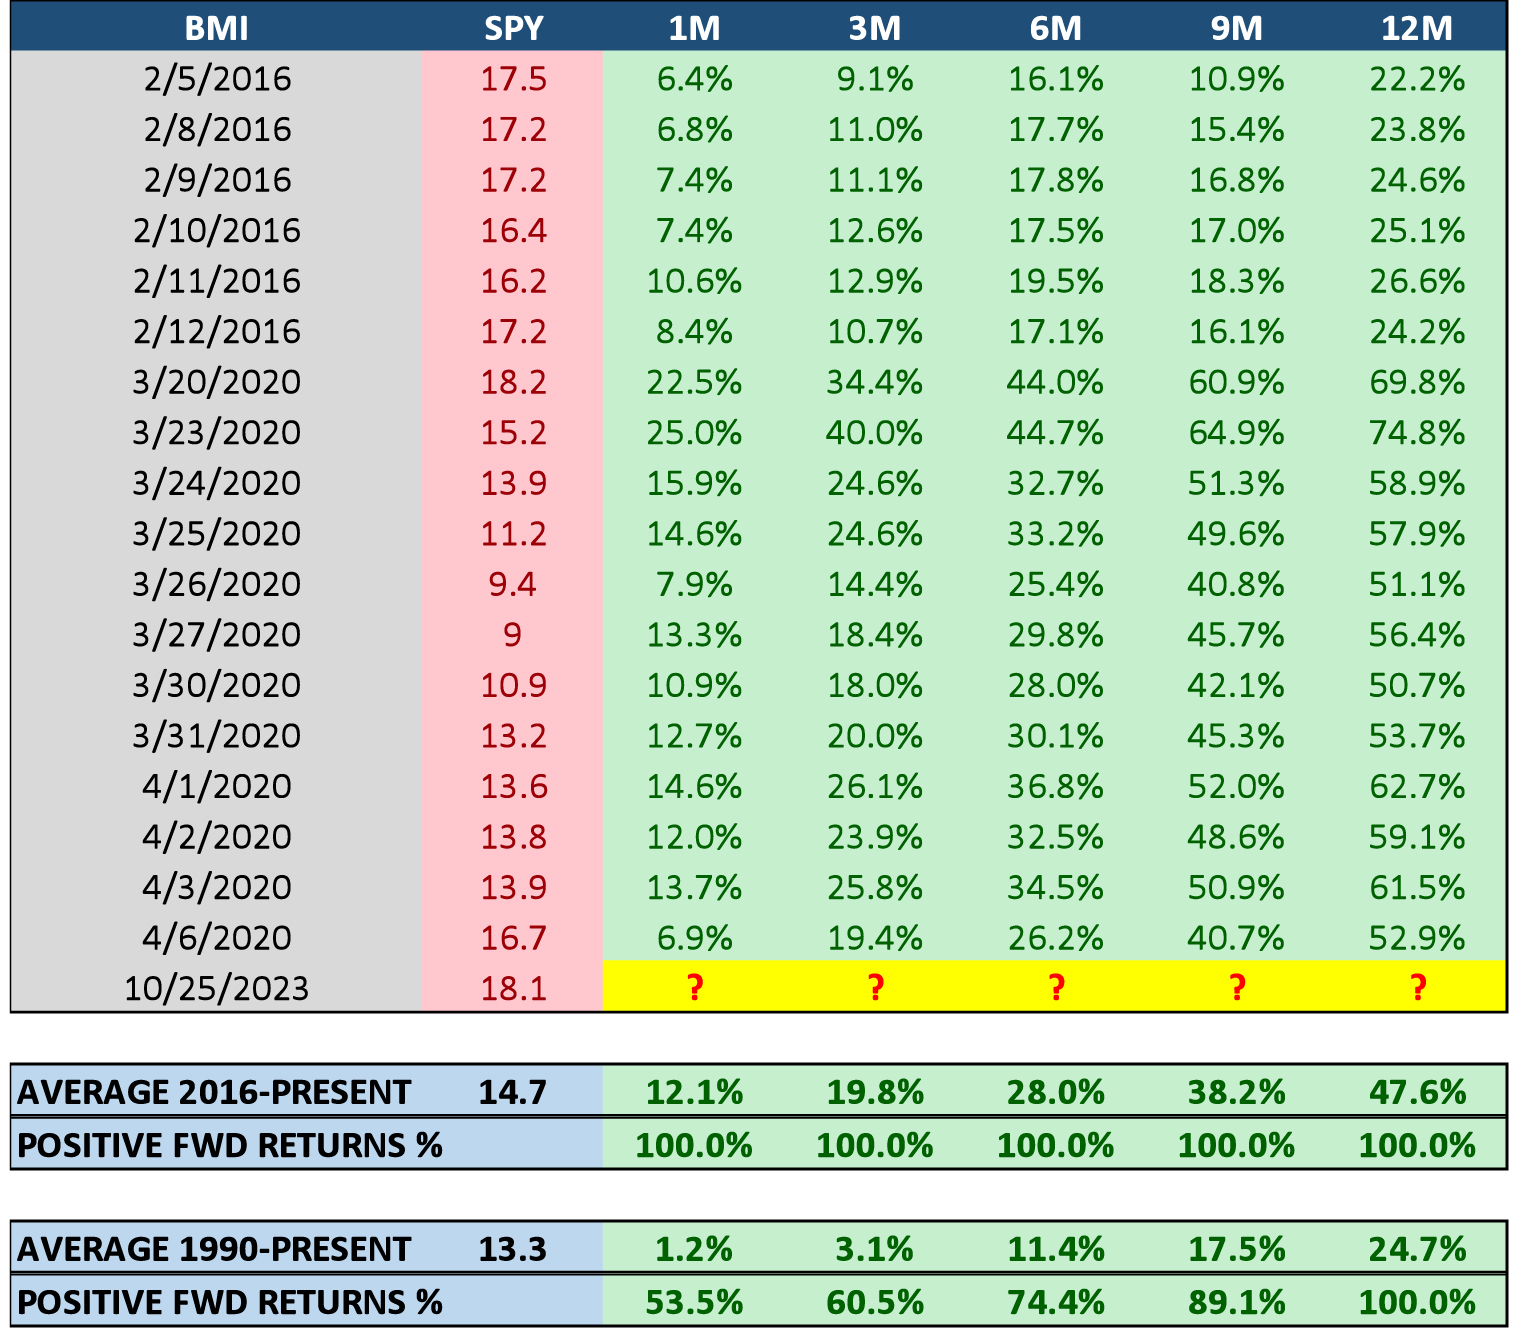
Graphs are for illustrative and discussion purposes only. Please read important disclosures at the end of this commentary.
- We are in the midst of a historically strong seasonal time of the year:
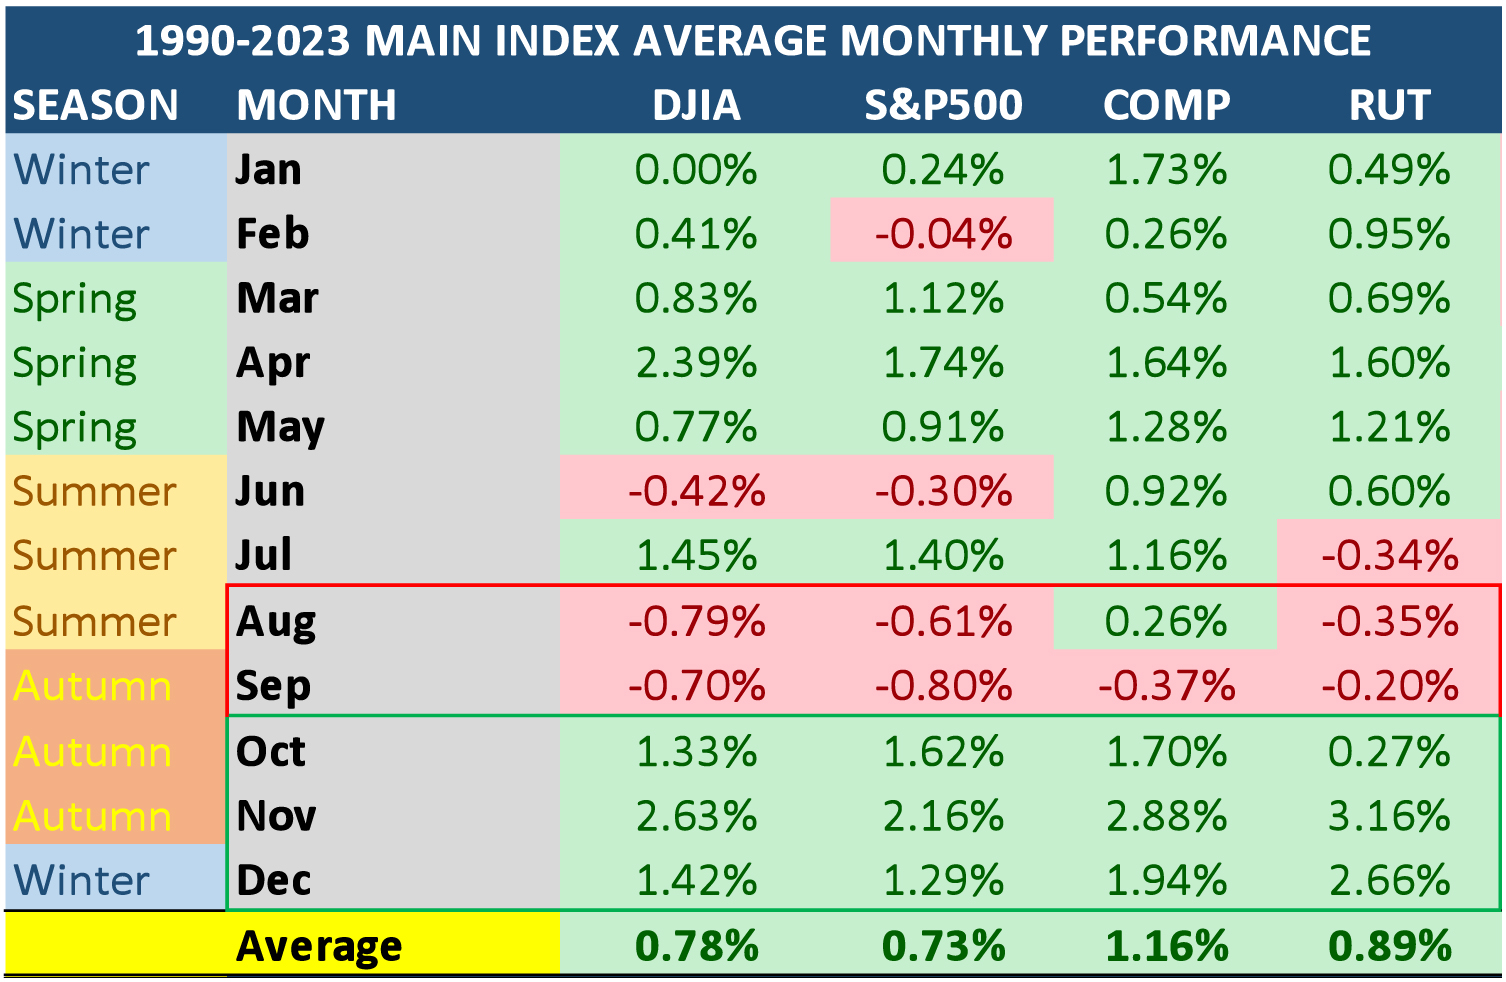
Graphs are for illustrative and discussion purposes only. Please read important disclosures at the end of this commentary.
- The Fed has paused rates, and rate cuts are likely on the horizon sooner, as Treasury yields are falling fast. Look at the 10-year Treasury falling from nearly 5% to just over 4.5% in just a few days:
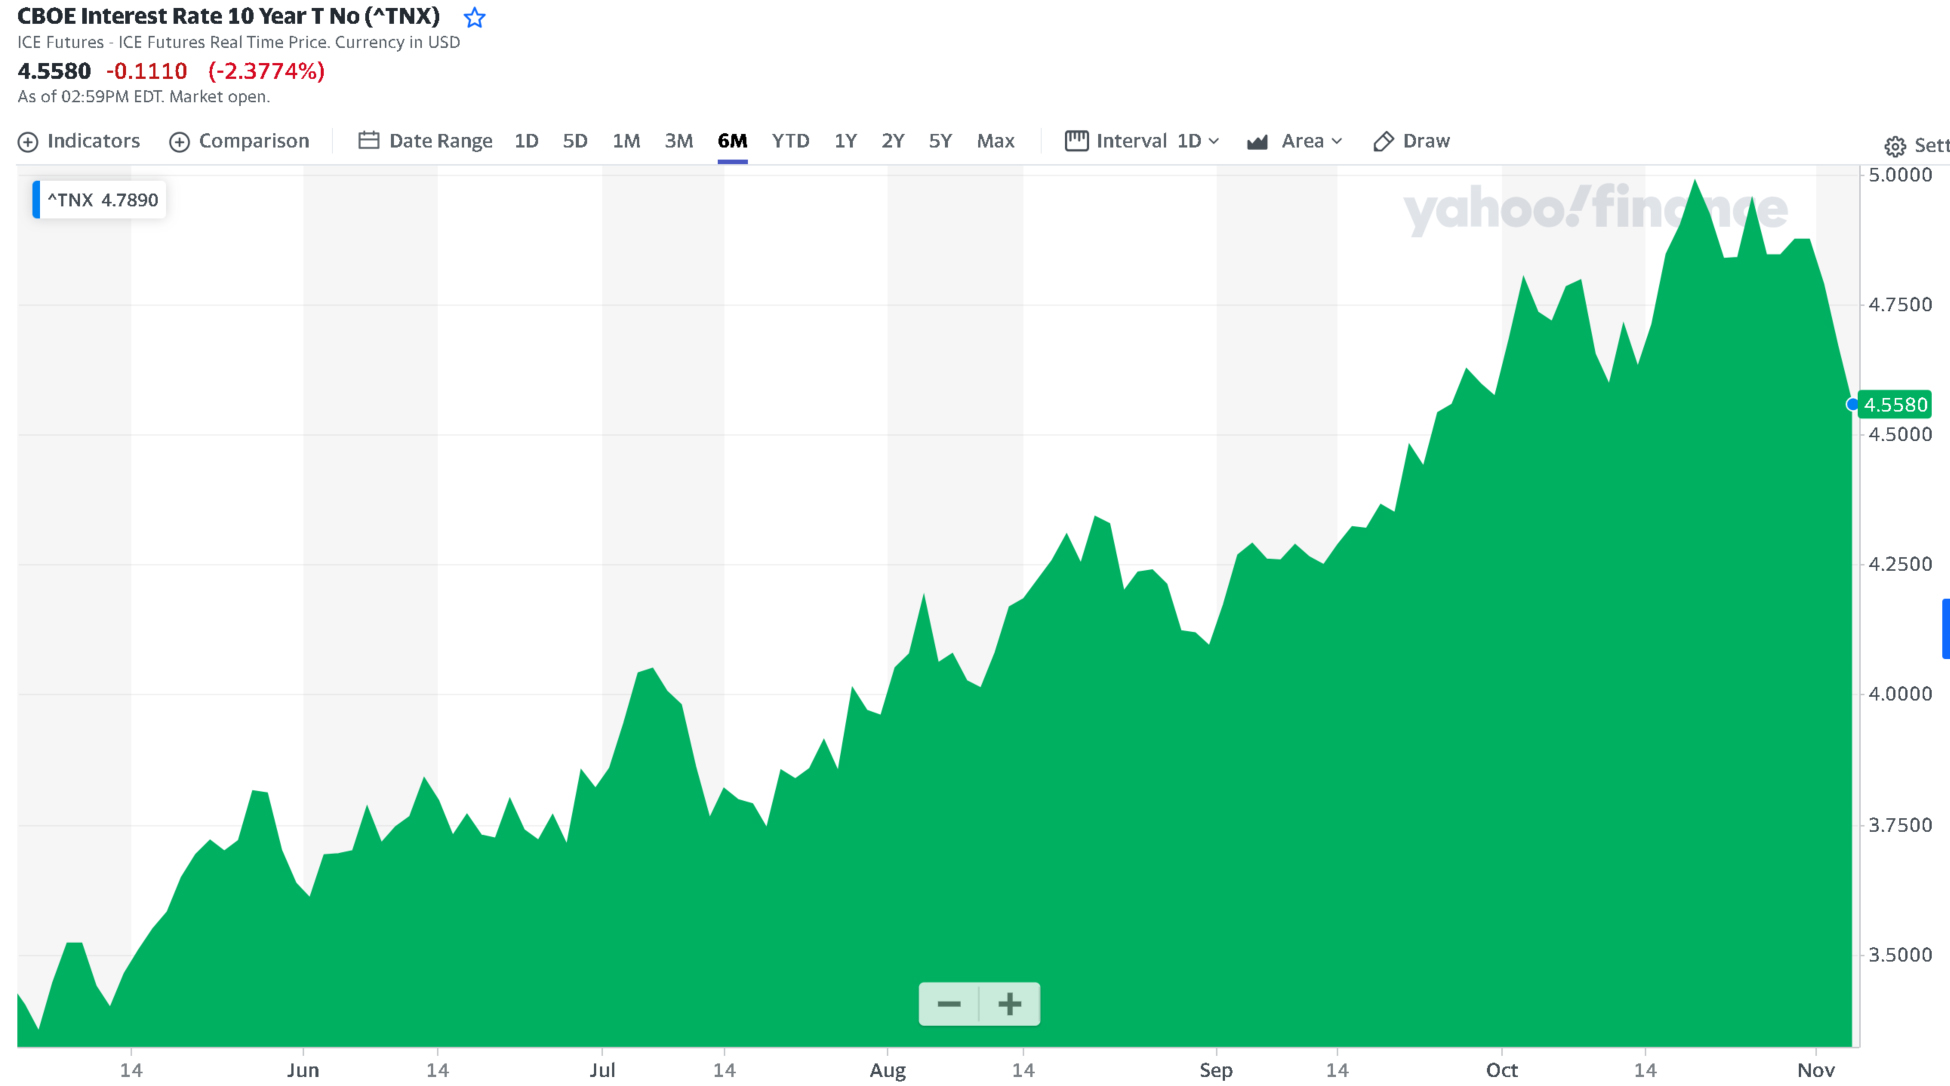
Graphs are for illustrative and discussion purposes only. Please read important disclosures at the end of this commentary.
Markets are already reverting higher, faster, in the last week, after we got the initial news we wanted from the Fed and Treasury refunding. Earnings are working. Markets were deeply oversold. And possible fund liquidations wrapping up for October would line up nicely for timing as November, so far, has been stellar for stocks. It’s when fear is high that the best deals reveal themselves – they just feel terribly frightening.
Remember the anonymous quote: “It’s always darkest before dawn.”
All content above represents the opinion of Jason Bodner of Navellier & Associates, Inc.
Also In This Issue
A Look Ahead by Louis Navellier
The Downbeat October Jobs Report Does Not Even Include the UAW Strikers
Income Mail by Bryan Perry
2-4 Year Investment Grade Corporate Bonds Look Very Timely
Growth Mail by Gary Alexander
New Orleans Does It in Style – Once Again!
Global Mail by Ivan Martchev
We’re Seeing a Massive Short Squeeze in Both Stocks and Bonds
Sector Spotlight by Jason Bodner
The Latest Media Storm Is Raining “Diamonds in the Rough”
View Full Archive
Read Past Issues Here

Jason Bodner
MARKETMAIL EDITOR FOR SECTOR SPOTLIGHT
Jason Bodner writes Sector Spotlight in the weekly Marketmail publication and has authored several white papers for the company. He is also Co-Founder of Macro Analytics for Professionals which produces proprietary equity accumulation/distribution research for its clients. Previously, Mr. Bodner served as Director of European Equity Derivatives for Cantor Fitzgerald Europe in London, then moved to the role of Head of Equity Derivatives North America for the same company in New York. He also served as S.V.P. Equity Derivatives for Jefferies, LLC. He received a B.S. in business administration in 1996, with honors, from Skidmore College as a member of the Periclean Honors Society. All content of “Sector Spotlight” represents the opinion of Jason Bodner
Important Disclosures:
Jason Bodner is a co-founder and co-owner of Mapsignals. Mr. Bodner is an independent contractor who is occasionally hired by Navellier & Associates to write an article and or provide opinions for possible use in articles that appear in Navellier & Associates weekly Market Mail. Mr. Bodner is not employed or affiliated with Louis Navellier, Navellier & Associates, Inc., or any other Navellier owned entity. The opinions and statements made here are those of Mr. Bodner and not necessarily those of any other persons or entities. This is not an endorsement, or solicitation or testimonial or investment advice regarding the BMI Index or any statements or recommendations or analysis in the article or the BMI Index or Mapsignals or its products or strategies.
Although information in these reports has been obtained from and is based upon sources that Navellier believes to be reliable, Navellier does not guarantee its accuracy and it may be incomplete or condensed. All opinions and estimates constitute Navellier’s judgment as of the date the report was created and are subject to change without notice. These reports are for informational purposes only and are not a solicitation for the purchase or sale of a security. Any decision to purchase securities mentioned in these reports must take into account existing public information on such securities or any registered prospectus.To the extent permitted by law, neither Navellier & Associates, Inc., nor any of its affiliates, agents, or service providers assumes any liability or responsibility nor owes any duty of care for any consequences of any person acting or refraining to act in reliance on the information contained in this communication or for any decision based on it.
Past performance is no indication of future results. Investment in securities involves significant risk and has the potential for partial or complete loss of funds invested. It should not be assumed that any securities recommendations made by Navellier. in the future will be profitable or equal the performance of securities made in this report. Dividend payments are not guaranteed. The amount of a dividend payment, if any, can vary over time and issuers may reduce dividends paid on securities in the event of a recession or adverse event affecting a specific industry or issuer.
None of the stock information, data, and company information presented herein constitutes a recommendation by Navellier or a solicitation to buy or sell any securities. Any specific securities identified and described do not represent all of the securities purchased, sold, or recommended for advisory clients. The holdings identified do not represent all of the securities purchased, sold, or recommended for advisory clients and the reader should not assume that investments in the securities identified and discussed were or will be profitable.
Information presented is general information that does not take into account your individual circumstances, financial situation, or needs, nor does it present a personalized recommendation to you. Individual stocks presented may not be suitable for every investor. Investment in securities involves significant risk and has the potential for partial or complete loss of funds invested. Investment in fixed income securities has the potential for the investment return and principal value of an investment to fluctuate so that an investor’s holdings, when redeemed, may be worth less than their original cost.
One cannot invest directly in an index. Index is unmanaged and index performance does not reflect deduction of fees, expenses, or taxes. Presentation of Index data does not reflect a belief by Navellier that any stock index constitutes an investment alternative to any Navellier equity strategy or is necessarily comparable to such strategies. Among the most important differences between the Indices and Navellier strategies are that the Navellier equity strategies may (1) incur material management fees, (2) concentrate its investments in relatively few stocks, industries, or sectors, (3) have significantly greater trading activity and related costs, and (4) be significantly more or less volatile than the Indices.
ETF Risk: We may invest in exchange traded funds (“ETFs”) and some of our investment strategies are generally fully invested in ETFs. Like traditional mutual funds, ETFs charge asset-based fees, but they generally do not charge initial sales charges or redemption fees and investors typically pay only customary brokerage fees to buy and sell ETF shares. The fees and costs charged by ETFs held in client accounts will not be deducted from the compensation the client pays Navellier. ETF prices can fluctuate up or down, and a client account could lose money investing in an ETF if the prices of the securities owned by the ETF go down. ETFs are subject to additional risks:
- ETF shares may trade above or below their net asset value;
- An active trading market for an ETF’s shares may not develop or be maintained;
- The value of an ETF may be more volatile than the underlying portfolio of securities the ETF is designed to track;
- The cost of owning shares of the ETF may exceed those a client would incur by directly investing in the underlying securities; and
- Trading of an ETF’s shares may be halted if the listing exchange’s officials deem it appropriate, the shares are delisted from the exchange, or the activation of market-wide “circuit breakers” (which are tied to large decreases in stock prices) halts stock trading generally.
Grader Disclosures: Investment in equity strategies involves substantial risk and has the potential for partial or complete loss of funds invested. The sample portfolio and any accompanying charts are for informational purposes only and are not to be construed as a solicitation to buy or sell any financial instrument and should not be relied upon as the sole factor in an investment making decision. As a matter of normal and important disclosures to you, as a potential investor, please consider the following: The performance presented is not based on any actual securities trading, portfolio, or accounts, and the reported performance of the A, B, C, D, and F portfolios (collectively the “model portfolios”) should be considered mere “paper” or pro forma performance results based on Navellier’s research.
Investors evaluating any of Navellier & Associates, Inc.’s, (or its affiliates’) Investment Products must not use any information presented here, including the performance figures of the model portfolios, in their evaluation of any Navellier Investment Products. Navellier Investment Products include the firm’s mutual funds and managed accounts. The model portfolios, charts, and other information presented do not represent actual funded trades and are not actual funded portfolios. There are material differences between Navellier Investment Products’ portfolios and the model portfolios, research, and performance figures presented here. The model portfolios and the research results (1) may contain stocks or ETFs that are illiquid and difficult to trade; (2) may contain stock or ETF holdings materially different from actual funded Navellier Investment Product portfolios; (3) include the reinvestment of all dividends and other earnings, estimated trading costs, commissions, or management fees; and, (4) may not reflect prices obtained in an actual funded Navellier Investment Product portfolio. For these and other reasons, the reported performances of model portfolios do not reflect the performance results of Navellier’s actually funded and traded Investment Products. In most cases, Navellier’s Investment Products have materially lower performance results than the performances of the model portfolios presented.
This report contains statements that are, or may be considered to be, forward-looking statements. All statements that are not historical facts, including statements about our beliefs or expectations, are “forward-looking statements” within the meaning of The U.S. Private Securities Litigation Reform Act of 1995. These statements may be identified by such forward-looking terminology as “expect,” “estimate,” “plan,” “intend,” “believe,” “anticipate,” “may,” “will,” “should,” “could,” “continue,” “project,” or similar statements or variations of such terms. Our forward-looking statements are based on a series of expectations, assumptions, and projections, are not guarantees of future results or performance, and involve substantial risks and uncertainty as described in Form ADV Part 2A of our filing with the Securities and Exchange Commission (SEC), which is available at www.adviserinfo.sec.gov or by requesting a copy by emailing info@navellier.com. All of our forward-looking statements are as of the date of this report only. We can give no assurance that such expectations or forward-looking statements will prove to be correct. Actual results may differ materially. You are urged to carefully consider all such factors.
FEDERAL TAX ADVICE DISCLAIMER: As required by U.S. Treasury Regulations, you are informed that, to the extent this presentation includes any federal tax advice, the presentation is not written by Navellier to be used, and cannot be used, for the purpose of avoiding federal tax penalties. Navellier does not advise on any income tax requirements or issues. Use of any information presented by Navellier is for general information only and does not represent tax advice either express or implied. You are encouraged to seek professional tax advice for income tax questions and assistance.
IMPORTANT NEWSLETTER DISCLOSURE:The hypothetical performance results for investment newsletters that are authored or edited by Louis Navellier, including Louis Navellier’s Growth Investor, Louis Navellier’s Breakthrough Stocks, Louis Navellier’s Accelerated Profits, and Louis Navellier’s Platinum Club, are not based on any actual securities trading, portfolio, or accounts, and the newsletters’ reported hypothetical performances should be considered mere “paper” or proforma hypothetical performance results and are not actual performance of real world trades. Navellier & Associates, Inc. does not have any relation to or affiliation with the owner of these newsletters. There are material differences between Navellier Investment Products’ portfolios and the InvestorPlace Media, LLC newsletter portfolios authored by Louis Navellier. The InvestorPlace Media, LLC newsletters contain hypothetical performance that do not include transaction costs, advisory fees, or other fees a client might incur if actual investments and trades were being made by an investor. As a result, newsletter performance should not be used to evaluate Navellier Investment services which are separate and different from the newsletters. The owner of the newsletters is InvestorPlace Media, LLC and any questions concerning the newsletters, including any newsletter advertising or hypothetical Newsletter performance claims, (which are calculated solely by Investor Place Media and not Navellier) should be referred to InvestorPlace Media, LLC at (800) 718-8289.
Please note that Navellier & Associates and the Navellier Private Client Group are managed completely independent of the newsletters owned and published by InvestorPlace Media, LLC and written and edited by Louis Navellier, and investment performance of the newsletters should in no way be considered indicative of potential future investment performance for any Navellier & Associates separately managed account portfolio. Potential investors should consult with their financial advisor before investing in any Navellier Investment Product.
Navellier claims compliance with Global Investment Performance Standards (GIPS). To receive a complete list and descriptions of Navellier’s composites and/or a presentation that adheres to the GIPS standards, please contact Navellier or click here. It should not be assumed that any securities recommendations made by Navellier & Associates, Inc. in the future will be profitable or equal the performance of securities made in this report.
FactSet Disclosure: Navellier does not independently calculate the statistical information included in the attached report. The calculation and the information are provided by FactSet, a company not related to Navellier. Although information contained in the report has been obtained from FactSet and is based on sources Navellier believes to be reliable, Navellier does not guarantee its accuracy, and it may be incomplete or condensed. The report and the related FactSet sourced information are provided on an “as is” basis. The user assumes the entire risk of any use made of this information. Investors should consider the report as only a single factor in making their investment decision. The report is for informational purposes only and is not intended as an offer or solicitation for the purchase or sale of a security. FactSet sourced information is the exclusive property of FactSet. Without prior written permission of FactSet, this information may not be reproduced, disseminated or used to create any financial products. All indices are unmanaged and performance of the indices include reinvestment of dividends and interest income, unless otherwise noted, are not illustrative of any particular investment and an investment cannot be made in any index. Past performance is no guarantee of future results.