
by Ivan Martchev
November 10, 2026
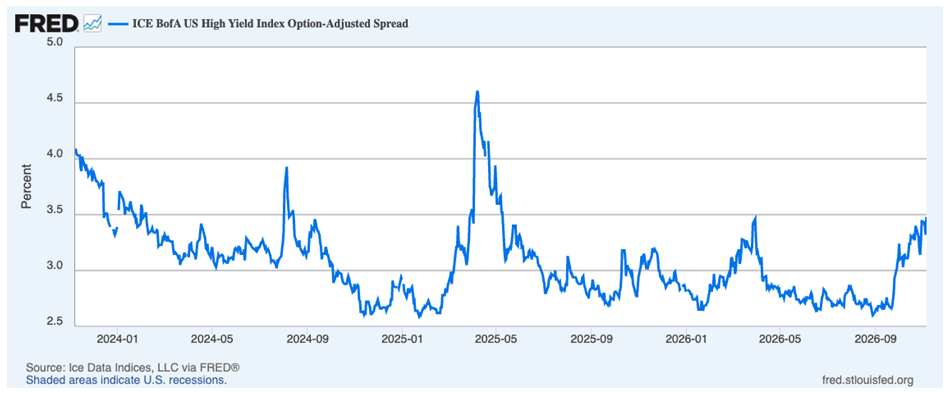
The historic Democratic sweep of the House and Senate is reverberating through the stock and bond markets. In the stock market, the pain was felt primarily in the technology sector, more specifically the PHLX Semiconductor Index, while in the bond market it is concentrated in junk bonds, which have often been used for AI data-center financing.
Graphs are for illustrative and discussion purposes only. Please read important disclosures at the end of this commentary.
To be fair, earnings estimates for most semiconductor companies have not reacted negatively (yet), and junk bonds in the aggregate do not show any major distress, but individual issues, like neocloud bonds, are heavily distressed, with the yields far away from where their credit ratings suggest they should be.
The junk bond index in the aggregate shows a spread level of 3.48% (348-basis points) to Treasurys, which is below the level of the “tariff tantrum” last year and is “inside 400”, a level considered normal.
I believe last Thursday’s sell-off was an overreaction, as investors are pricing in a sharp slowdown – or an almost hard stop – to data center activity in 2027. Because they don’t know the exact level of impact, they sell first and ask questions later. Still, it is likely that many data-centers already approved for 2027 are likely to be built, which makes the wholesale liquidation of the PHLX Semiconductor Index problematic.
We have had our fair share of sharp sell-offs in the last 10-years and unless the cause is something that dramatically affects the economy – like the Fed monetary tightening in 2022 – these sell-offs tend to reverse pretty quickly. One can say that one of the best buying opportunities is a sharp sell-off in a good economy, where earnings estimates do not fall, or better yet go up, when share prices go down.
So, the question is: To which of those sell-offs in the past decade is the present situation most similar?
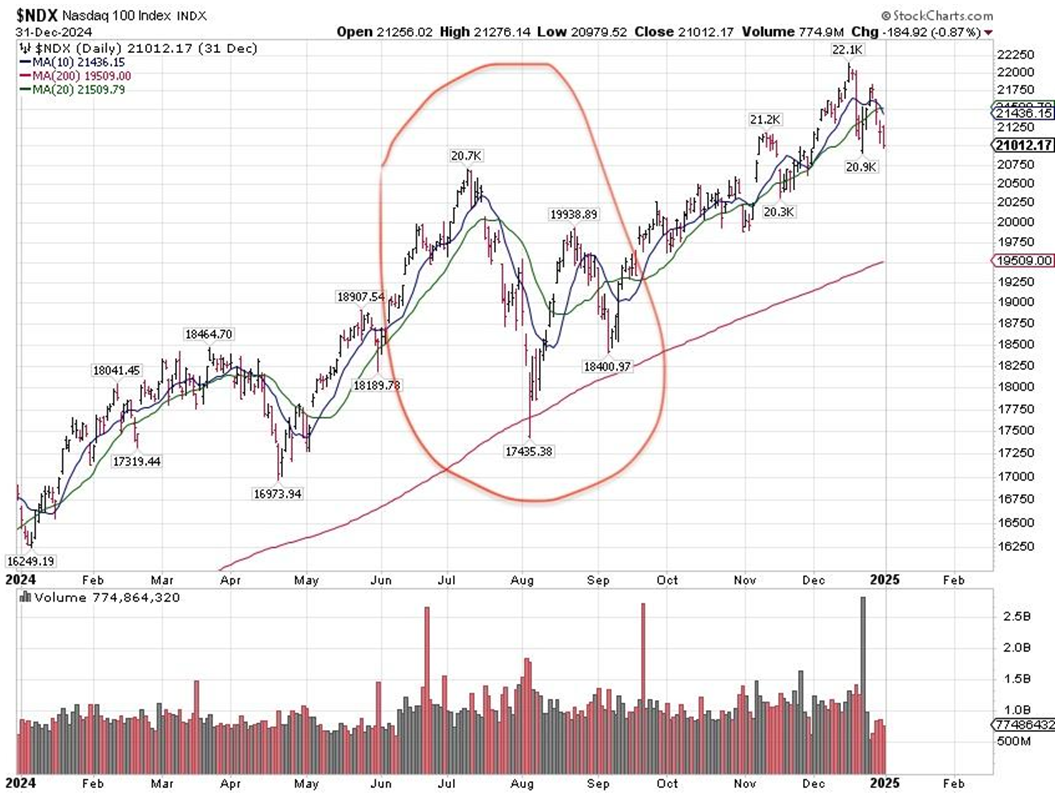
No sell-off is exactly like any other, as the drivers are different, but in this case the situation in the NASDAQ 100 reminds me most of July-August 2024, when we saw an all-time high in early July. Then, the market became disorderly, gapping lower (indicating pent-up selling pressure), resulting in disorderly liquidation in early August, due to unwinding leveraged trades, many of driven by borrowed yen (see chart below).
Graphs are for illustrative and discussion purposes only. Please read important disclosures at the end of this commentary.
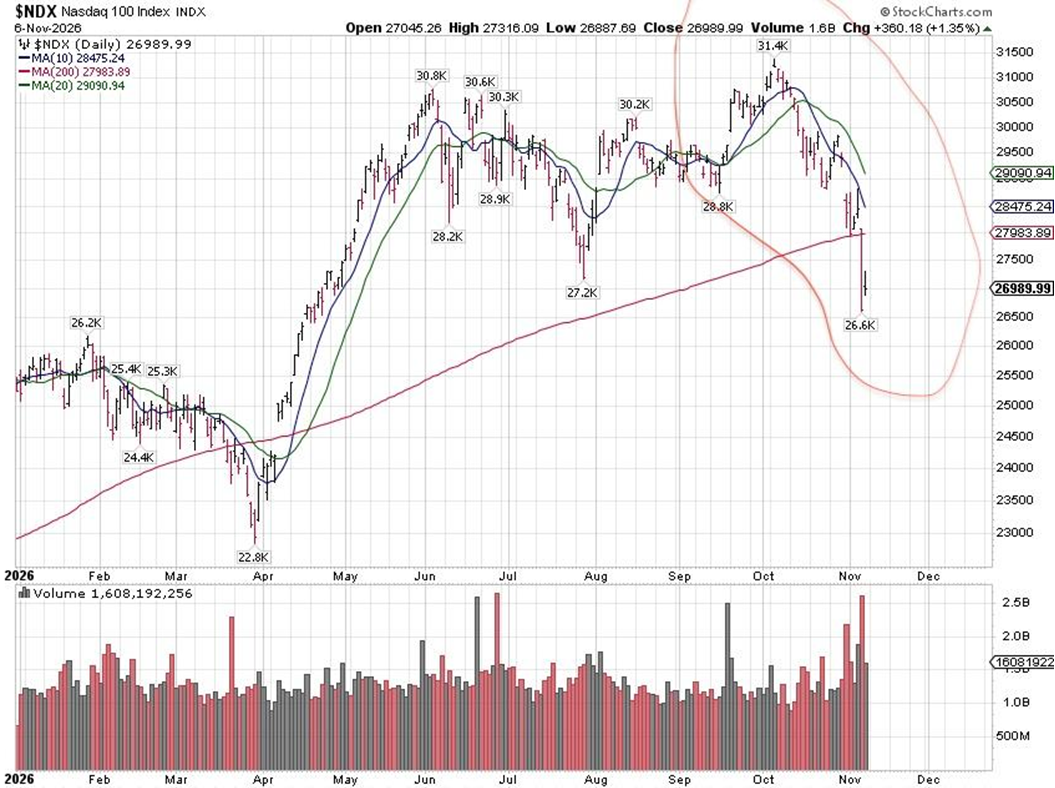
We have a similar situation now, with the NASDAQ 100 making a fresh all-time high in October, gapping down several times to culminate in disorderly selling last Thursday (see chart below).
Graphs are for illustrative and discussion purposes only. Please read important disclosures at the end of this commentary.
According to Portfolio Labs, famed hedge fund Situational Awareness performed poorly in this sell-off, falling 18.77% last week, mostly due to its worst single trading day of the year, on November 5 (-17%). This latest decline is second only to the 32.3% decline in July. In late July, they had to liquidate a big part of their portfolio, shrinking Assets Under Management (AUM) from $45 billion to about $10 billion. This forced liquidation came in around the time of the stock market bottom. Then, in September, Situational Awareness was back in the stock market with call options, presumably on its favorite AI trades.
As I have mentioned before, I can see this getting worse if the Trump administration decides to restart the Iran war and cause big damage to Gulf oil and LNG infrastructure, which I called the worst-case scenario. But if diplomacy wins and the Iran war does not restart, I can see last Thursday as a stock market bottom.
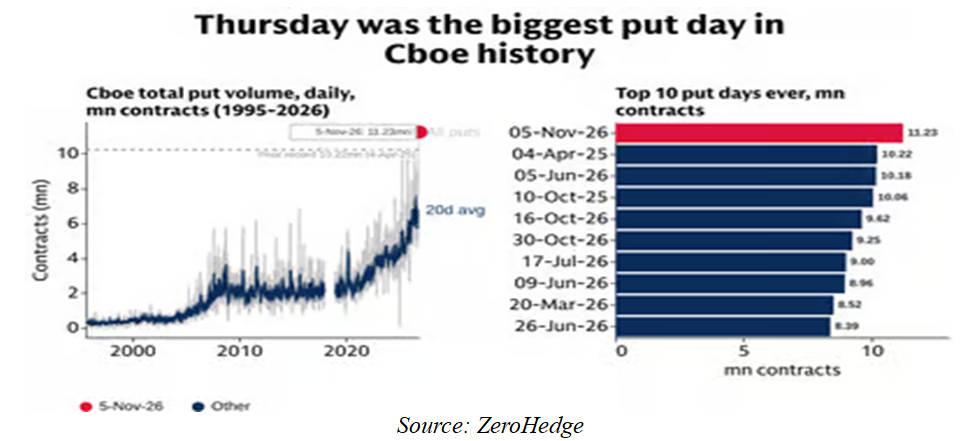
In August 2024, the original climactic low was never violated. Both the 2024 decline and the present sell-off are about 15% in magnitude for the NASDAQ 100 Index and are similar in duration. We do not have to have a breach of last Thursday’s low, as Thursday was the biggest put buying day in CBOE history, which in and of itself is a sign of a bottom. The previous buying record in puts was at the start of the tariff panic on April 4, 2025, one trading day before the ultimate low for 2025 and the start of a historic rally.
Graphs are for illustrative and discussion purposes only. Please read important disclosures at the end of this commentary.
The 2025 tariff situation and present situation are different as people questioned the sanity of President Trump when those tariffs made global trade cost-prohibitive. It turned out he was aggressively negotiating on live TV in order to get better trade deals, putting aside investor fears of a recession after the sell-off.
Right now, investors may question the sanity of Democratic governors and lawmakers and look to estimate the probability of a hard stop in data-center building, which in 2027 for already permitted construction is unlikely. The most likely scenario is some slowdown and more concessions on behalf of data center owners, like making sure electricity generation is addressed first before data-centers are built.
Graphs are for illustrative and discussion purposes only. Please read important disclosures at the end of this commentary.
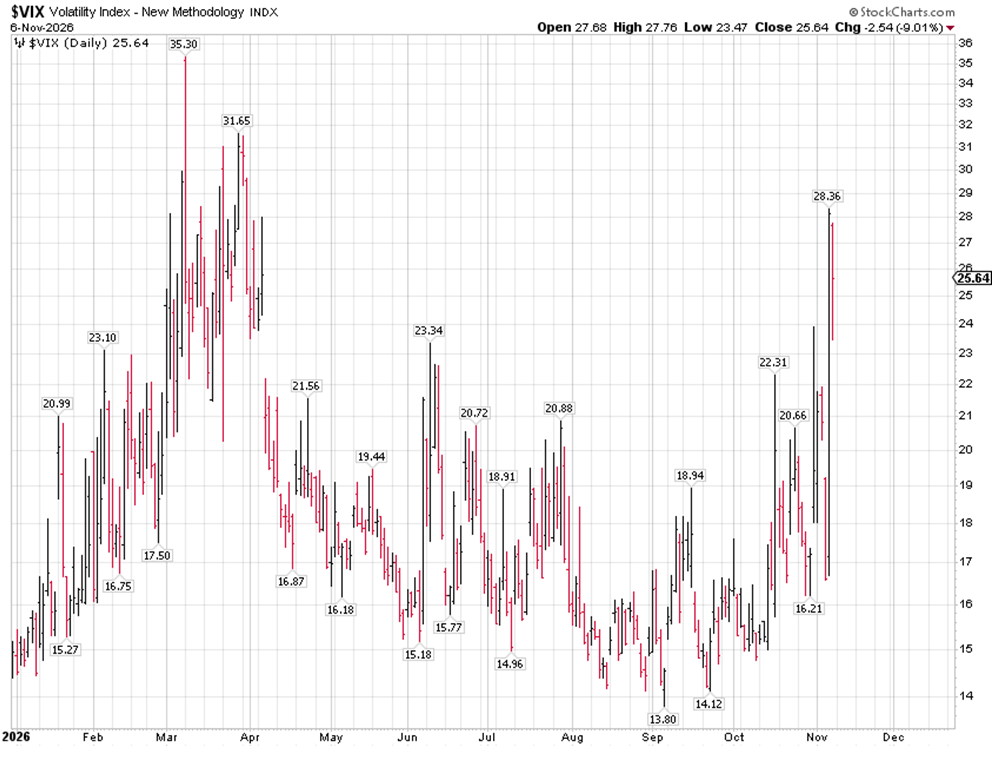
The S&P 500 Volatility Index (VIX) went all the way to 28 last Thursday and this year we have only one close above 30 at the onset of the war. A double-digit decline in the VIX or, better yet, a gap down (or both) would indicate we have made a likely bottom similar to early April 2026 (see chart above).
VIX is basically a measure of how expensive index put protection is: The higher the VIX, the more panicked investors are. After a big spike, a slide below 20 would be considered a buy signal for stocks.
Graphs are for illustrative and discussion purposes only. Please read important disclosures at the end of this commentary.
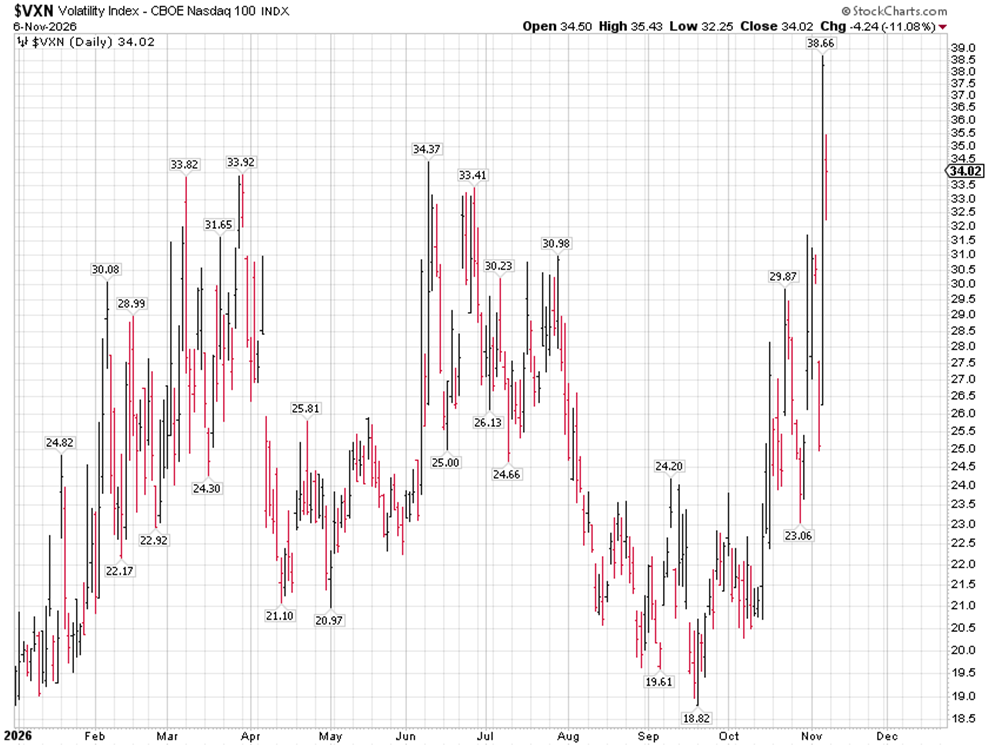
There is also a NASDAQ 100 Volatility Index (VXN), similar to the VIX, but only for NASDAQ 100 Index options. We actually made a new high for the year a few ticks below 39, which is a rather high reading. It would be normal to have a high reading as the disorderly liquidation has been in the NASDAQ 100 Index and more precisely in the PHLX Semiconductor Index.
It is never possible to guarantee a stock market bottom ahead of time as the President can move the S&P 500 by 1-2% with a single post on Truth Social, which he has done more than once this year. But without Iran escalation or any similar geopolitical event, 7200-7300 should hold for the S&P 500 and fresh all-time highs by the end of the year may very well happen with record EPS for the index.
All content above represents the opinion of Ivan Martchev of Navellier & Associates, Inc.
Also In This Issue
A Look Ahead by Louis Navellier
Great Earnings Will Keep Fueling Market (and Economic) Growth
Income Mail by Bryan Perry
Bipartisan Investment Themes For 2027
Growth Mail by Gary Alexander
Food for Thought (and Action) on Veteran’s Day
Global Mail by Ivan Martchev
On Market Moves and Political Repercussions
Sector Spotlight by Jason Bodner
How to Ride the Market’s Rare but Powerful Rogue Waves
Important Disclosures:
Although information in these reports has been obtained from and is based upon sources that Navellier believes to be reliable, Navellier does not guarantee its accuracy and it may be incomplete or condensed. All opinions and estimates constitute the authors opinions as of the date the report was created and are subject to change without notice. These reports are for informational purposes only and are not a solicitation for the purchase or sale of any securities or financial services. Any decision to purchase securities mentioned in these reports must take into account existing public information on such securities or any registered prospectus. To the extent permitted by law, neither Navellier & Associates, Inc., nor any of its affiliates, agents, or service providers are providing any investment advice herein and do not assume any liability or responsibility for the readers’ decisions if any. No reader should act or refrain from acting in reliance on the information contained in this communication or for any decision based on it.
None of the stock information, data, or company information presented herein constitutes investment advice or a recommendation by Navellier or a solicitation to buy or sell any securities. Any specific securities identified and described herein do not represent any investment advice.
Information presented is general information that does not take into account your individual circumstances, financial situation, or needs, nor does it present a personalized recommendation to you. Individual stocks presented may not be suitable for every investor. Investment in securities involves significant risk and has the potential for partial or complete loss of funds invested. Investment in fixed income securities has the potential for the investment return and principal value of an investment to fluctuate so that an investor’s holdings, when redeemed, may be worth less than their original cost.
- This report contains statements that are, or may be considered to be, forward-looking statements. All statements that are not historical facts, including statements about our beliefs or expectations, are “forward-looking statements” within the meaning of The U.S. Private Securities Litigation Reform Act of 1995. These statements may be identified by such forward-looking terminology as “expect,” “estimate,” “plan,” “intend,” “believe,” “anticipate,” “may,” “will,” “should,” “could,” “continue,” “project,” or similar statements or variations of such terms. Our forward-looking statements are based on a series of expectations, assumptions, and projections, are not investment advice. All of our forward-looking statements are as of the date of this report only.
- Federal Tax Advice Disclaimer: As required by U.S. Treasury Regulations, you are informed that, to the extent this presentation mentions any federal taxes, Navellier is not presenting any tax advice and should not be used or relied on as tax advice. Navellier does not advise on any income tax requirements or issues. Use of any information presented by Navellier is for general information only and does not represent tax advice either express or implied. You are encouraged to seek professional tax advice for income tax questions and assistance.
- FactSet Disclosure: Navellier does not independently calculate the statistical information included in the attached report. The calculation and the information are provided by FactSet, a company not related to Navellier. Although information contained in the report has been obtained from FactSet and is based on sources Navellier believes to be reliable, Navellier does not guarantee its accuracy, and it may be inaccurate, incomplete or condensed. The report and the related FactSet sourced information is for general information purposes only.