by Jason Bodner
January 9, 2024
In my 20s, I had more New Year’s Day hangovers than now. I’ve learned since then that it’s not how much you drink but how often (or seldom) you drink that determines the hangover’s Richter scale.
Numerous studies suggest that hangovers hit light or moderate drinkers harder than heavy drinkers.
Sufferers may say: “OK, smarty pants, whatever you say – but how do I fix it now?” Some opt for the “hair of the dog that bit you” formula, a Bloody Mary. Back in the day, I favored an egg, cheese and a truckload of water. Either way, too much late-night fun drinking is usually followed by morning unfun.
And so it goes for investing, too…
The much-toasted New Year of 2024 is here, and the go-go fourth quarter of 2023 sits squarely in the rear-view mirror, so if you want to know what a market hangover looks like – it’s this: Nearly all Red.
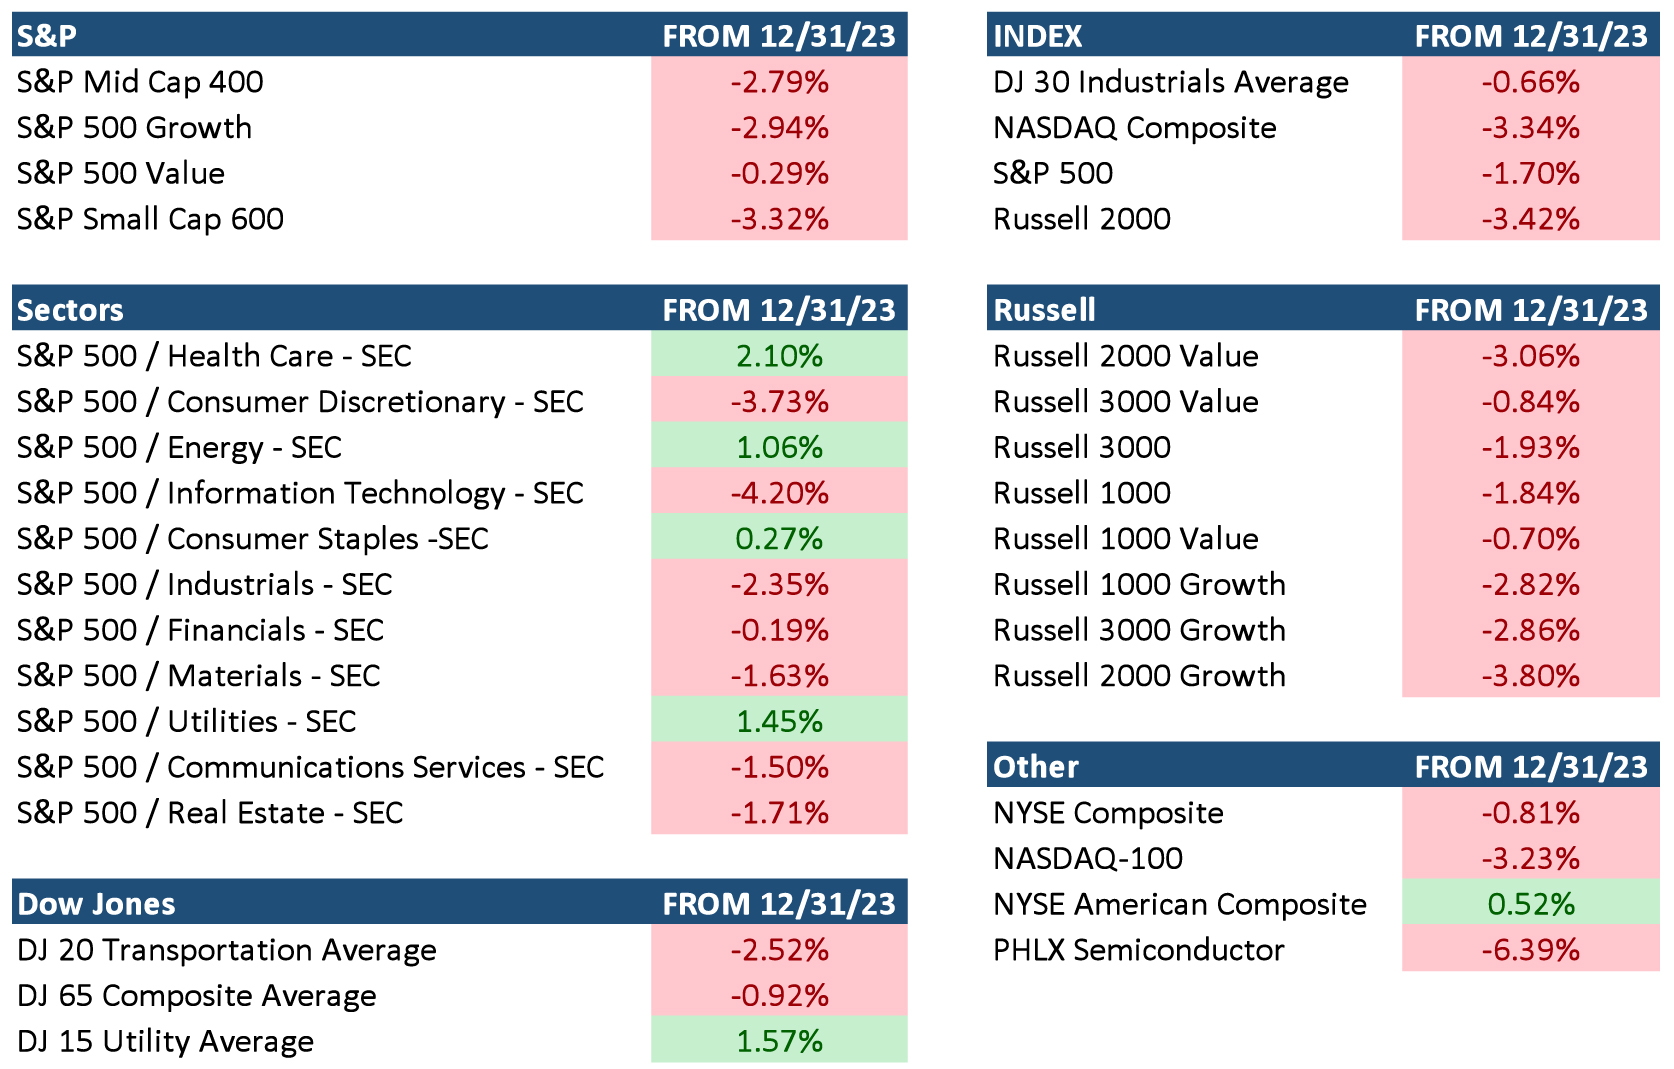
Graphs are for illustrative and discussion purposes only. Please read important disclosures at the end of this commentary.
Small-cap stocks sagged, tech stocks sucked wind, and semiconductors got smoked. Only six of 27 indexes in this table were positive, and they were defensive ones: utilities, staples, health, and energy.
Compare this to what we saw since October 26th lows, and the departure is obvious:
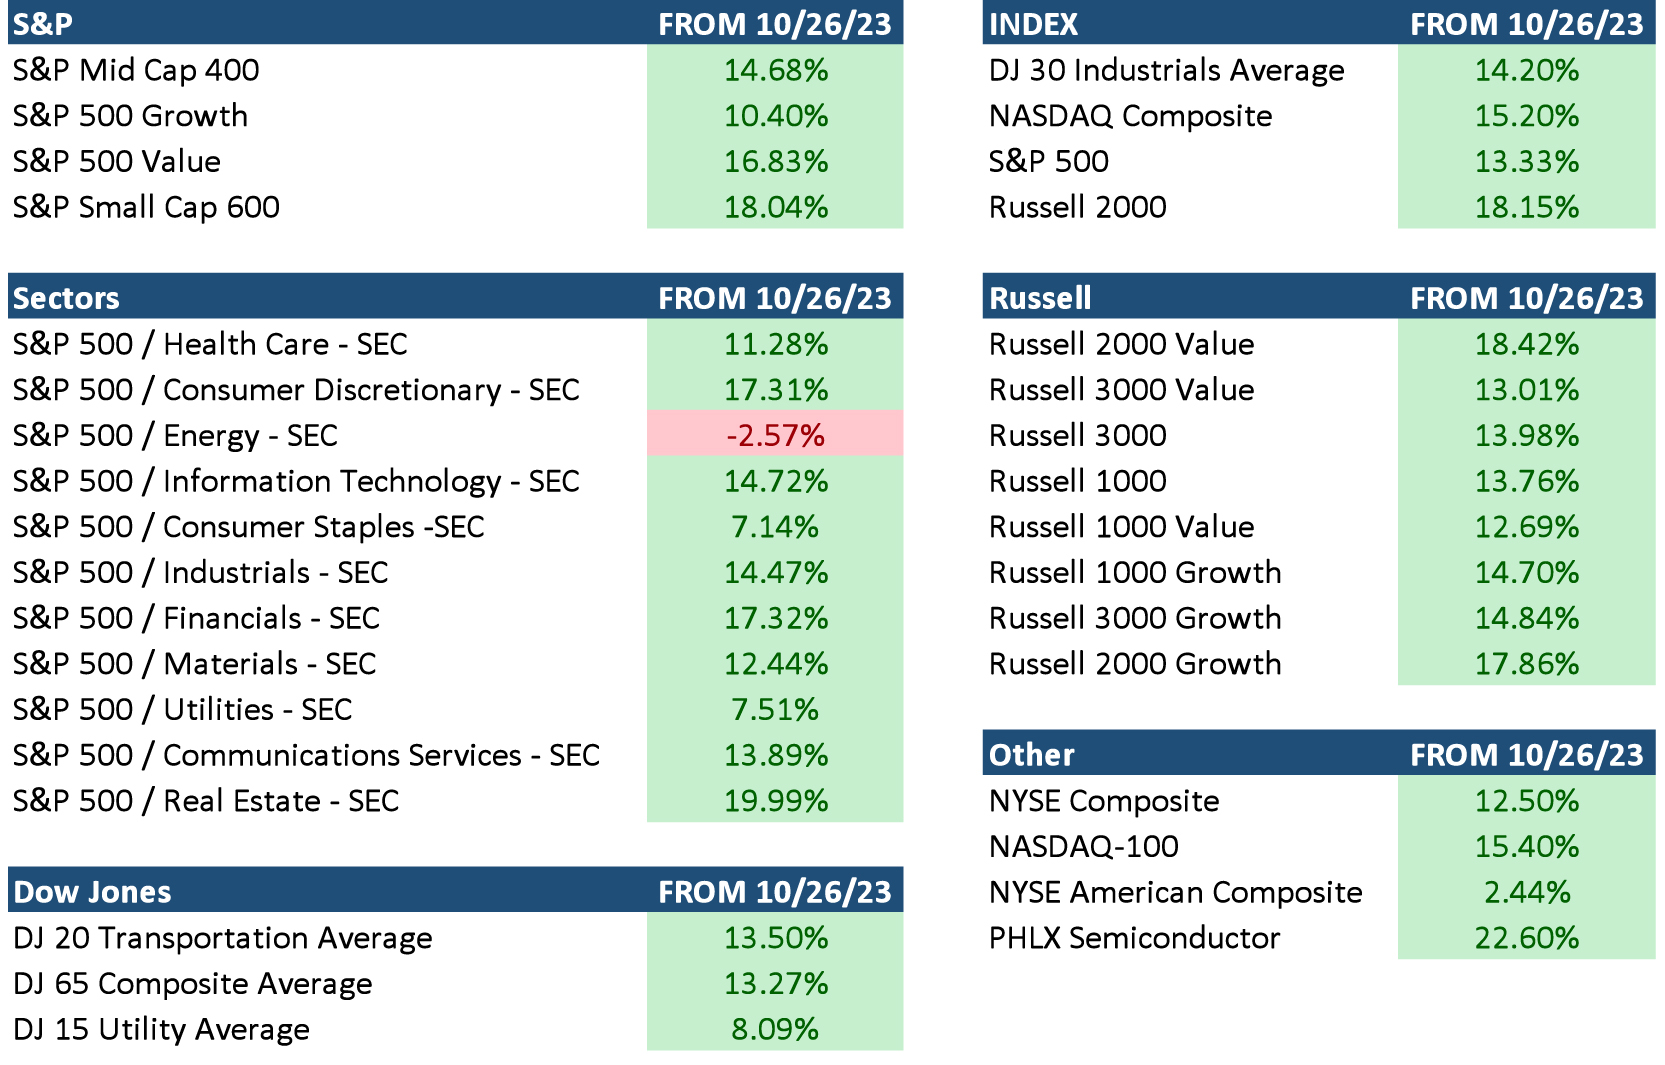
Graphs are for illustrative and discussion purposes only. Please read important disclosures at the end of this commentary.
Nearly every tracked index surged since October 26. Of the 34 U.S. stock indexes I track, only one was down, barely (energy, after being up strongly), and only four others had single digit positive returns.
Maybe market traders drank too much in Q4, so let’s contextualize the first week of 2024. The data helps us know where we are – and where we might go.
First, the Big Money Index (BMI) is heavily overbought, so was this correction right on schedule?
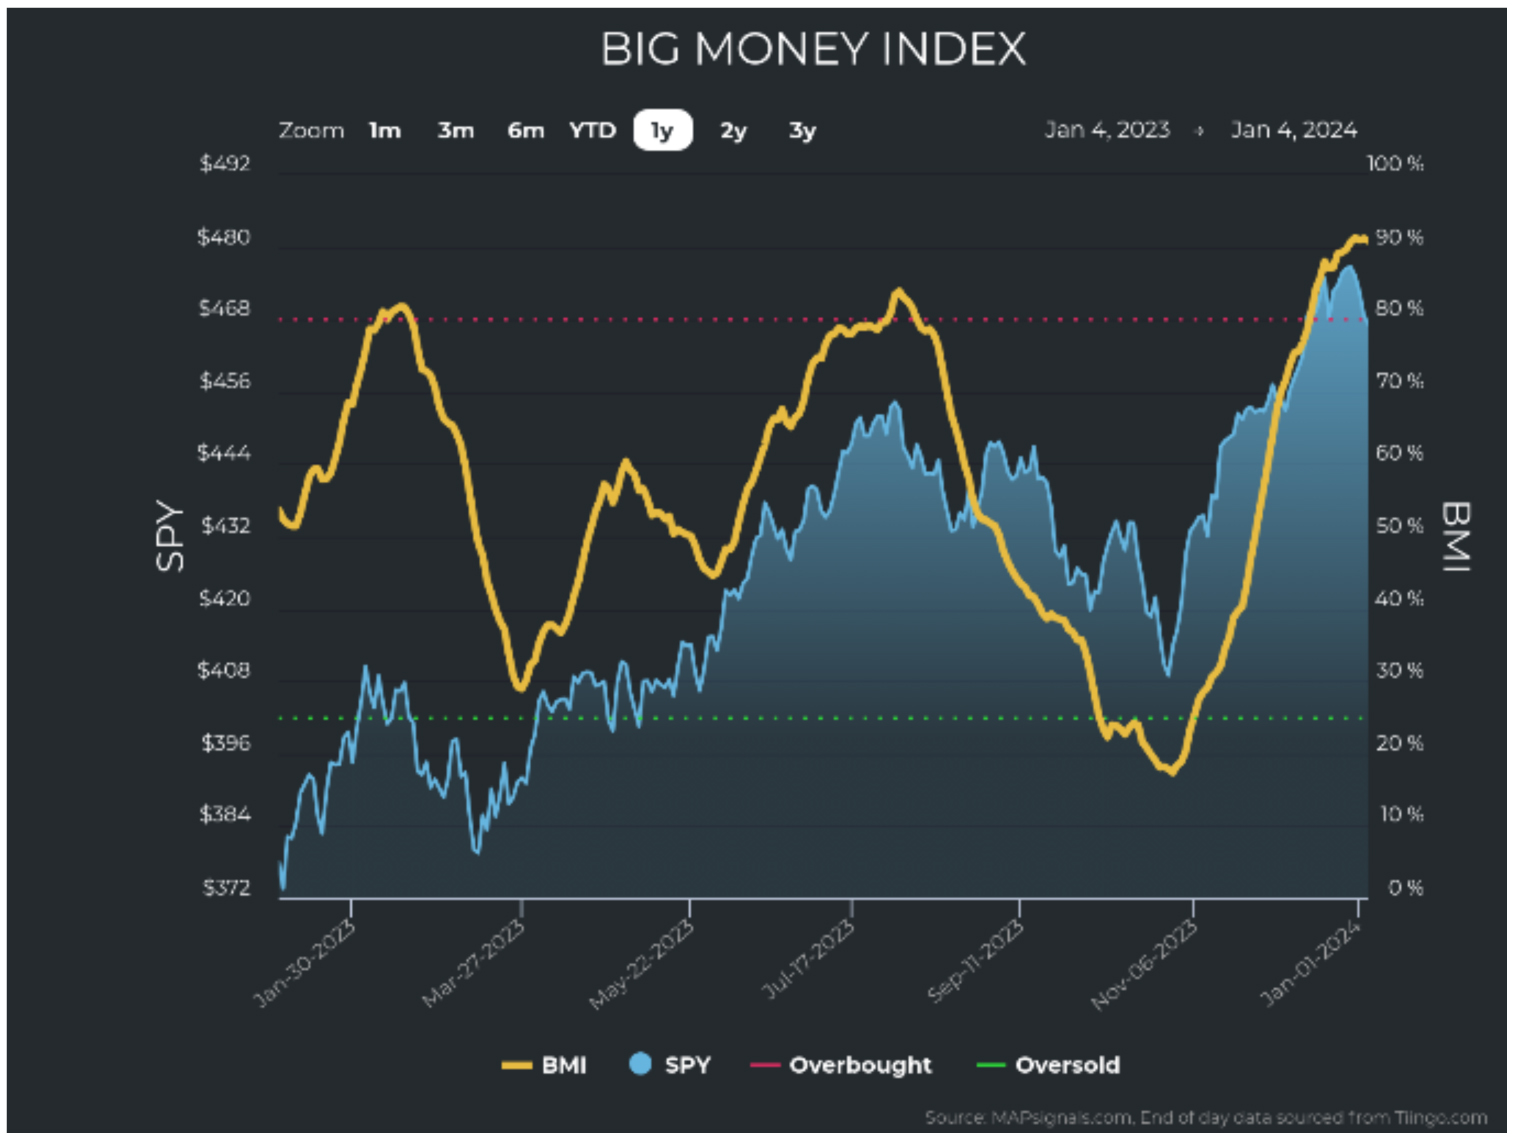
Graphs are for illustrative and discussion purposes only. Please read important disclosures at the end of this commentary.
Well, first off, I’ll remind you that the BMI can stay overbought for a long time. What matters more than being overbought is when it first falls from being overbought, which could be anytime. If selling rips through the market, I’d expect it to fall, but if buying picks up again, we could stay overbought for weeks.
Second, as I write this on Friday, January 5th, we’ve only had four trading days thus far in 2024, with three down days followed by an up day. Not a huge sample. I’ll tell you this: When I worked on Wall Street, I rarely worked right after New Year’s Day. When I did, it was because I was a junior staffer, or I drew the short straw. Experience tells me that most senior traders and portfolio managers are salvaging their ski vacations or are squeezing out the last drops of winter break before their kids go back to school. (That’s what I did: My kids were at home last week, so I’d say the trends of Week #1 are no big concern).
Next, let’s check unusual trading volumes. Let’s begin with unusually large trading. We should expect that January would see a bump in volumes that slow down going into Christmas and New Year’s. That’s what we see here. This makes sense, since portfolio managers reposition, and many investment companies require capital deployment in the New Year. Remember: Managers don’t make fees holding cash.
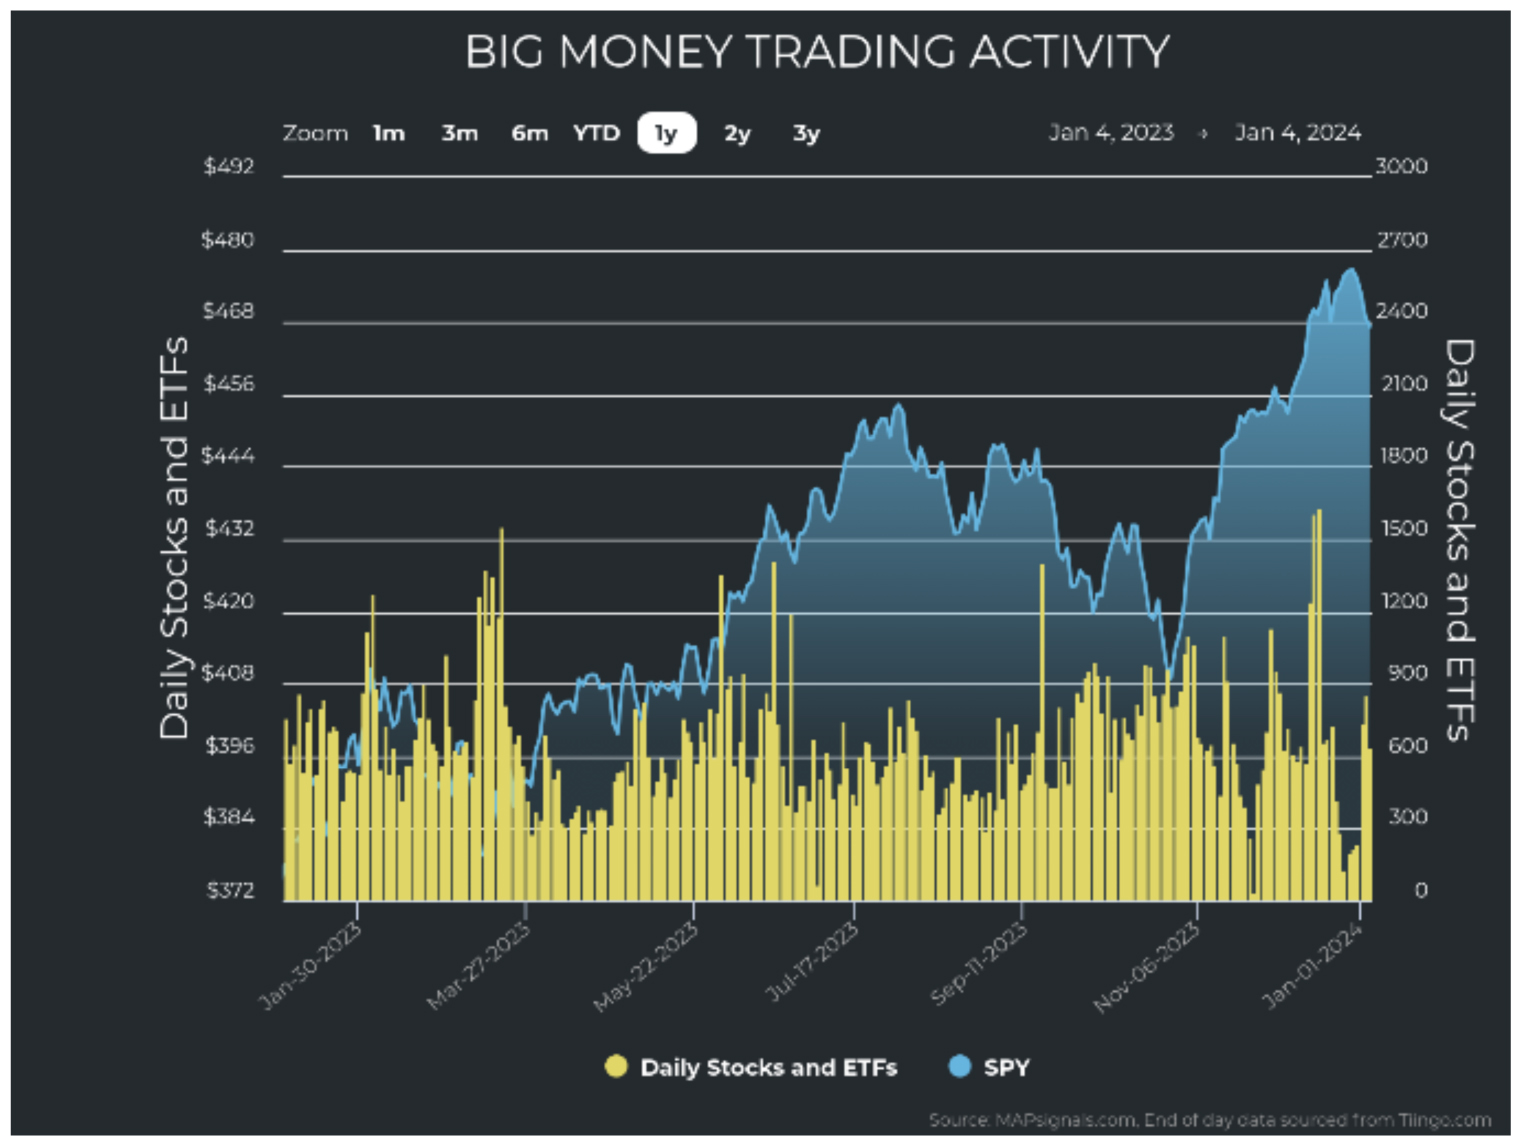
Graphs are for illustrative and discussion purposes only. Please read important disclosures at the end of this commentary.
Looking at unusual buying and selling of stocks and ETFs, however, we see something different:
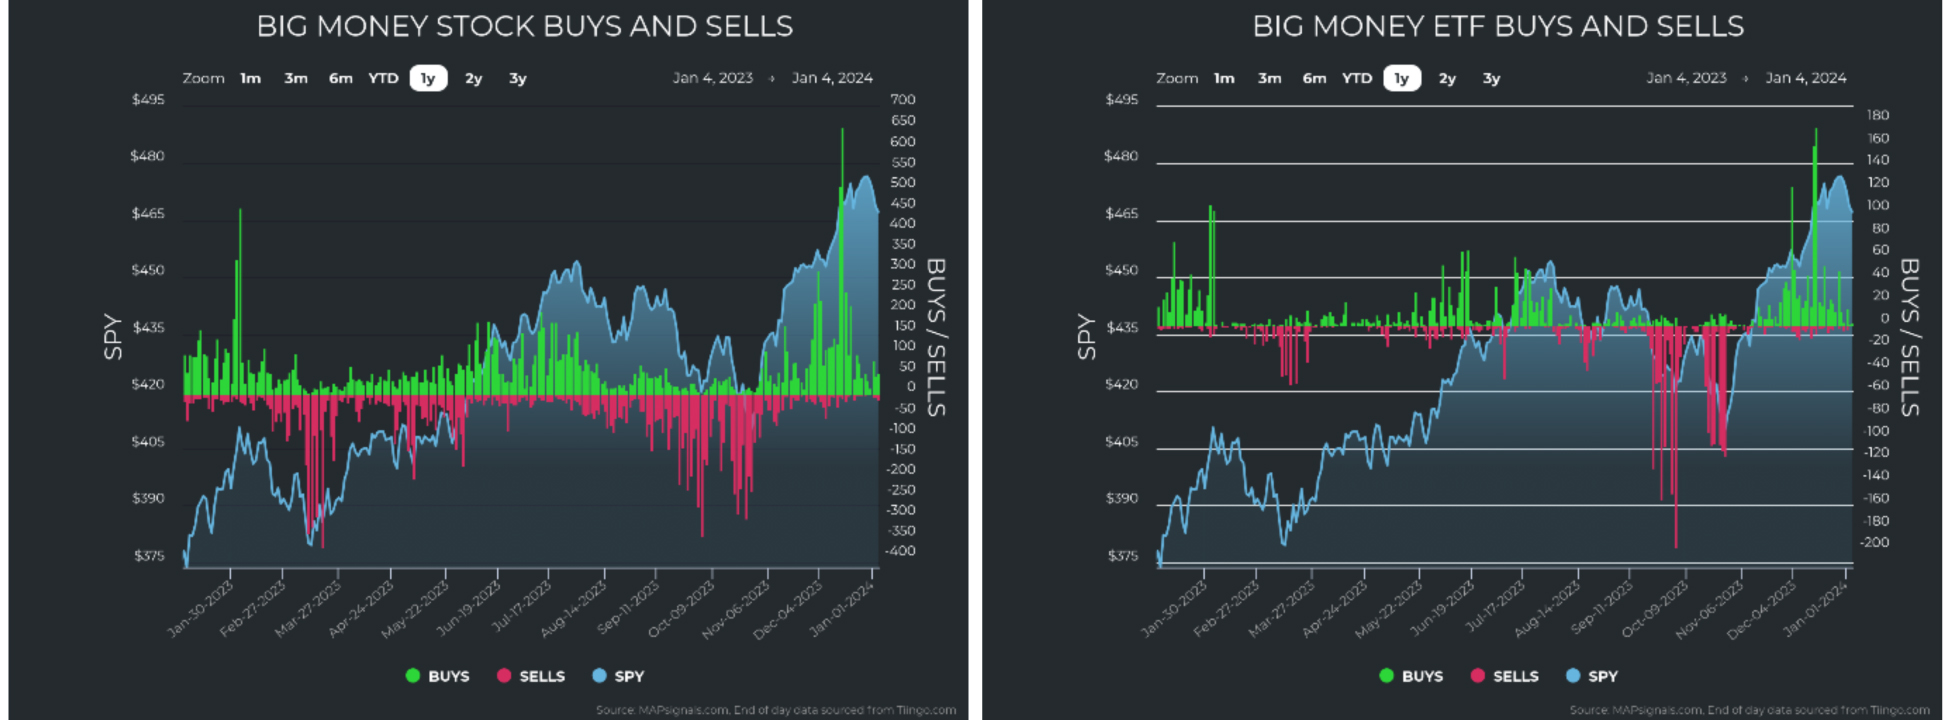
Graphs are for illustrative and discussion purposes only. Please read important disclosures at the end of this commentary.
Notice the shallowness (or near-absence) of green and red stalks at the far right. This indicates no major exit or entrance from the market but a rotation out of leading sectors and into lagging ones.
To confirm this, we simply consult the tables for the various indexes. Take semiconductors as our prime example: The group fell 6.4% after soaring by nearly 32% from October 26th to New Year’s Eve.
This is echoed in the Semiconductor Holders Trust (SMH) ETF:
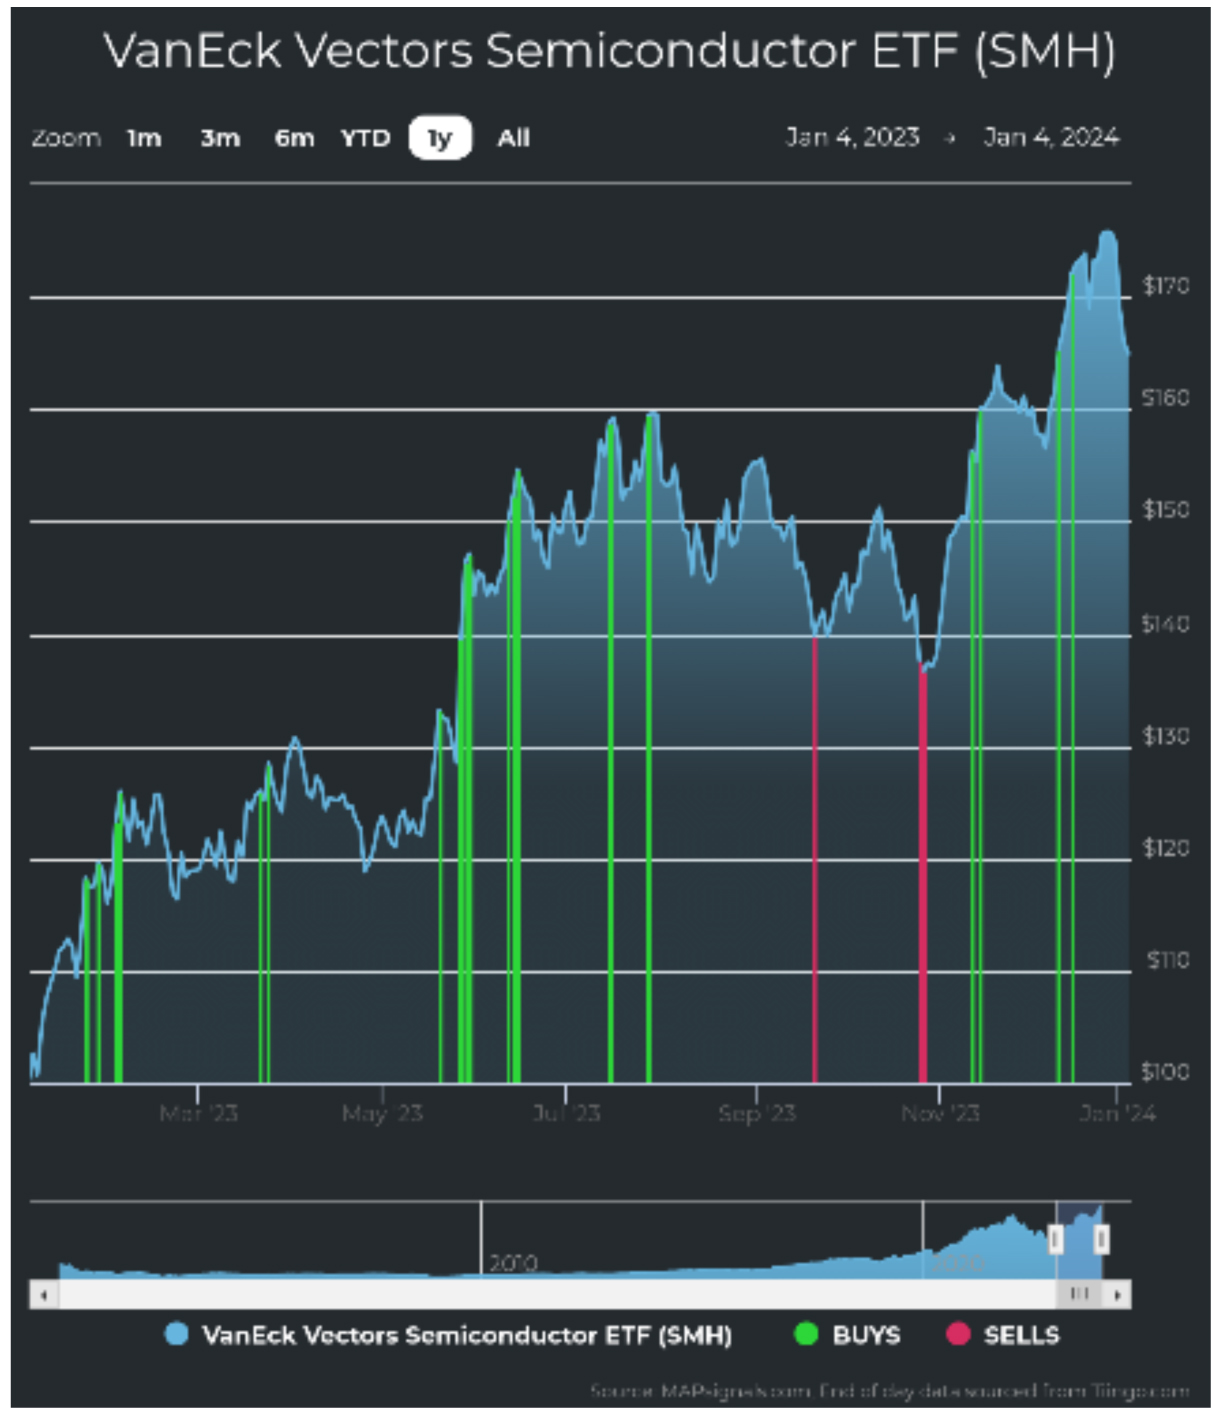
Graphs are for illustrative and discussion purposes only. Please read important disclosures at the end of this commentary.
Look at the recent green bars, indicating unusual buying. The latest price drop, however, has no red bars. This indicates a normal healthy pullback, and not necessarily a bend in the trend.
Keep that in mind as we look at sector index charts (using ETFs as proxy). What jumps out at me is the absence of any significant big buying or selling. (Health Care and staples are the only small exceptions).
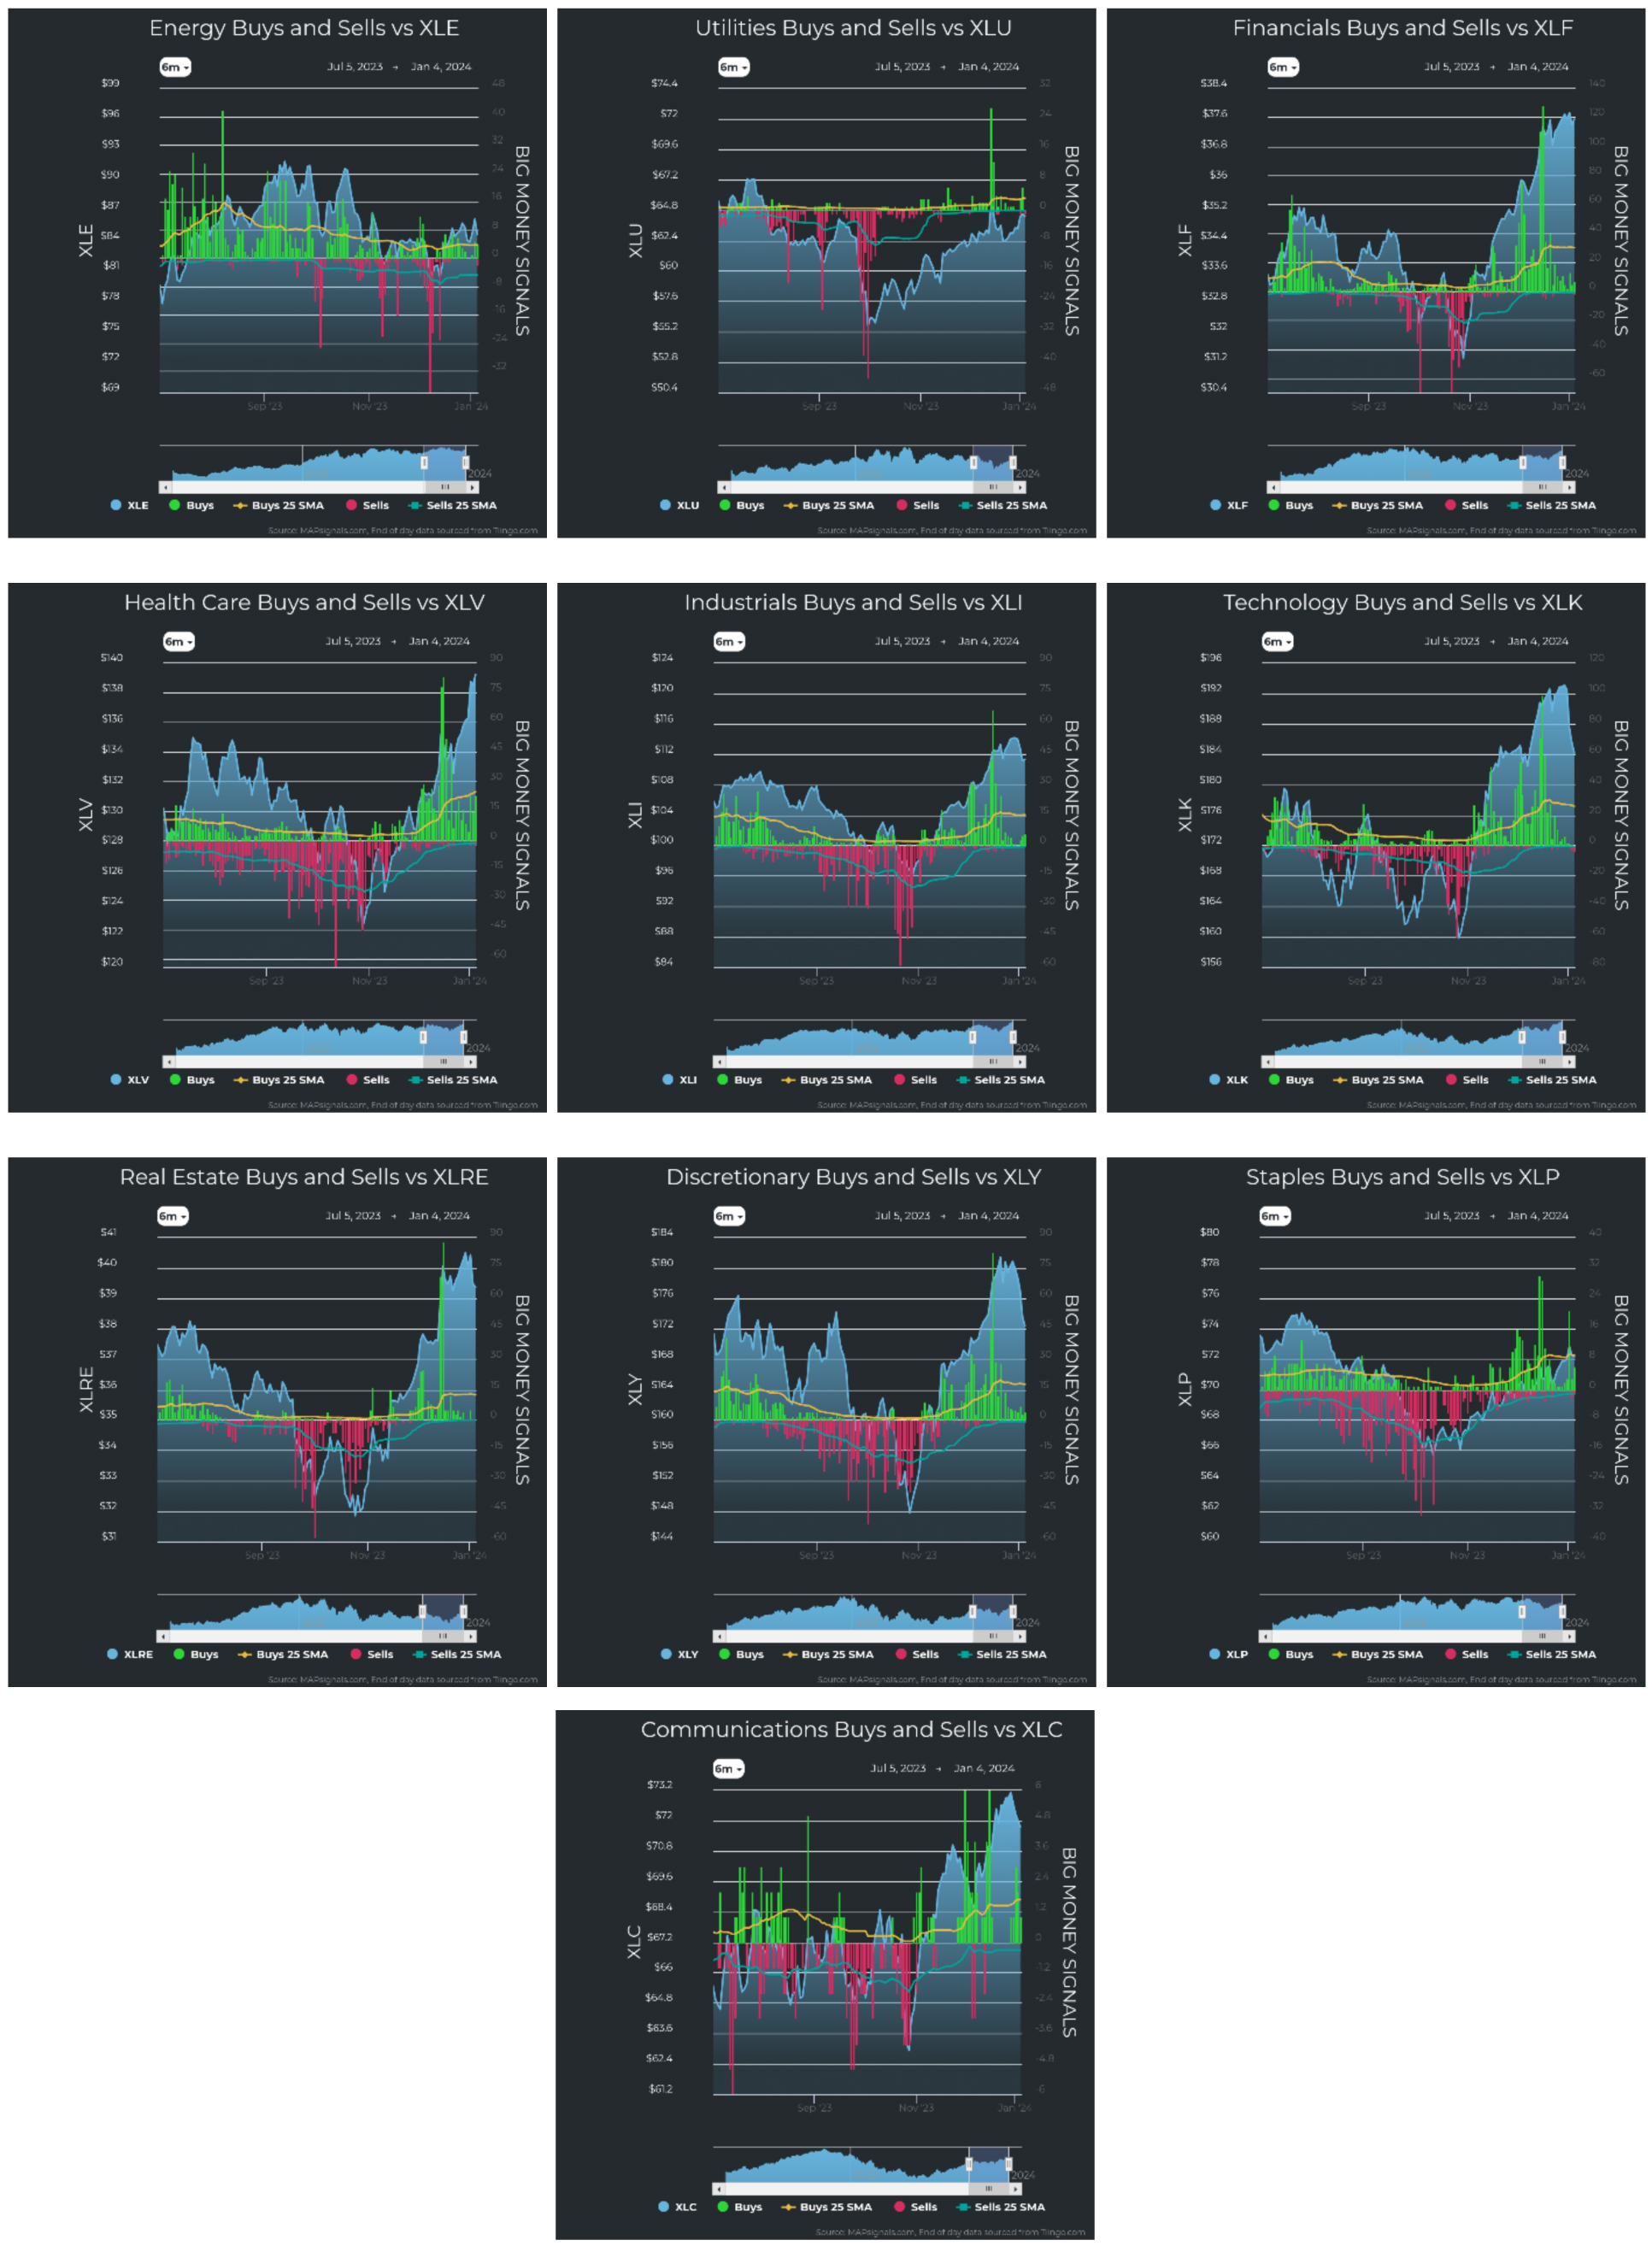
Graphs are for illustrative and discussion purposes only. Please read important disclosures at the end of this commentary.
Another interesting New Year’s phenomenon in my data is that sector strength and weakness seems to reset each year in my database. This is due to my stock scoring model being a year-to-date performance measure. The metric is nearly complete at end-of-year, but in the first days of each year, there is no real YTD performance yet, so it immediately yields some very different leaders/laggards from last year:
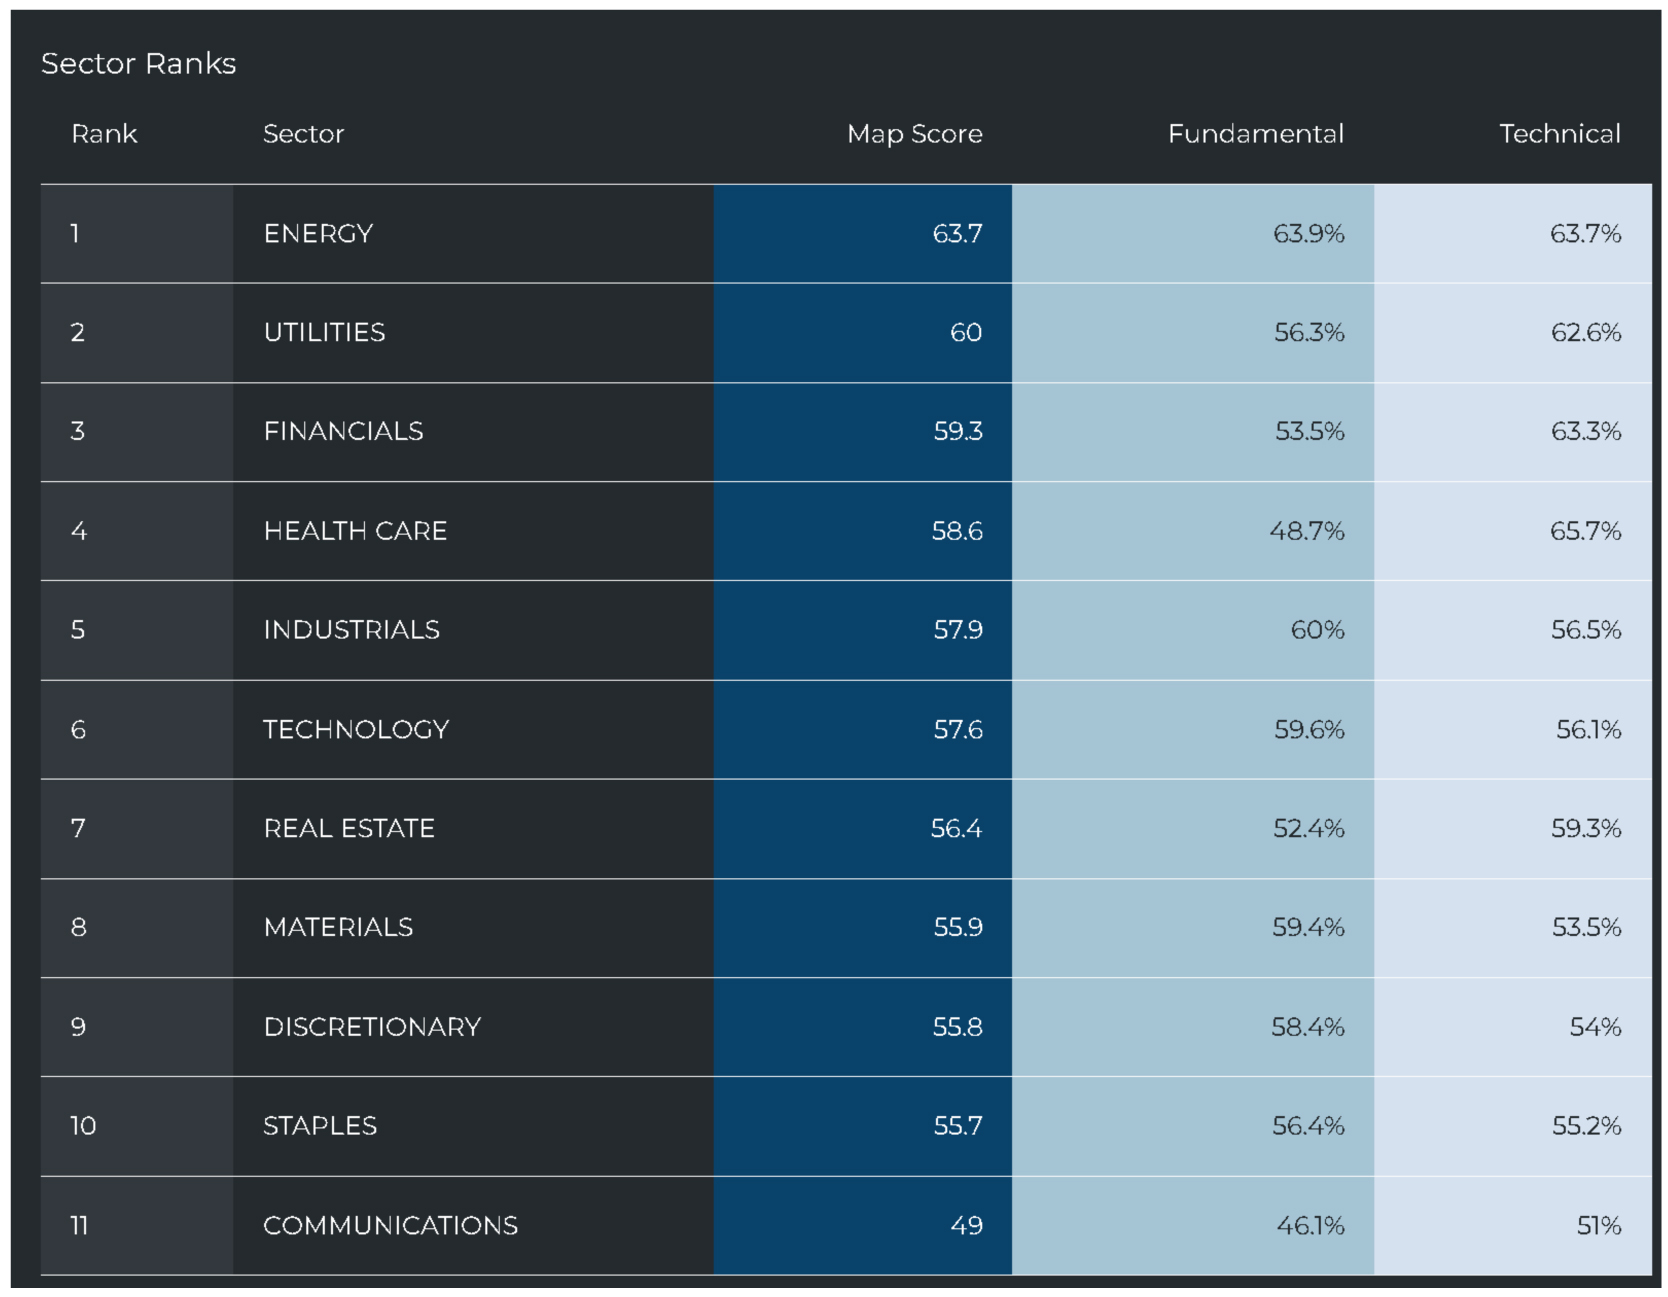
Graphs are for illustrative and discussion purposes only. Please read important disclosures at the end of this commentary.
This may seem like flawed logic, but it can be very useful to reset each year. After all, don’t we all like to reset some of our annual goals with each New Year’s and the inevitable resolutions?
This phenomenon is particularly useful in presidential election years, like 2024.
Expect a Slower Start (but Strong Finish) in a Presidential Election Year
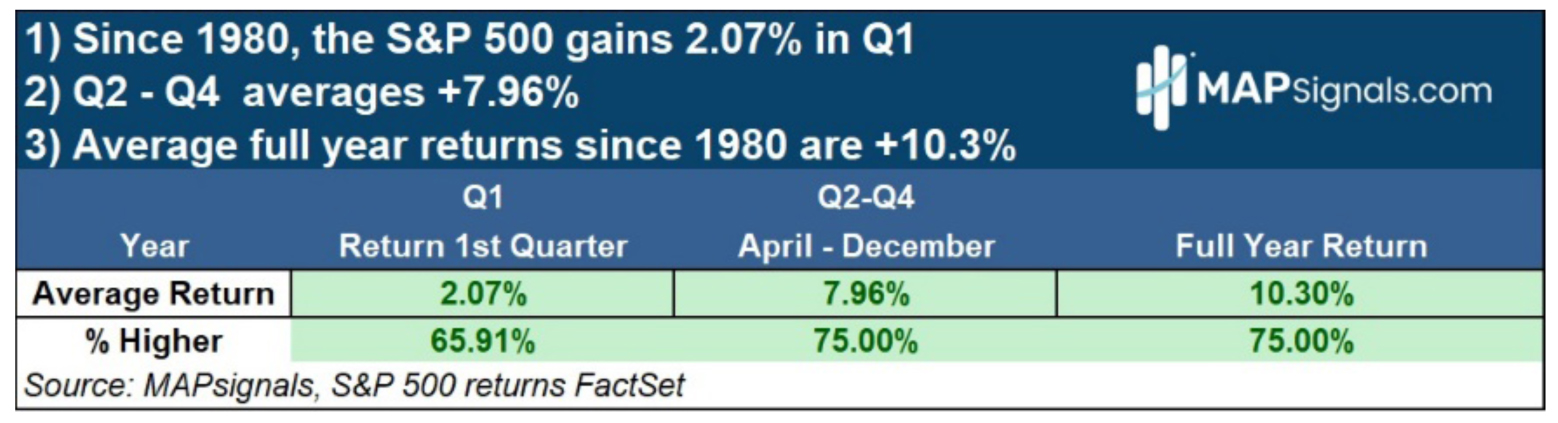
My research firm just studied market returns in the first quarter of presidential election years. Overall, we can expect a good year most years. Since 1980, the S&P 500 has averaged 10.3% annually. Looking at Q1, it historically averages +2.07%, while Q2 – Q4 accounts for 8% gains, but this is only the average.
Graphs are for illustrative and discussion purposes only. Please read important disclosures at the end of this commentary.
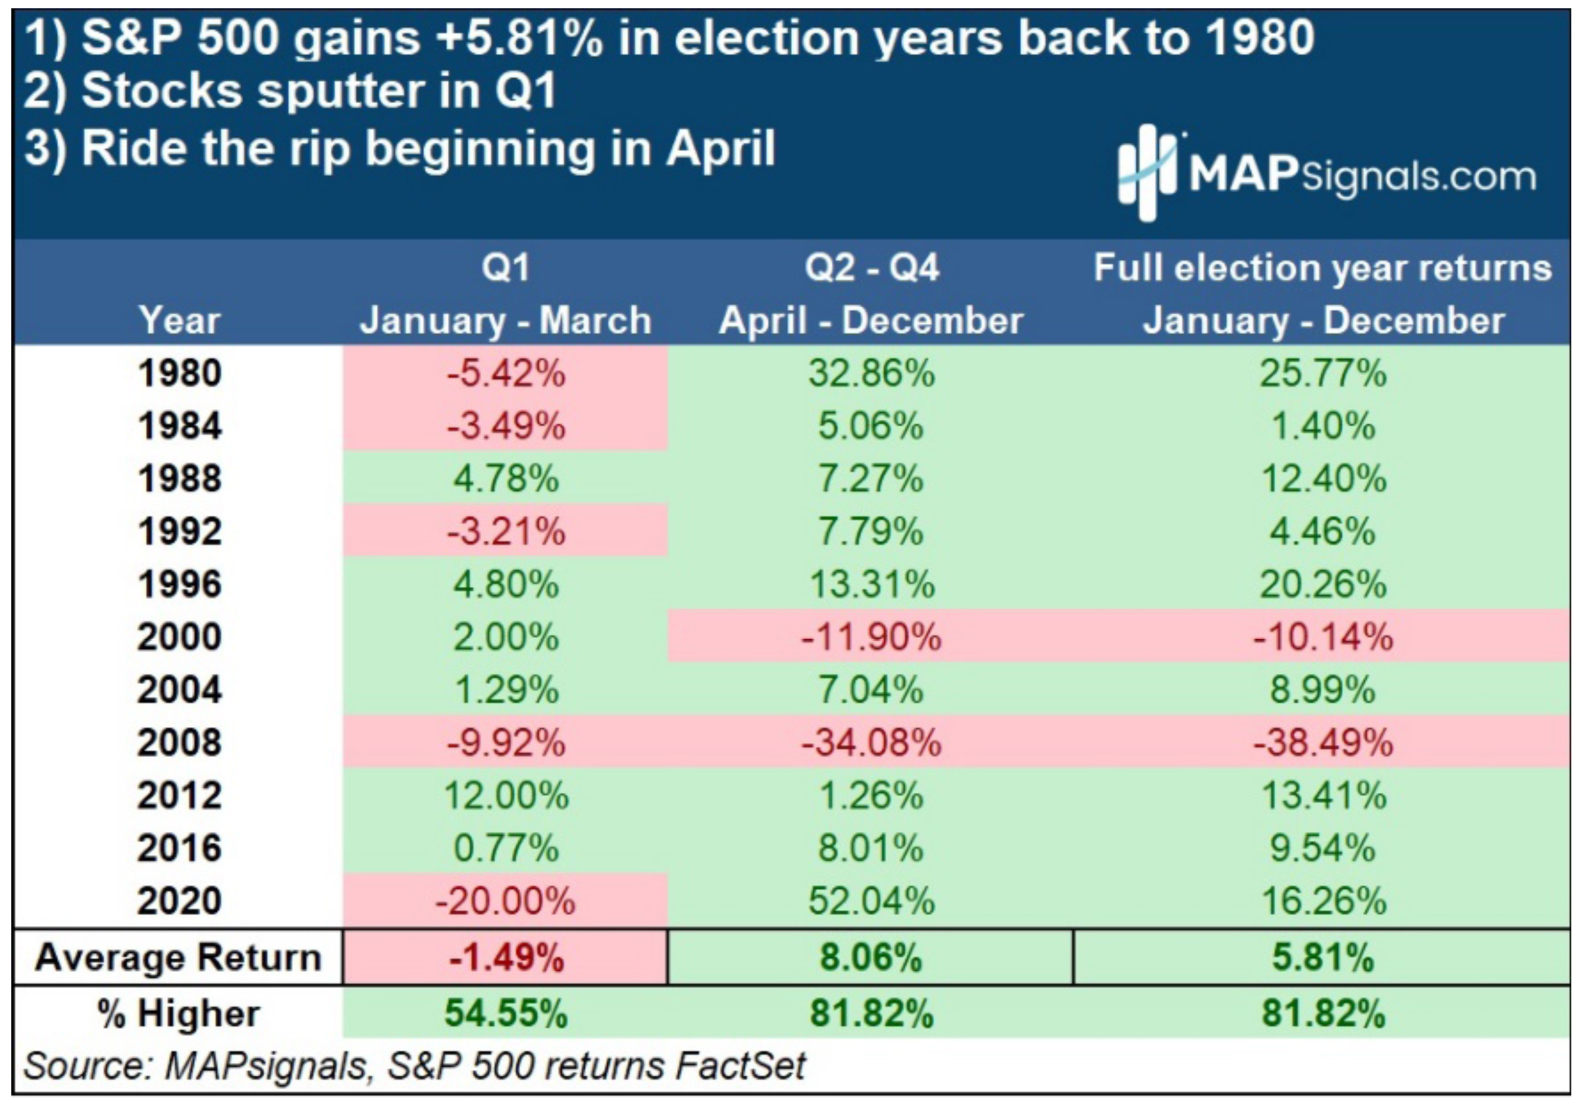
When it comes to presidential election years, the results since 1980 are lower, especially in the first quarter. I looked at each election year since 1980. To summarize, stocks get sold early in the year and bought later on. This makes sense, as investors hate risk and would rather sidestep any major surprises.
There were 11 prior presidential elections since 1980. Historically, stocks are weaker in election years but January – March is typically when most of that weakness occurs. It turns out election Q1’s fall -1.49% versus the usual +2.07% since 1980, but Q2-Q4 average a stellar +8.06%, slightly better than the 7.96% average.
Graphs are for illustrative and discussion purposes only. Please read important disclosures at the end of this commentary.
To me, this means last week’s dip is on schedule in presenting an opportunity to buy great stocks on sale. Add this to the many reasons I outlined for a bullish case – a few being:
• Record cash on the sidelines of $6+ trillion
• Above-average short-term rates (5%+) versus falling inflation (c. 3%)
• A falling 10-year rate (peaking at 4.997%, now at 3.97%)
• The recession that never came…and
• Growth sector leadership
I’m bullish for 2024, despite election year history since 1980.
As far as elections go remember Mark Twain: “If voting made any difference, they wouldn’t let us do it.”
All content above represents the opinion of Jason Bodner of Navellier & Associates, Inc.
Also In This Issue
A Look Ahead by Louis Navellier
The Middle Eastern Theater of War Has Suddenly Escalated
Income Mail by Bryan Perry
Two Lagging Income Sectors in 2023 Look Like Winners in 2024
Growth Mail by Gary Alexander
Three Major 2024 Challenges Emerged in Week #1
Global Mail by Ivan Martchev
Why No Santa Claus Rally for the S&P 500 in 2024?
Sector Spotlight by Jason Bodner
Will the Recent Market “Hangover” Last Through March?
View Full Archive
Read Past Issues Here

Jason Bodner
MARKETMAIL EDITOR FOR SECTOR SPOTLIGHT
Jason Bodner writes Sector Spotlight in the weekly Marketmail publication and has authored several white papers for the company. He is also Co-Founder of Macro Analytics for Professionals which produces proprietary equity accumulation/distribution research for its clients. Previously, Mr. Bodner served as Director of European Equity Derivatives for Cantor Fitzgerald Europe in London, then moved to the role of Head of Equity Derivatives North America for the same company in New York. He also served as S.V.P. Equity Derivatives for Jefferies, LLC. He received a B.S. in business administration in 1996, with honors, from Skidmore College as a member of the Periclean Honors Society. All content of “Sector Spotlight” represents the opinion of Jason Bodner
Important Disclosures:
Jason Bodner is a co-founder and co-owner of Mapsignals. Mr. Bodner is an independent contractor who is occasionally hired by Navellier & Associates to write an article and or provide opinions for possible use in articles that appear in Navellier & Associates weekly Market Mail. Mr. Bodner is not employed or affiliated with Louis Navellier, Navellier & Associates, Inc., or any other Navellier owned entity. The opinions and statements made here are those of Mr. Bodner and not necessarily those of any other persons or entities. This is not an endorsement, or solicitation or testimonial or investment advice regarding the BMI Index or any statements or recommendations or analysis in the article or the BMI Index or Mapsignals or its products or strategies.
Although information in these reports has been obtained from and is based upon sources that Navellier believes to be reliable, Navellier does not guarantee its accuracy and it may be incomplete or condensed. All opinions and estimates constitute Navellier’s judgment as of the date the report was created and are subject to change without notice. These reports are for informational purposes only and are not a solicitation for the purchase or sale of a security. Any decision to purchase securities mentioned in these reports must take into account existing public information on such securities or any registered prospectus.To the extent permitted by law, neither Navellier & Associates, Inc., nor any of its affiliates, agents, or service providers assumes any liability or responsibility nor owes any duty of care for any consequences of any person acting or refraining to act in reliance on the information contained in this communication or for any decision based on it.
Past performance is no indication of future results. Investment in securities involves significant risk and has the potential for partial or complete loss of funds invested. It should not be assumed that any securities recommendations made by Navellier. in the future will be profitable or equal the performance of securities made in this report. Dividend payments are not guaranteed. The amount of a dividend payment, if any, can vary over time and issuers may reduce dividends paid on securities in the event of a recession or adverse event affecting a specific industry or issuer.
None of the stock information, data, and company information presented herein constitutes a recommendation by Navellier or a solicitation to buy or sell any securities. Any specific securities identified and described do not represent all of the securities purchased, sold, or recommended for advisory clients. The holdings identified do not represent all of the securities purchased, sold, or recommended for advisory clients and the reader should not assume that investments in the securities identified and discussed were or will be profitable.
Information presented is general information that does not take into account your individual circumstances, financial situation, or needs, nor does it present a personalized recommendation to you. Individual stocks presented may not be suitable for every investor. Investment in securities involves significant risk and has the potential for partial or complete loss of funds invested. Investment in fixed income securities has the potential for the investment return and principal value of an investment to fluctuate so that an investor’s holdings, when redeemed, may be worth less than their original cost.
One cannot invest directly in an index. Index is unmanaged and index performance does not reflect deduction of fees, expenses, or taxes. Presentation of Index data does not reflect a belief by Navellier that any stock index constitutes an investment alternative to any Navellier equity strategy or is necessarily comparable to such strategies. Among the most important differences between the Indices and Navellier strategies are that the Navellier equity strategies may (1) incur material management fees, (2) concentrate its investments in relatively few stocks, industries, or sectors, (3) have significantly greater trading activity and related costs, and (4) be significantly more or less volatile than the Indices.
ETF Risk: We may invest in exchange traded funds (“ETFs”) and some of our investment strategies are generally fully invested in ETFs. Like traditional mutual funds, ETFs charge asset-based fees, but they generally do not charge initial sales charges or redemption fees and investors typically pay only customary brokerage fees to buy and sell ETF shares. The fees and costs charged by ETFs held in client accounts will not be deducted from the compensation the client pays Navellier. ETF prices can fluctuate up or down, and a client account could lose money investing in an ETF if the prices of the securities owned by the ETF go down. ETFs are subject to additional risks:
- ETF shares may trade above or below their net asset value;
- An active trading market for an ETF’s shares may not develop or be maintained;
- The value of an ETF may be more volatile than the underlying portfolio of securities the ETF is designed to track;
- The cost of owning shares of the ETF may exceed those a client would incur by directly investing in the underlying securities; and
- Trading of an ETF’s shares may be halted if the listing exchange’s officials deem it appropriate, the shares are delisted from the exchange, or the activation of market-wide “circuit breakers” (which are tied to large decreases in stock prices) halts stock trading generally.
Grader Disclosures: Investment in equity strategies involves substantial risk and has the potential for partial or complete loss of funds invested. The sample portfolio and any accompanying charts are for informational purposes only and are not to be construed as a solicitation to buy or sell any financial instrument and should not be relied upon as the sole factor in an investment making decision. As a matter of normal and important disclosures to you, as a potential investor, please consider the following: The performance presented is not based on any actual securities trading, portfolio, or accounts, and the reported performance of the A, B, C, D, and F portfolios (collectively the “model portfolios”) should be considered mere “paper” or pro forma performance results based on Navellier’s research.
Investors evaluating any of Navellier & Associates, Inc.’s, (or its affiliates’) Investment Products must not use any information presented here, including the performance figures of the model portfolios, in their evaluation of any Navellier Investment Products. Navellier Investment Products include the firm’s mutual funds and managed accounts. The model portfolios, charts, and other information presented do not represent actual funded trades and are not actual funded portfolios. There are material differences between Navellier Investment Products’ portfolios and the model portfolios, research, and performance figures presented here. The model portfolios and the research results (1) may contain stocks or ETFs that are illiquid and difficult to trade; (2) may contain stock or ETF holdings materially different from actual funded Navellier Investment Product portfolios; (3) include the reinvestment of all dividends and other earnings, estimated trading costs, commissions, or management fees; and, (4) may not reflect prices obtained in an actual funded Navellier Investment Product portfolio. For these and other reasons, the reported performances of model portfolios do not reflect the performance results of Navellier’s actually funded and traded Investment Products. In most cases, Navellier’s Investment Products have materially lower performance results than the performances of the model portfolios presented.
This report contains statements that are, or may be considered to be, forward-looking statements. All statements that are not historical facts, including statements about our beliefs or expectations, are “forward-looking statements” within the meaning of The U.S. Private Securities Litigation Reform Act of 1995. These statements may be identified by such forward-looking terminology as “expect,” “estimate,” “plan,” “intend,” “believe,” “anticipate,” “may,” “will,” “should,” “could,” “continue,” “project,” or similar statements or variations of such terms. Our forward-looking statements are based on a series of expectations, assumptions, and projections, are not guarantees of future results or performance, and involve substantial risks and uncertainty as described in Form ADV Part 2A of our filing with the Securities and Exchange Commission (SEC), which is available at www.adviserinfo.sec.gov or by requesting a copy by emailing info@navellier.com. All of our forward-looking statements are as of the date of this report only. We can give no assurance that such expectations or forward-looking statements will prove to be correct. Actual results may differ materially. You are urged to carefully consider all such factors.
FEDERAL TAX ADVICE DISCLAIMER: As required by U.S. Treasury Regulations, you are informed that, to the extent this presentation includes any federal tax advice, the presentation is not written by Navellier to be used, and cannot be used, for the purpose of avoiding federal tax penalties. Navellier does not advise on any income tax requirements or issues. Use of any information presented by Navellier is for general information only and does not represent tax advice either express or implied. You are encouraged to seek professional tax advice for income tax questions and assistance.
IMPORTANT NEWSLETTER DISCLOSURE:The hypothetical performance results for investment newsletters that are authored or edited by Louis Navellier, including Louis Navellier’s Growth Investor, Louis Navellier’s Breakthrough Stocks, Louis Navellier’s Accelerated Profits, and Louis Navellier’s Platinum Club, are not based on any actual securities trading, portfolio, or accounts, and the newsletters’ reported hypothetical performances should be considered mere “paper” or proforma hypothetical performance results and are not actual performance of real world trades. Navellier & Associates, Inc. does not have any relation to or affiliation with the owner of these newsletters. There are material differences between Navellier Investment Products’ portfolios and the InvestorPlace Media, LLC newsletter portfolios authored by Louis Navellier. The InvestorPlace Media, LLC newsletters contain hypothetical performance that do not include transaction costs, advisory fees, or other fees a client might incur if actual investments and trades were being made by an investor. As a result, newsletter performance should not be used to evaluate Navellier Investment services which are separate and different from the newsletters. The owner of the newsletters is InvestorPlace Media, LLC and any questions concerning the newsletters, including any newsletter advertising or hypothetical Newsletter performance claims, (which are calculated solely by Investor Place Media and not Navellier) should be referred to InvestorPlace Media, LLC at (800) 718-8289.
Please note that Navellier & Associates and the Navellier Private Client Group are managed completely independent of the newsletters owned and published by InvestorPlace Media, LLC and written and edited by Louis Navellier, and investment performance of the newsletters should in no way be considered indicative of potential future investment performance for any Navellier & Associates separately managed account portfolio. Potential investors should consult with their financial advisor before investing in any Navellier Investment Product.
Navellier claims compliance with Global Investment Performance Standards (GIPS). To receive a complete list and descriptions of Navellier’s composites and/or a presentation that adheres to the GIPS standards, please contact Navellier or click here. It should not be assumed that any securities recommendations made by Navellier & Associates, Inc. in the future will be profitable or equal the performance of securities made in this report.
FactSet Disclosure: Navellier does not independently calculate the statistical information included in the attached report. The calculation and the information are provided by FactSet, a company not related to Navellier. Although information contained in the report has been obtained from FactSet and is based on sources Navellier believes to be reliable, Navellier does not guarantee its accuracy, and it may be incomplete or condensed. The report and the related FactSet sourced information are provided on an “as is” basis. The user assumes the entire risk of any use made of this information. Investors should consider the report as only a single factor in making their investment decision. The report is for informational purposes only and is not intended as an offer or solicitation for the purchase or sale of a security. FactSet sourced information is the exclusive property of FactSet. Without prior written permission of FactSet, this information may not be reproduced, disseminated or used to create any financial products. All indices are unmanaged and performance of the indices include reinvestment of dividends and interest income, unless otherwise noted, are not illustrative of any particular investment and an investment cannot be made in any index. Past performance is no guarantee of future results.