by Gary Alexander
January 17, 2024
(With More Losses to Come if They Don’t Cut Rates Soon)
Here is one more unintended consequence of Modern Monetary Theory (MMT), the “free lunch” school of economics, which says that sovereign governments can print as much money as they want with no serious consequences, as long as they control the printing press. Well, how is that working out so far?
We got near-double digit inflation in 2021 up to mid-2022, then the fastest rate increases in history to quell that inflation, resulting in a historic hangover of the Fed’s first loss this century: $116.4 billion.
The Fed told us this sad story late Friday, January 12, perhaps hoping it would be lost in the long holiday weekend news blackout and blizzard overtaking voters in Iowa – and drivers in most other states, as well as those of us hoping to catch an Alaska Airlines 737 Max 9 to a Jazz Cruise in Miami early this morning!
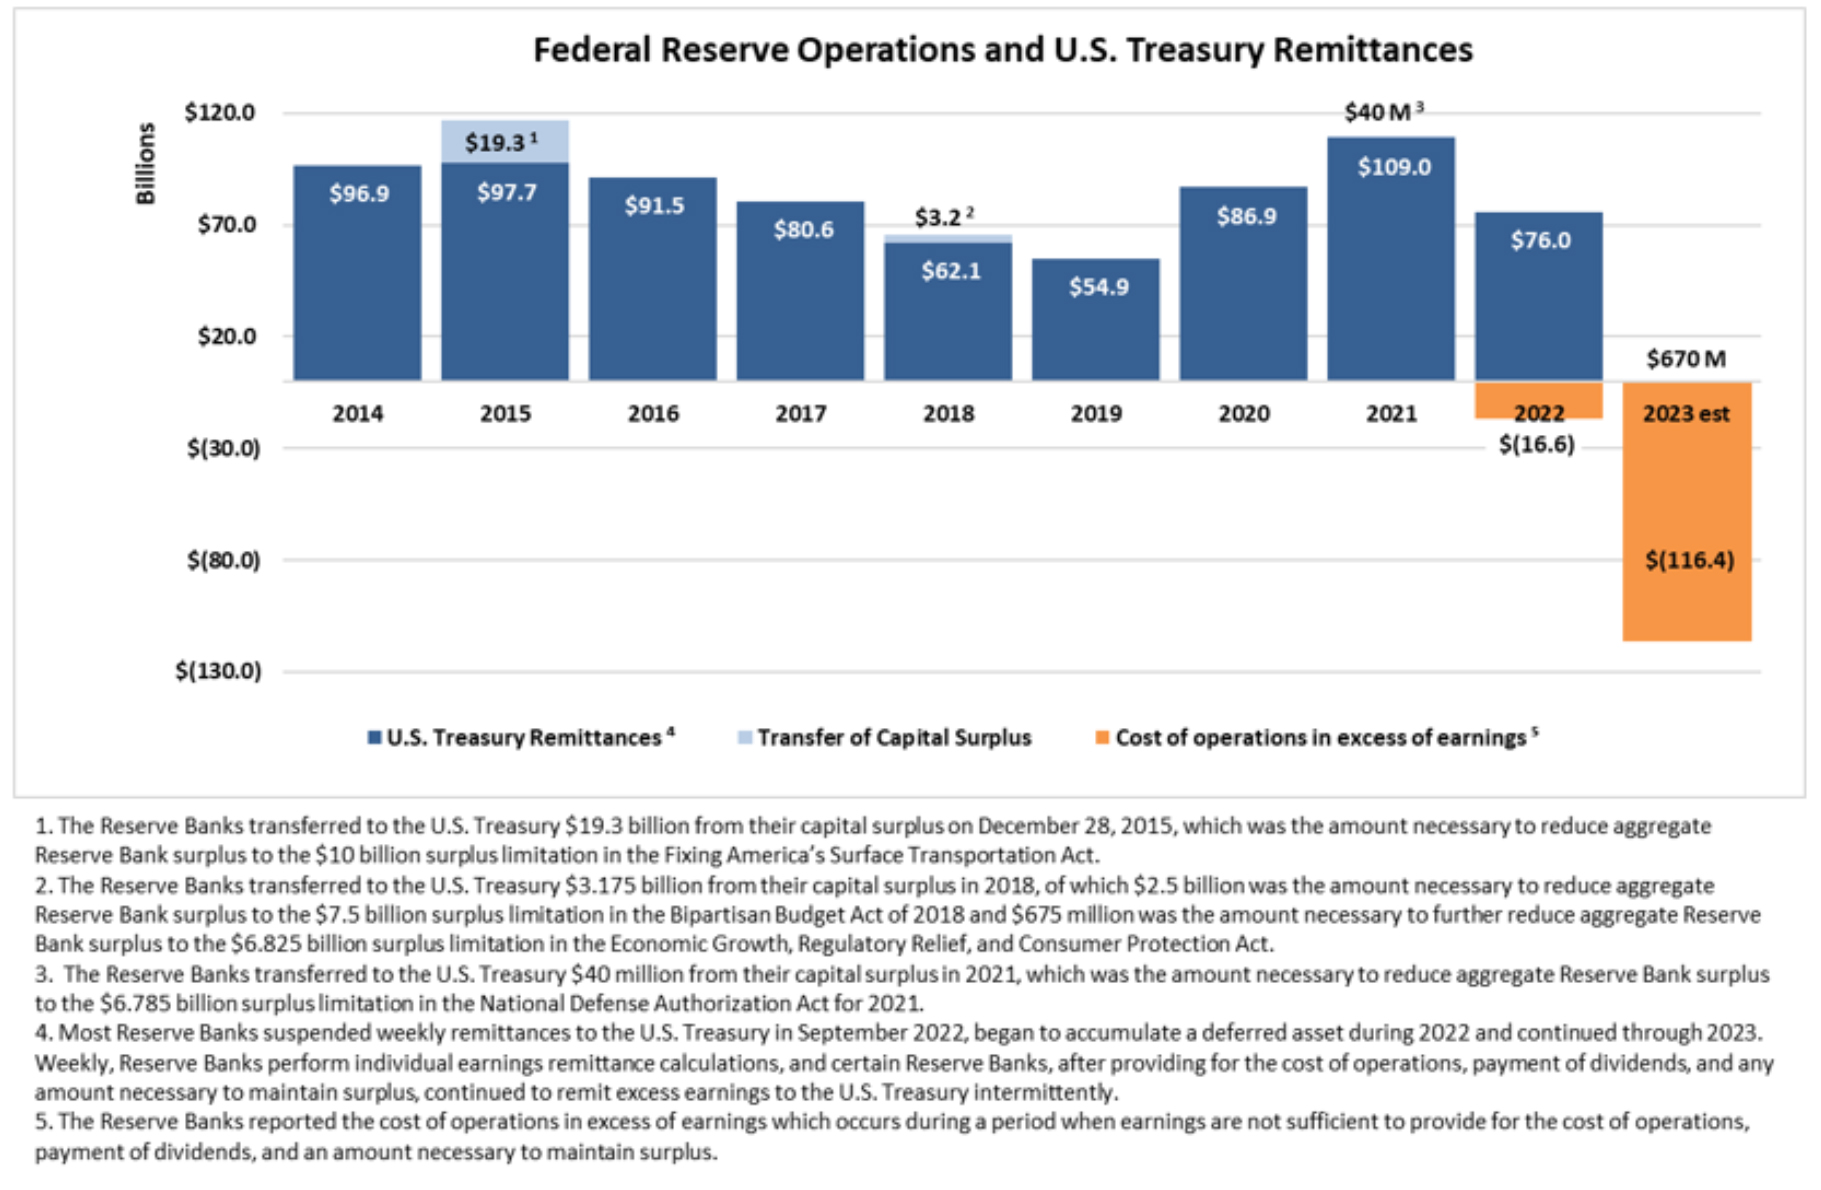
Last Friday, the Fed told the world that it ran an operating loss of $116.4 billion last year, its largest ever and the first this century, a hangover from goosing the economy with $6 trillion to fight COVID (for far too long), then ratcheting up interest rates too far too fast – and too late in the game – pushing the annual federal debt higher in fiscal 2023 and 2024, thereby requiring more debt auctions and higher bond rates.
This chart came out of the Fed’s annual report, released last Friday – “red ink” disguised as orange ink:
Graphs are for illustrative and discussion purposes only. Please read important disclosures at the end of this commentary.
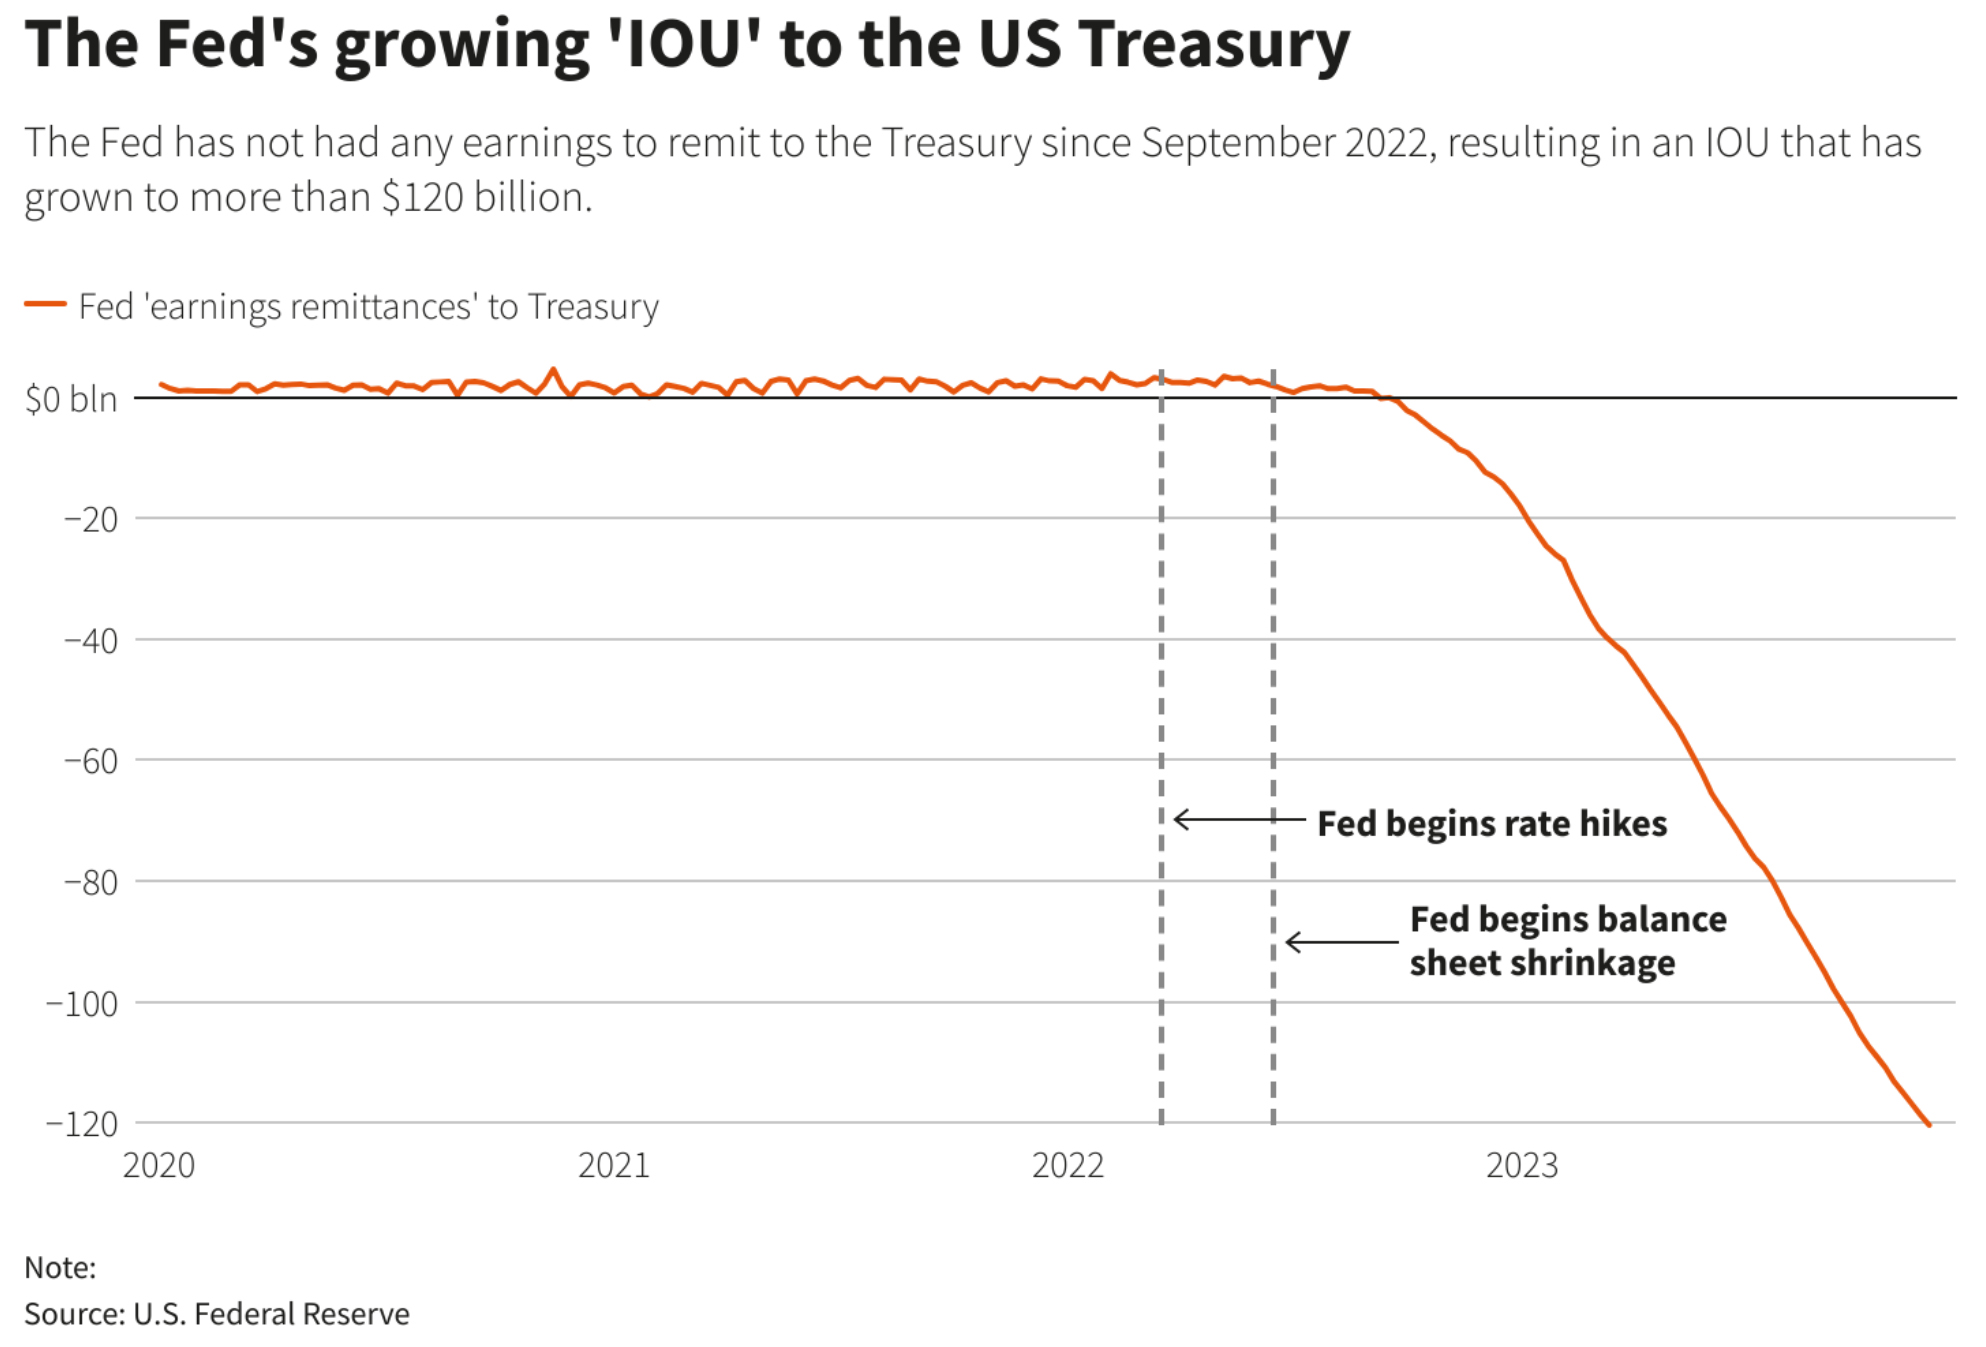
This $116.4 billion loss comes from paying more in interest to financial institutions than they earn from their balance sheet, which they bought when interest rates were lower. Starting in 2022, the Fed created IOUs they call “deferred assets,” which are now becoming losses. To its credit, in the decade before 2021, the Fed was a profit center. Between 2019 and 2021, its Treasury remittances nearly doubled, reaching a record $109 billion in 2021. Then the high interest came due. The Fed is now a big drain on the Treasury.
The Fed will likely continue to run accounting losses for as long as it holds interest rates above 3.5% (vs. the current Fed funds rate of 5.25% to 5.5%), which argues for making 7 or 8 quarter-point rate cuts this year, or even four 50-basis point rate cuts. It’s not beyond the scope of possibility, considering that over 90% of full-time economists at the Fed are Democrats and they wouldn’t mind re-electing the incumbent.
Even though Chairman Jerome Powell seems like a fair-minded fellow and talks a non-political platform, those who vote on the FOMC and those who supply the data have a singular point of view, like a stacked deck. Of 228 Fed economists who claimed Party affiliation, 208 claimed to be Democrats (91.2%).
After all, the last Fed chair (Janet Yellen) was quickly promoted to become President Biden’s Secretary of the Treasury and is now his unapologetic spokesperson, and the most recent Federal Reserve Vice-Chair, Lael Brainerd, became President Biden’s chief economic advisor, so the Fed looks like a one-party club.
How the Fed’s “Dual Mandate” Came into Being – Starting 50 Years Ago
If you think last week’s Consumer Price Index (CPI) was disappointing at 3.4%, consider 50 years ago today, when the Commerce Department reported that the fourth quarter of 1973 delivered the worst quarterly inflation increase since 1951. In the previous week, the U.S. Department of Labor reported that our wholesale price index (now called producer prices) had risen 20.9% for the full year of 1973, from 47.4 to 57.3. In the 1970s (January 1971 to January 1981), the PPI gained over 150%, from 37.3 to 95.2.
In the trivia department, on January 17, 1974, the Nixon administration printed 4.8 billion gas-rationing coupons at a cost of $11 million, plus $11,000 a month storage (they were never used). The next day, an amazing thing happened. About 750 investors “invaded” the Fairmont Hotel in New Orleans in a modern gold rush, in an overflow crowd as the first gold-oriented investment conference opened in New Orleans.
I say these investors “invaded” New Orleans, since sponsor James U. Blanchard III only mailed out 5,000 invitations and got a phenomenal 15% response rate, such a surprising response rate that he said, “we had to frantically change hotels and banquet halls at the last minute. Even then, we could not fit everyone at the same time and had to use closed-circuit video monitors in various adjoining rooms. Imagine getting 750 responses for a $300 price tag, from a mailing list of only 5,000 today…plus air fare and lodging” (quoted from “Confessions of a Gold Bug,” by James U. Blanchard III, 1989, co-authored by yours truly).
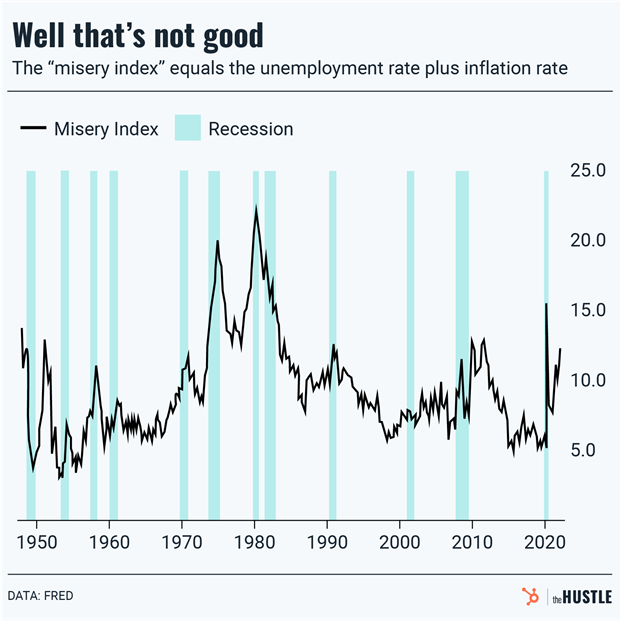
The S&P declined 45% in 1973-74, amid rising inflation, giving birth to the term stagflation, stagnation plus inflation. Previously, the “Phillips curve” assured economists that this was impossible – you either had inflation OR unemployment – you had boom-times (inflation) or bad times (unemployment), but not both at the same time. But in 1973-75 and again, but worse, in 1979-82, we had both at once, giving birth to a new but more earthy math mash called “the misery index” of the inflation rate + the jobless rate:

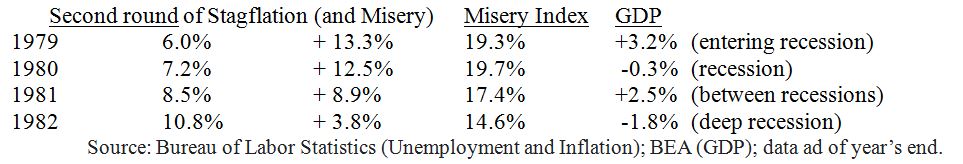
In between those two “miserable” periods of high inflation and high unemployment in 1974-1982, the Federal Reserve Reform Act of 1977 was passed in late 1977, President Carter’s first year. It chartered the Federal Reserve to solve two problems at once – inflation and unemployment. You can see from the table above how poorly they executed their dual mandate in the five years after that “Reform Act” was passed (1978-82), until Paul Volcker used painful high interest rate medicine (up to 20% at one point).
Graphs are for illustrative and discussion purposes only. Please read important disclosures at the end of this commentary.
![]()
According to Investopedia, The Federal Reserve Reform Act of 1977 “explicitly stated the Fed’s goals should be ‘maximum employment, stable prices, and moderate long-term interest rates.’ These goals, which remain today, came to be known as the Fed’s ‘dual mandate.’” Well, pardon me, but that’s a clear listing of three mandates, a dual mandate of jobs and inflation, but also “moderate interest rates.”
It’s interesting that Congress and the press keep referring to the “dual mandate” (jobs and prices), yet they usually concentrate on that third mandate, interest rates: “What will the Fed do in their next FOMC meeting – lower rates, raise them, or leave them the same?” The truth is that the Fed cannot do much about jobs and hiring or firing. They can do a lot about inflation, but they can only “follow the market” when it comes to interest rates. Bond traders and international bond buyers determine long-term rates.
Graphs are for illustrative and discussion purposes only. Please read important disclosures at the end of this commentary.
The lesson from all this is that the Powell Fed didn’t learn the full lesson from the mistakes of the 1970s Feds, chaired by Arthur Burns (1970-78), G. William Miller (1978-79) and then Paul Volcker (1979-87).
Thankfully, Powell doesn’t have to overcome a full decade of entrenched stagflation, as Volcker did, but Powell went too far with his “helicopter money” in 2020-21, then too far with his “transitory” excuse in 2021, then he waited too long to apply the medicine, then applied it too fast, so now he’s paying a price, to the tune of $116.4 billion in 2023, and more to come in 2024. There is no “free lunch” with MMT.
All content above represents the opinion of Gary Alexander of Navellier & Associates, Inc.
Also In This Issue
A Look Ahead by Louis Navellier
Why the Fed Follows the PCE, not the CPI or PPI
Income Mail by Bryan Perry
Bracing For More Volatility Ahead
Growth Mail by Gary Alexander
Why the Fed Lost Over $116 Billion in 2023
Global Mail by Ivan Martchev
U.S. M2 Money Supply is Still Shrinking
Sector Spotlight by Jason Bodner
How Long Can This Market Stay Overbought?
View Full Archive
Read Past Issues Here
About The Author

Gary Alexander
SENIOR EDITOR
Gary Alexander has been Senior Writer at Navellier since 2009. He edits Navellier’s weekly Marketmail and writes a weekly Growth Mail column, in which he uses market history to support the case for growth stocks. For the previous 20 years before joining Navellier, he was Senior Executive Editor at InvestorPlace Media (formerly Phillips Publishing), where he worked with several leading investment analysts, including Louis Navellier (since 1997), helping launch Louis Navellier’s Blue Chip Growth and Global Growth newsletters.
Prior to that, Gary edited Wealth Magazine and Gold Newsletter and wrote various investment research reports for Jefferson Financial in New Orleans in the 1980s. He began his financial newsletter career with KCI Communications in 1980, where he served as consulting editor for Personal Finance newsletter while serving as general manager of KCI’s Alexandria House book division. Before that, he covered the economics beat for news magazines. All content of “Growth Mail” represents the opinion of Gary Alexander
Important Disclosures:
Although information in these reports has been obtained from and is based upon sources that Navellier believes to be reliable, Navellier does not guarantee its accuracy and it may be incomplete or condensed. All opinions and estimates constitute Navellier’s judgment as of the date the report was created and are subject to change without notice. These reports are for informational purposes only and are not a solicitation for the purchase or sale of a security. Any decision to purchase securities mentioned in these reports must take into account existing public information on such securities or any registered prospectus.To the extent permitted by law, neither Navellier & Associates, Inc., nor any of its affiliates, agents, or service providers assumes any liability or responsibility nor owes any duty of care for any consequences of any person acting or refraining to act in reliance on the information contained in this communication or for any decision based on it.
Past performance is no indication of future results. Investment in securities involves significant risk and has the potential for partial or complete loss of funds invested. It should not be assumed that any securities recommendations made by Navellier. in the future will be profitable or equal the performance of securities made in this report. Dividend payments are not guaranteed. The amount of a dividend payment, if any, can vary over time and issuers may reduce dividends paid on securities in the event of a recession or adverse event affecting a specific industry or issuer.
None of the stock information, data, and company information presented herein constitutes a recommendation by Navellier or a solicitation to buy or sell any securities. Any specific securities identified and described do not represent all of the securities purchased, sold, or recommended for advisory clients. The holdings identified do not represent all of the securities purchased, sold, or recommended for advisory clients and the reader should not assume that investments in the securities identified and discussed were or will be profitable.
Information presented is general information that does not take into account your individual circumstances, financial situation, or needs, nor does it present a personalized recommendation to you. Individual stocks presented may not be suitable for every investor. Investment in securities involves significant risk and has the potential for partial or complete loss of funds invested. Investment in fixed income securities has the potential for the investment return and principal value of an investment to fluctuate so that an investor’s holdings, when redeemed, may be worth less than their original cost.
One cannot invest directly in an index. Index is unmanaged and index performance does not reflect deduction of fees, expenses, or taxes. Presentation of Index data does not reflect a belief by Navellier that any stock index constitutes an investment alternative to any Navellier equity strategy or is necessarily comparable to such strategies. Among the most important differences between the Indices and Navellier strategies are that the Navellier equity strategies may (1) incur material management fees, (2) concentrate its investments in relatively few stocks, industries, or sectors, (3) have significantly greater trading activity and related costs, and (4) be significantly more or less volatile than the Indices.
ETF Risk: We may invest in exchange traded funds (“ETFs”) and some of our investment strategies are generally fully invested in ETFs. Like traditional mutual funds, ETFs charge asset-based fees, but they generally do not charge initial sales charges or redemption fees and investors typically pay only customary brokerage fees to buy and sell ETF shares. The fees and costs charged by ETFs held in client accounts will not be deducted from the compensation the client pays Navellier. ETF prices can fluctuate up or down, and a client account could lose money investing in an ETF if the prices of the securities owned by the ETF go down. ETFs are subject to additional risks:
- ETF shares may trade above or below their net asset value;
- An active trading market for an ETF’s shares may not develop or be maintained;
- The value of an ETF may be more volatile than the underlying portfolio of securities the ETF is designed to track;
- The cost of owning shares of the ETF may exceed those a client would incur by directly investing in the underlying securities; and
- Trading of an ETF’s shares may be halted if the listing exchange’s officials deem it appropriate, the shares are delisted from the exchange, or the activation of market-wide “circuit breakers” (which are tied to large decreases in stock prices) halts stock trading generally.
Grader Disclosures: Investment in equity strategies involves substantial risk and has the potential for partial or complete loss of funds invested. The sample portfolio and any accompanying charts are for informational purposes only and are not to be construed as a solicitation to buy or sell any financial instrument and should not be relied upon as the sole factor in an investment making decision. As a matter of normal and important disclosures to you, as a potential investor, please consider the following: The performance presented is not based on any actual securities trading, portfolio, or accounts, and the reported performance of the A, B, C, D, and F portfolios (collectively the “model portfolios”) should be considered mere “paper” or pro forma performance results based on Navellier’s research.
Investors evaluating any of Navellier & Associates, Inc.’s, (or its affiliates’) Investment Products must not use any information presented here, including the performance figures of the model portfolios, in their evaluation of any Navellier Investment Products. Navellier Investment Products include the firm’s mutual funds and managed accounts. The model portfolios, charts, and other information presented do not represent actual funded trades and are not actual funded portfolios. There are material differences between Navellier Investment Products’ portfolios and the model portfolios, research, and performance figures presented here. The model portfolios and the research results (1) may contain stocks or ETFs that are illiquid and difficult to trade; (2) may contain stock or ETF holdings materially different from actual funded Navellier Investment Product portfolios; (3) include the reinvestment of all dividends and other earnings, estimated trading costs, commissions, or management fees; and, (4) may not reflect prices obtained in an actual funded Navellier Investment Product portfolio. For these and other reasons, the reported performances of model portfolios do not reflect the performance results of Navellier’s actually funded and traded Investment Products. In most cases, Navellier’s Investment Products have materially lower performance results than the performances of the model portfolios presented.
This report contains statements that are, or may be considered to be, forward-looking statements. All statements that are not historical facts, including statements about our beliefs or expectations, are “forward-looking statements” within the meaning of The U.S. Private Securities Litigation Reform Act of 1995. These statements may be identified by such forward-looking terminology as “expect,” “estimate,” “plan,” “intend,” “believe,” “anticipate,” “may,” “will,” “should,” “could,” “continue,” “project,” or similar statements or variations of such terms. Our forward-looking statements are based on a series of expectations, assumptions, and projections, are not guarantees of future results or performance, and involve substantial risks and uncertainty as described in Form ADV Part 2A of our filing with the Securities and Exchange Commission (SEC), which is available at www.adviserinfo.sec.gov or by requesting a copy by emailing info@navellier.com. All of our forward-looking statements are as of the date of this report only. We can give no assurance that such expectations or forward-looking statements will prove to be correct. Actual results may differ materially. You are urged to carefully consider all such factors.
FEDERAL TAX ADVICE DISCLAIMER: As required by U.S. Treasury Regulations, you are informed that, to the extent this presentation includes any federal tax advice, the presentation is not written by Navellier to be used, and cannot be used, for the purpose of avoiding federal tax penalties. Navellier does not advise on any income tax requirements or issues. Use of any information presented by Navellier is for general information only and does not represent tax advice either express or implied. You are encouraged to seek professional tax advice for income tax questions and assistance.
IMPORTANT NEWSLETTER DISCLOSURE:The hypothetical performance results for investment newsletters that are authored or edited by Louis Navellier, including Louis Navellier’s Growth Investor, Louis Navellier’s Breakthrough Stocks, Louis Navellier’s Accelerated Profits, and Louis Navellier’s Platinum Club, are not based on any actual securities trading, portfolio, or accounts, and the newsletters’ reported hypothetical performances should be considered mere “paper” or proforma hypothetical performance results and are not actual performance of real world trades. Navellier & Associates, Inc. does not have any relation to or affiliation with the owner of these newsletters. There are material differences between Navellier Investment Products’ portfolios and the InvestorPlace Media, LLC newsletter portfolios authored by Louis Navellier. The InvestorPlace Media, LLC newsletters contain hypothetical performance that do not include transaction costs, advisory fees, or other fees a client might incur if actual investments and trades were being made by an investor. As a result, newsletter performance should not be used to evaluate Navellier Investment services which are separate and different from the newsletters. The owner of the newsletters is InvestorPlace Media, LLC and any questions concerning the newsletters, including any newsletter advertising or hypothetical Newsletter performance claims, (which are calculated solely by Investor Place Media and not Navellier) should be referred to InvestorPlace Media, LLC at (800) 718-8289.
Please note that Navellier & Associates and the Navellier Private Client Group are managed completely independent of the newsletters owned and published by InvestorPlace Media, LLC and written and edited by Louis Navellier, and investment performance of the newsletters should in no way be considered indicative of potential future investment performance for any Navellier & Associates separately managed account portfolio. Potential investors should consult with their financial advisor before investing in any Navellier Investment Product.
Navellier claims compliance with Global Investment Performance Standards (GIPS). To receive a complete list and descriptions of Navellier’s composites and/or a presentation that adheres to the GIPS standards, please contact Navellier or click here. It should not be assumed that any securities recommendations made by Navellier & Associates, Inc. in the future will be profitable or equal the performance of securities made in this report.
FactSet Disclosure: Navellier does not independently calculate the statistical information included in the attached report. The calculation and the information are provided by FactSet, a company not related to Navellier. Although information contained in the report has been obtained from FactSet and is based on sources Navellier believes to be reliable, Navellier does not guarantee its accuracy, and it may be incomplete or condensed. The report and the related FactSet sourced information are provided on an “as is” basis. The user assumes the entire risk of any use made of this information. Investors should consider the report as only a single factor in making their investment decision. The report is for informational purposes only and is not intended as an offer or solicitation for the purchase or sale of a security. FactSet sourced information is the exclusive property of FactSet. Without prior written permission of FactSet, this information may not be reproduced, disseminated or used to create any financial products. All indices are unmanaged and performance of the indices include reinvestment of dividends and interest income, unless otherwise noted, are not illustrative of any particular investment and an investment cannot be made in any index. Past performance is no guarantee of future results.