Welcome to our Navellier Graders
Click on the grader you wish to use.
Stock Grader
What do the grades mean?
Our Stock Grader utilizes key fundamental metrics and weights them in an average to determine a grade of A to F. “A” being our highest ranking persistence model which, as a group, tends to outperform the low persistence stocks, as well as the market in general. The final grade a stock receives (“Total Stock Grade”) is based on its Navellier Proprietary Quantitative Grade and its Overall Fundamental Grade. Only those stocks that received both a top Quantitative Grade and a top Overall Fundamental Grade receive an “A”.
Why Stocks?
Stocks can provide some of the safest earning potential in this volatile market.
How often is the data updated?
The stock data is updated weekly.
Navellier Stock Grader Growth of $100 Example
Net February 1, 1998 to December 31, 2018
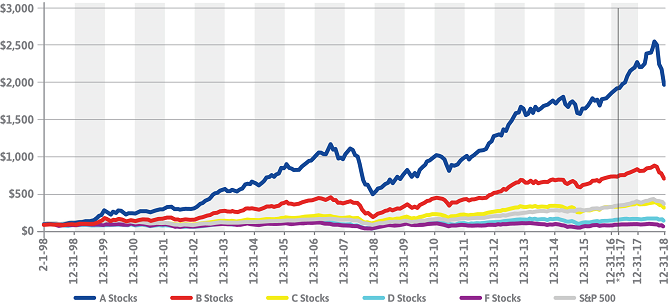
(*Updated and corrected 3-31-17 through present.)
The chart above reflects the theoretical historical total return of stocks assigned a letter rank of A, B, C, D and F using a combination of the proprietary Navellier Stock Grader Fundamental grade and Navellier Stock Grader Quantitative grade. Performance results presented herein do not necessarily indicate future performance. The net performance results portrayed include the reinvestment of all dividends and other earnings. Net results also include our estimation of investment advisory fees, administrative fees, transaction expenses, or other expenses that a client would have paid or actually paid. A 3.00% annualized advisory fee is built into the net return calculations although that fee is higher than any actual advisory fee currently clients are paying to Navellier & Associates, Inc. for investment advisory services. Investment in equity strategies involves substantial risk and has the potential for partial or complete loss of funds invested. Graphs are for illustrative and discussion purposes only. (Note, these are model results, no actual money was invested. Please see important disclosures below.)
Try out our Stock Grader (returning users also) – Click Here
ETF Grader
What do the grades mean?
The Navellier ETF grades are based on return/risk characteristics, of each individual ETF, ranked relative to its best fitting (highest R2) broad based Index. Each week we compile and calculate statistics, Alpha, Beta, Standard Deviation, R-Squared for a list of over 1500 ETFs. Using the respective 60 or 90 day cycle we calculate how an ETF has performed on a risk adjusted basis relative to its best fit broad market index.
The final grade for each ETF is based on its risk adjusted performance relative to the Russell 3000 index constituents. An “A” Grade is assigned to ETFs that exhibit positive return/risk characteristics over the given cycle and an “F” Grade represents ETFs that have exhibited lesser/negative return/risk characteristics. These rankings can/will change weekly depending on market conditions and volatility.
Why ETFs?
Exchange traded funds are generally structured to hold a basket of securities and usually offer investors the ability to not only buy and hold an ETF position but also trade in and out of a position intra-day.
How often is the data updated?
The ETF data is updated weekly.
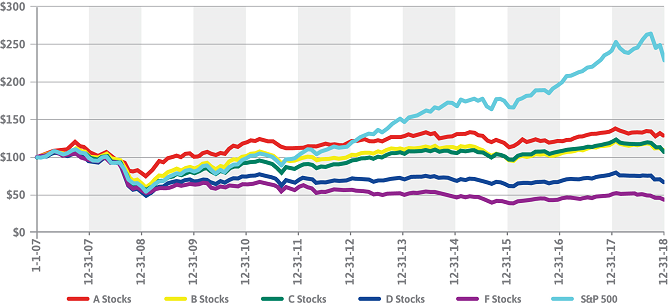
Navellier ETF Grader Growth of $100 Example
Net January 1, 2007 December 31, 2018
Net March 1, 2006 to December 31, 2018

The chart above reflects the theoretical historical total return of stocks assigned a score of A, B, C, D, or F using key fundamental metrics. Performance results presented herein do not necessarily indicate future performance. Results presented include the reinvestment of all dividends and other earnings. Investment in equity strategies involves substantial risk and has the potential for partial or complete loss of funds invested. Graphs are for illustrative and discussion purposes only. This graph is not to be construed as an offer to buy or sell any financial instrument and should not be relied upon as the sole factor in an investment making decision. (Note, these are model results, no actual money was invested. Please see important disclosures below.)
Dividend Grader
What do the grades mean?
Our NEW Dividend Grader utilizes key fundamental metrics and weights them in an average to determine a grade of A to F. A being our highest ranking dividend persistence model which, as a group, tends to outperform the low persistence stocks, as well as the market in general. This grading system replaces the previous system where stocks were graded on a scale of 1 to 3.
Why Dividends?
Exchange traded funds are generally structured to hold a basket of securities and usually offer investors the ability to not only buy and hold an ETF position but also trade in and out of a position intra-day.
How often is the data updated?
The dividend data is updated weekly.
Navellier Dividend Grader Growth of $100 Example
Net January 1, 2003 to December 31, 2018
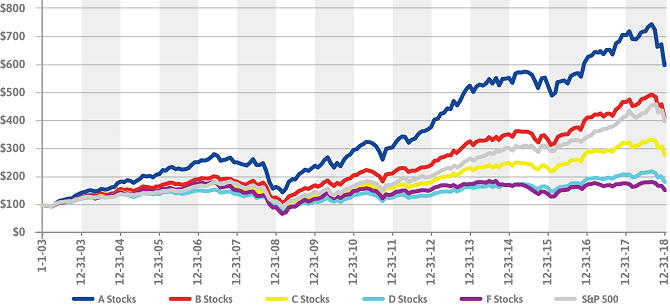
The chart above reflects the theoretical historical total return of stocks assigned a grade of A, B, C, D or F using key fundamental metrics. Performance results presented herein do not necessarily indicate future performance. The net performance results portrayed include the reinvestment of all dividends and other earnings. Net results also include our estimation of investment advisory fees, administrative fees, transaction expenses, or other expenses that a client would have paid or actually paid. A 3.00% annualized advisory fee is built into the net return calculations although that fee is higher than any actual advisory fee currently clients are paying to Navellier & Associates, Inc. for investment advisory services. Investment in equity strategies involves substantial risk and has the potential for partial or complete loss of funds invested. Graphs are for illustrative and discussion purposes only. This graph is not to be construed as an offer to buy or sell any financial instrument and should not be relied upon as the sole factor in an investment making decision. (Note, these are model results, no actual money was invested. Please see important disclosures below.)