
by Jason Bodner
November 10, 2026
For centuries, sailors told of giant waves rising from calm seas. Scientists dismissed these “rogue waves” as myths. Then, on January 1, 1995, instruments on an oil rig logged an 84-foot wave.
Yes, “rogue waves” really happen and are real, but they remain rare enough to escape easy detection.
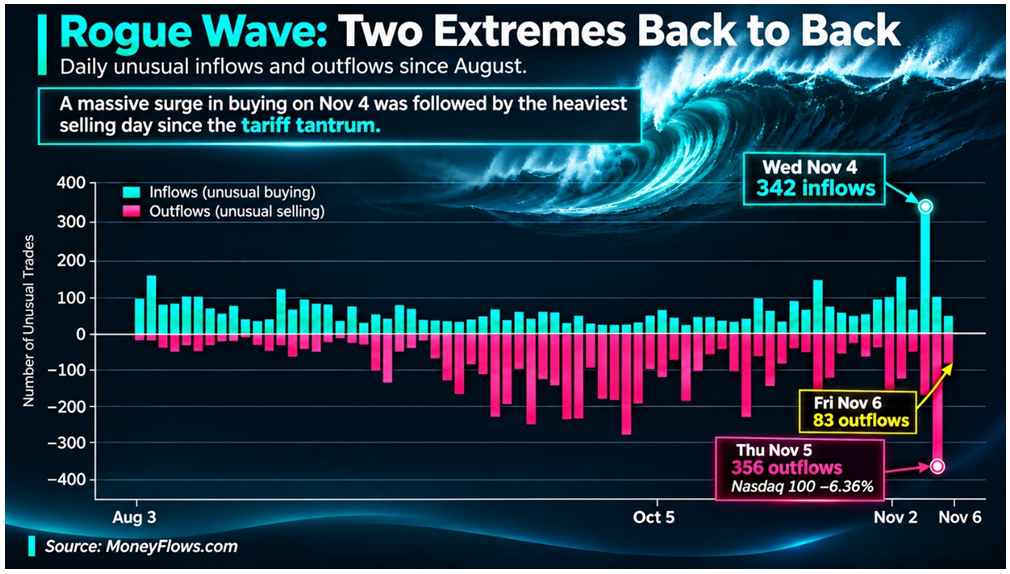
Last week, we saw this kind of rogue wave in the markets. After the midterms, Wednesday brought 342 unusual inflows, ranking as the 17th strongest trading day among the 9,200-trading days we’ve tracked since 1990. That puts it in the top 0.2%. Then, on Thursday, the NASDAQ 100 plunged 6.4% as we logged 356 outflows. In 36-years, we’ve never seen such extreme opposite days, back-to-back, and by volume, this was the fourth heaviest two-day stretch in our data bank. Only the April 2025 tariff crash was bigger.
Graphs are for illustrative and discussion purposes only. Please read important disclosures at the end of this commentary.
Headlines give us plenty of explanations – after the fact. A lawmaker called for an AI pause. Texas elected a governor seeking data-center restrictions. One big technology company missed its earnings target, and another reportedly soured on neoclouds. Hedge funds were blowing up. Margin debt hit a record high.
Pick your favorite headline (or two) if you want to assign blame for last Thursday’s massive reversal.
Here’s what I think really happened…
Looking at the money flows, this was a classic case of forced selling. Goldman Sachs estimates technology-focused hedge funds lost over 4% on Thursday, erasing a year that was up 24% in June. Funds de-risked before the election, then chased Wednesday’s rally, then dumped stocks on Thursday. Walleye Capital is returning $2 billion to investors and slashed its stock-picking team. Engineers Gate gutted its fundamental equity group. Leveraged ETFs had to rebalance, selling tens of billions in stock, mostly technology stocks.
I’ve seen this before, firsthand. During the 2008 financial crisis, I ran North American Equity Derivatives at a major Wall Street firm. I oversaw the liquidation of a major Wall Street firm’s massive options book, worth billions in notional value. The order came from the top: “Sell everything.” Options normally just a penny wide were suddenly trading 10 to 20-times wider. Buyers vanished, just like the Jeremy Irons character said in the film, Margin Call: “Sell everything, at whatever price the market gives you.”
That’s what I call “forced selling.” Prices stop measuring value and start reflecting desperation.
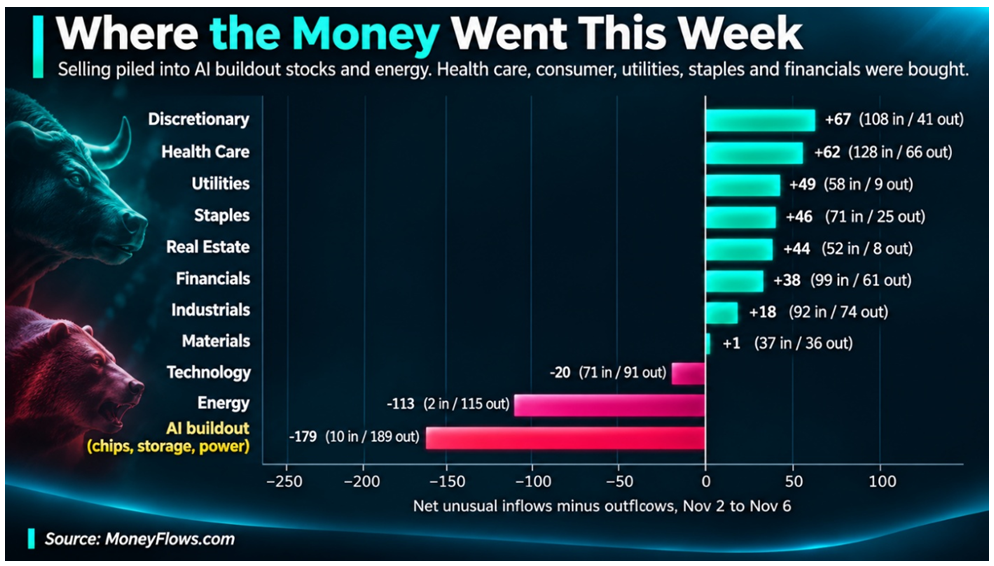
Our data charted last week’s violence. AI buildout stocks, from chips to storage to power, saw 189 outflows against just 10 inflows this week. Meanwhile, health care, consumer, utilities, staples, real estate, and financials were net bought. Money didn’t leave the market. It fled a crowded corner.
Graphs are for illustrative and discussion purposes only. Please read important disclosures at the end of this commentary.
What happens next? Near term is unclear, but flows are a roadmap, and Friday brought encouraging signs.
- Selling dried up. Outflows plunged from 356 on Thursday to 83 on Friday. Chip stock outflows went from 51 to just one.
- Breadth improved. Stocks near their 55-day lows dropped from 36% to 25% in one day.
- Our Big Money Index (BMI) kept rising, reaching 43% last week. With a built-in 25-day moving average, the BMI is shedding October’s heavy selling days. Even with relentless selling last Thursday, it can’t return to oversold before late November. Historically, when the BMI rises as markets plunge, the lows arrive quickly, usually inside of two-weeks.
- The final test will be a retest. If prices revisit Thursday’s lows on lighter selling, forced sellers may be finished. Another shakeout is possible, but most of the damage appears done.
Now let’s zoom out. That’s where the situation brightens.
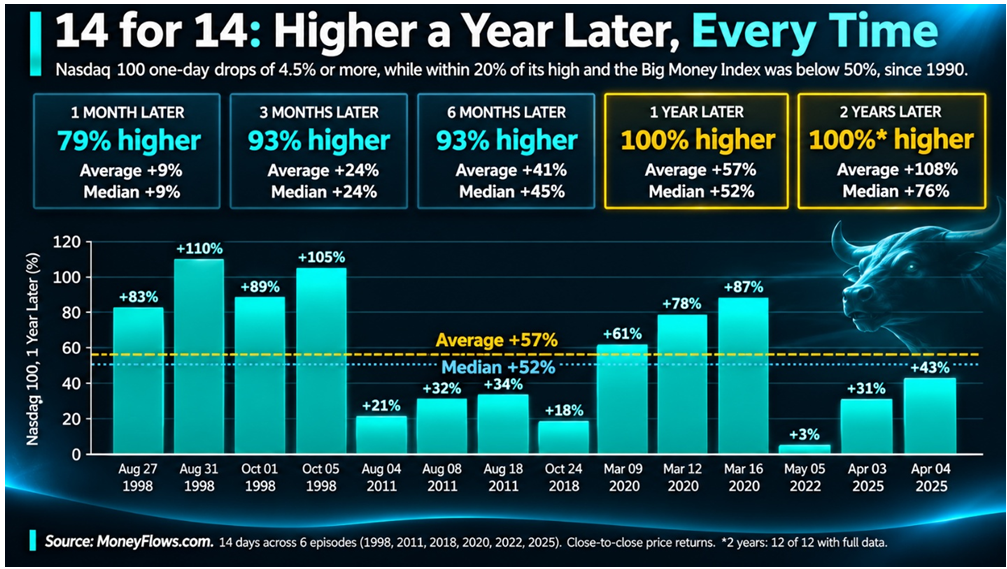
Since 1990, the NASDAQ 100 has plunged by 4.5% or more in a day 14-times while within 20% of its high and with our BMI below 50%. One-year later, it was higher all 14-times, averaging a stunning 57% gain.
Thursday became #15.
Graphs are for illustrative and discussion purposes only. Please read important disclosures at the end of this commentary.
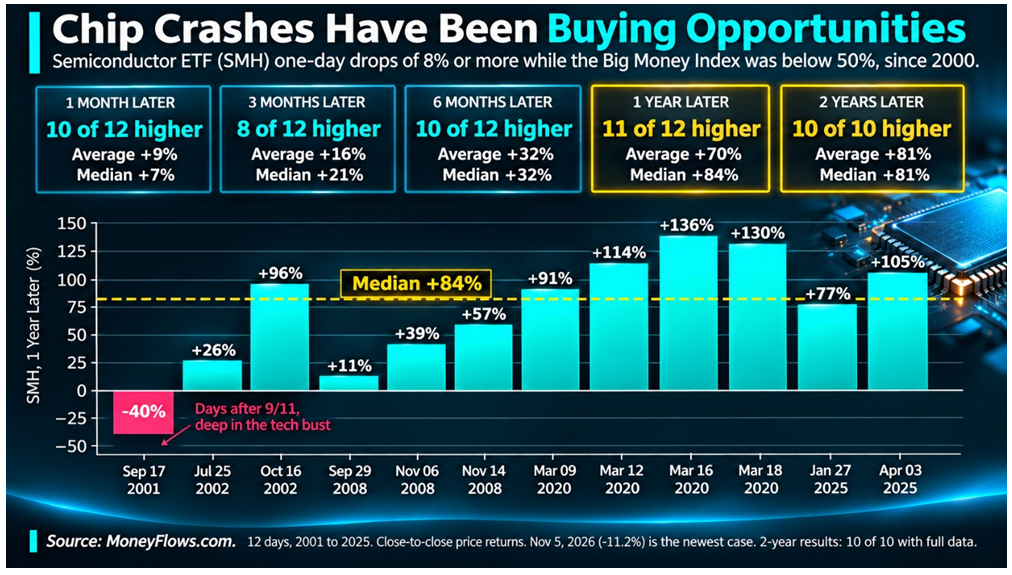
Chips are hurting, so let’s look there next. Thursday, the largest semiconductor ETF plunged 11.2%, its second worst day since 2000. Since then, it fell 8% or more in a day 12-times with our BMI below 50%.
A year later, it was higher 11 of 12-times, with an outstanding median gain of 84%. The sole miss came in the days after 9/11, 2001, but that was followed by 11-consecutive increases:
Graphs are for illustrative and discussion purposes only. Please read important disclosures at the end of this commentary.
And don’t forget, this is not a bear market, and we are nowhere close to a recession. Those past reversals in chips came with falling profits, stretched valuations, or a Fed slamming on the brakes. By contrast:
- S&P 500 earnings are growing 30% and sales 13%, more than double their 10-year averages.
- Stocks trade below their average valuation.
- October added 165,000 jobs, and productivity rose 3.6%.
- Among AI chip stocks, 76% have seen earnings estimates rise this month.
- Bank of America says $140 billion flowed into cash funds in one week.
That’s fuel for growth, not a widespread retreat:
Now, what about the AI threat? Let’s take the worst case. Suppose lawmakers halt every new data center. Projects already underway still need chips, memory, storage and optics, so let’s imagine AI adoption stops tomorrow… no new frontier models. Ridiculous, but let’s consider it. AI agents change the math. Instead of answering one question, agents execute dozens of steps. Gartner estimates agentic tasks require five to 30-times more computing than a chatbot exchange. If existing users add just one or two agents, the compute demand compounds without any new users. That strains already stretched capacity.
Politics won’t stop, either. According to Elon Musk, Texas’s governor-elect says permitted data-centers can finish. New projects face rules on taxes, electricity, water, and labor. Companies can navigate those. States that push data-centers away simply hand jobs and tax revenue to their neighbors.
History is on our side. Since 1950, the S&P 500 has risen in the year after all 19 midterm elections. Technology has done better. Since 1990, the NASDAQ 100 has beaten the S&P 500 every year following midterms.
And next year is the pre-election year, historically the strongest of the four-year cycle. Since 1950, the S&P 500 has failed to grow just twice, 2011 and 2015 – one year was flat, the other fell by less than 1%.
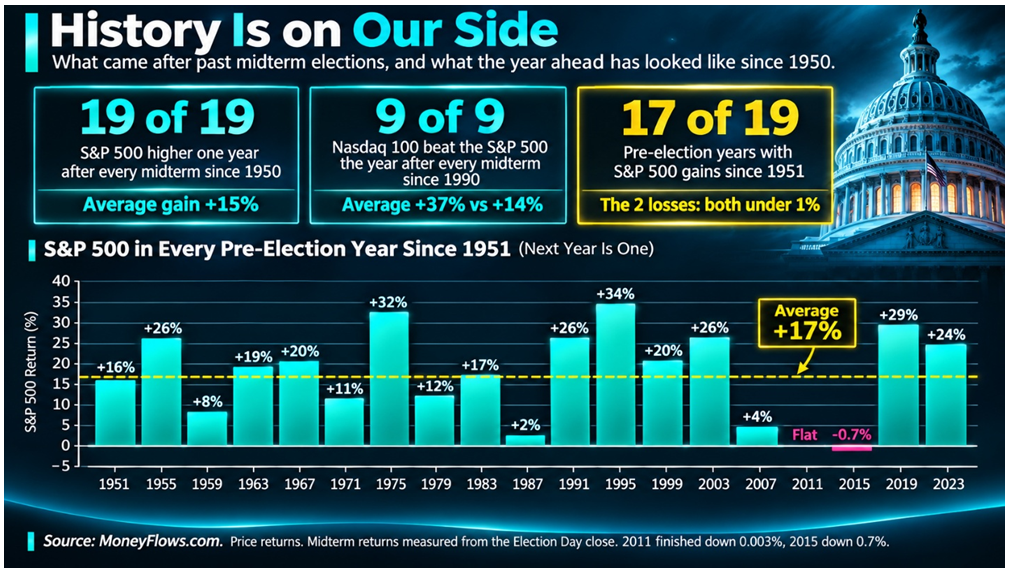
Graphs are for illustrative and discussion purposes only. Please read important disclosures at the end of this commentary.
Our flows tell the same story. In mid-October, our Big Money Index sank to 22.9%, deep in oversold territory, where institutional selling is heaviest. On October 20, it climbed out of oversold conditions. That’s happened 23 other times since 1990. A year later, the NASDAQ 100 was higher 19-times.
This rebound in the BMI was fast. The BMI surged 15-points in three-weeks from below 30%. Historically, the NASDAQ 100 was higher a year later over 80% of the time, with a median gain of 28%.
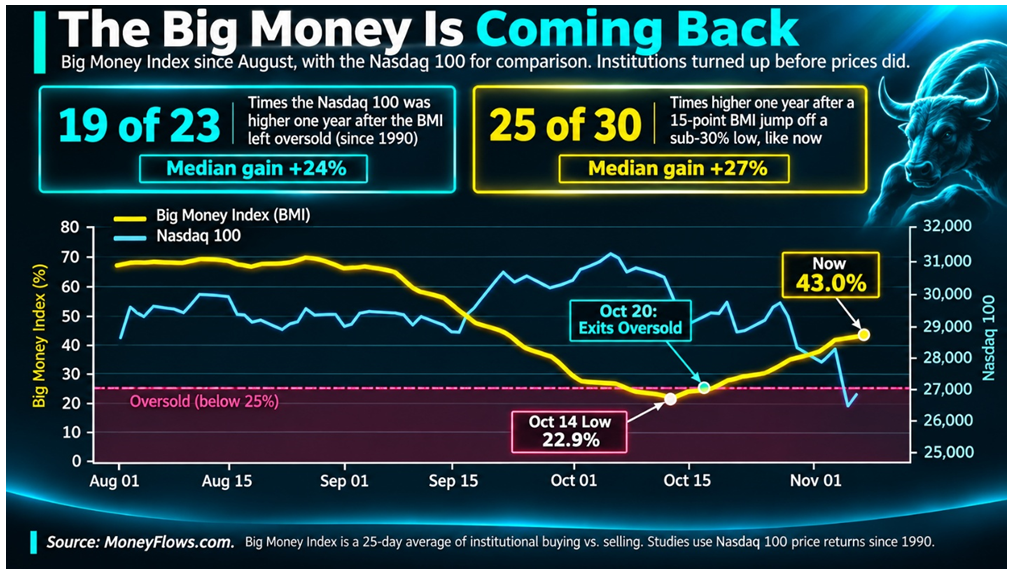
Graphs are for illustrative and discussion purposes only. Please read important disclosures at the end of this commentary.
Margin debt is another worry. It hit a record $1.5 trillion in June, and that leverage needs unwinding. But we saw a test run. In July, margin debt plunged by a record $85 billion. The S&P 500 shrugged it off, hitting a new high in October. Flushing leverage isn’t the end of a bull market. It’s routine maintenance.
The near-term may be choppy. Flows will say when the coast is clear. But forced sellers are running out of ammunition, earnings are growing twice as fast as usual, and AI demand keeps compounding.
History favors patient investors.
“The pessimist complains about the wind; the optimist expects it to change; the realist adjusts the sails.”
–William Arthur Ward
All content above represents the opinion of Jason Bodner of Navellier & Associates, Inc.
Also In This Issue
A Look Ahead by Louis Navellier
Great Earnings Will Keep Fueling Market (and Economic) Growth
Income Mail by Bryan Perry
Bipartisan Investment Themes For 2027
Growth Mail by Gary Alexander
Food for Thought (and Action) on Veteran’s Day
Global Mail by Ivan Martchev
On Market Moves and Political Repercussions
Sector Spotlight by Jason Bodner
How to Ride the Market’s Rare but Powerful Rogue Waves
Important Disclosures:
Jason Bodner is a co-founder and co-owner of Mapsignals. Mr. Bodner is an independent contractor who is occasionally hired by Navellier & Associates to write an article and or provide opinions for possible use in articles that appear in Navellier & Associates weekly Market Mail. Mr. Bodner is not employed or affiliated with Louis Navellier, Navellier & Associates, Inc., or any other Navellier owned entity. The opinions and statements made here are those of Mr. Bodner and not necessarily those of any other persons or entities. This is not an endorsement, or solicitation or testimonial or investment advice regarding the BMI Index or any statements or recommendations or analysis in the article or the BMI Index or Mapsignals or its products or strategies.
Although information in these reports has been obtained from and is based upon sources that Navellier believes to be reliable, Navellier does not guarantee its accuracy and it may be incomplete or condensed. All opinions and estimates constitute Navellier’s judgment as of the date the report was created and are subject to change without notice. These reports are for informational purposes only and are not a solicitation for the purchase or sale of a security. Any decision to purchase securities mentioned in these reports must take into account existing public information on such securities or any registered prospectus.To the extent permitted by law, neither Navellier & Associates, Inc., nor any of its affiliates, agents, or service providers assumes any liability or responsibility nor owes any duty of care for any consequences of any person acting or refraining to act in reliance on the information contained in this communication or for any decision based on it.
Past performance is no indication of future results. Investment in securities involves significant risk and has the potential for partial or complete loss of funds invested. It should not be assumed that any securities recommendations made by Navellier. in the future will be profitable or equal the performance of securities made in this report. Dividend payments are not guaranteed. The amount of a dividend payment, if any, can vary over time and issuers may reduce dividends paid on securities in the event of a recession or adverse event affecting a specific industry or issuer.
None of the stock information, data, and company information presented herein constitutes a recommendation by Navellier or a solicitation to buy or sell any securities. Any specific securities identified and described do not represent all of the securities purchased, sold, or recommended for advisory clients. The holdings identified do not represent all of the securities purchased, sold, or recommended for advisory clients and the reader should not assume that investments in the securities identified and discussed were or will be profitable.
Information presented is general information that does not take into account your individual circumstances, financial situation, or needs, nor does it present a personalized recommendation to you. Individual stocks presented may not be suitable for every investor. Investment in securities involves significant risk and has the potential for partial or complete loss of funds invested. Investment in fixed income securities has the potential for the investment return and principal value of an investment to fluctuate so that an investor’s holdings, when redeemed, may be worth less than their original cost.
One cannot invest directly in an index. Index is unmanaged and index performance does not reflect deduction of fees, expenses, or taxes. Presentation of Index data does not reflect a belief by Navellier that any stock index constitutes an investment alternative to any Navellier equity strategy or is necessarily comparable to such strategies. Among the most important differences between the Indices and Navellier strategies are that the Navellier equity strategies may (1) incur material management fees, (2) concentrate its investments in relatively few stocks, industries, or sectors, (3) have significantly greater trading activity and related costs, and (4) be significantly more or less volatile than the Indices.
ETF Risk: We may invest in exchange traded funds (“ETFs”) and some of our investment strategies are generally fully invested in ETFs. Like traditional mutual funds, ETFs charge asset-based fees, but they generally do not charge initial sales charges or redemption fees and investors typically pay only customary brokerage fees to buy and sell ETF shares. The fees and costs charged by ETFs held in client accounts will not be deducted from the compensation the client pays Navellier. ETF prices can fluctuate up or down, and a client account could lose money investing in an ETF if the prices of the securities owned by the ETF go down. ETFs are subject to additional risks:
- ETF shares may trade above or below their net asset value;
- An active trading market for an ETF’s shares may not develop or be maintained;
- The value of an ETF may be more volatile than the underlying portfolio of securities the ETF is designed to track;
- The cost of owning shares of the ETF may exceed those a client would incur by directly investing in the underlying securities and;
- Trading of an ETF’s shares may be halted if the listing exchange’s officials deem it appropriate, the shares are delisted from the exchange, or the activation of market-wide “circuit breakers” (which are tied to large decreases in stock prices) halts stock trading generally.
Grader Disclosures: Investment in equity strategies involves substantial risk and has the potential for partial or complete loss of funds invested. The sample portfolio and any accompanying charts are for informational purposes only and are not to be construed as a solicitation to buy or sell any financial instrument and should not be relied upon as the sole factor in an investment making decision. As a matter of normal and important disclosures to you, as a potential investor, please consider the following: The performance presented is not based on any actual securities trading, portfolio, or accounts, and the reported performance of the A, B, C, D, and F portfolios (collectively the “model portfolios”) should be considered mere “paper” or pro forma performance results based on Navellier’s research.
Investors evaluating any of Navellier & Associates, Inc.’s, (or its affiliates’) Investment Products must not use any information presented here, including the performance figures of the model portfolios, in their evaluation of any Navellier Investment Products. Navellier Investment Products include the firm’s mutual funds and managed accounts. The model portfolios, charts, and other information presented do not represent actual funded trades and are not actual funded portfolios. There are material differences between Navellier Investment Products’ portfolios and the model portfolios, research, and performance figures presented here. The model portfolios and the research results (1) may contain stocks or ETFs that are illiquid and difficult to trade; (2) may contain stock or ETF holdings materially different from actual funded Navellier Investment Product portfolios; (3) include the reinvestment of all dividends and other earnings, estimated trading costs, commissions, or management fees; and, (4) may not reflect prices obtained in an actual funded Navellier Investment Product portfolio. For these and other reasons, the reported performances of model portfolios do not reflect the performance results of Navellier’s actually funded and traded Investment Products. In most cases, Navellier’s Investment Products have materially lower performance results than the performances of the model portfolios presented.
This report contains statements that are, or may be considered to be, forward-looking statements. All statements that are not historical facts, including statements about our beliefs or expectations, are “forward-looking statements” within the meaning of The U.S. Private Securities Litigation Reform Act of 1995. These statements may be identified by such forward-looking terminology as “expect,” “estimate,” “plan,” “intend,” “believe,” “anticipate,” “may,” “will,” “should,” “could,” “continue,” “project,” or similar statements or variations of such terms. Our forward-looking statements are based on a series of expectations, assumptions, and projections, are not guarantees of future results or performance, and involve substantial risks and uncertainty as described in Form ADV Part 2A of our filing with the Securities and Exchange Commission (SEC), which is available at www.adviserinfo.sec.gov or by requesting a copy by emailing info@navellier.com. All of our forward-looking statements are as of the date of this report only. We can give no assurance that such expectations or forward-looking statements will prove to be correct. Actual results may differ materially. You are urged to carefully consider all such factors.
FEDERAL TAX ADVICE DISCLAIMER: As required by U.S. Treasury Regulations, you are informed that, to the extent this presentation includes any federal tax advice, the presentation is not written by Navellier to be used, and cannot be used, for the purpose of avoiding federal tax penalties. Navellier does not advise on any income tax requirements or issues. Use of any information presented by Navellier is for general information only and does not represent tax advice either express or implied. You are encouraged to seek professional tax advice for income tax questions and assistance.
IMPORTANT NEWSLETTER DISCLOSURE:The hypothetical performance results for investment newsletters that are authored or edited by Louis Navellier, including Louis Navellier’s Growth Investor, Louis Navellier’s Breakthrough Stocks, Louis Navellier’s Accelerated Profits, and Louis Navellier’s Platinum Club, are not based on any actual securities trading, portfolio, or accounts, and the newsletters’ reported hypothetical performances should be considered mere “paper” or proforma hypothetical performance results and are not actual performance of real world trades. Navellier & Associates, Inc. does not have any relation to or affiliation with the owner of these newsletters. There are material differences between Navellier Investment Products’ portfolios and the InvestorPlace Media, LLC newsletter portfolios authored by Louis Navellier. The InvestorPlace Media, LLC newsletters contain hypothetical performance that do not include transaction costs, advisory fees, or other fees a client might incur if actual investments and trades were being made by an investor. As a result, newsletter performance should not be used to evaluate Navellier Investment services which are separate and different from the newsletters. The owner of the newsletters is InvestorPlace Media, LLC and any questions concerning the newsletters, including any newsletter advertising or hypothetical Newsletter performance claims, (which are calculated solely by Investor Place Media and not Navellier) should be referred to InvestorPlace Media, LLC at (800) 718-8289.
Please note that Navellier & Associates and the Navellier Private Client Group are managed completely independent of the newsletters owned and published by InvestorPlace Media, LLC and written and edited by Louis Navellier, and investment performance of the newsletters should in no way be considered indicative of potential future investment performance for any Navellier & Associates separately managed account portfolio. Potential investors should consult with their financial advisor before investing in any Navellier Investment Product.
Navellier claims compliance with Global Investment Performance Standards (GIPS). To receive a complete list and descriptions of Navellier’s composites and/or a presentation that adheres to the GIPS standards, please contact Navellier or click here. It should not be assumed that any securities recommendations made by Navellier & Associates, Inc. in the future will be profitable or equal the performance of securities made in this report.
FactSet Disclosure: Navellier does not independently calculate the statistical information included in the attached report. The calculation and the information are provided by FactSet, a company not related to Navellier. Although information contained in the report has been obtained from FactSet and is based on sources Navellier believes to be reliable, Navellier does not guarantee its accuracy, and it may be incomplete or condensed. The report and the related FactSet sourced information are provided on an “as is” basis. The user assumes the entire risk of any use made of this information. Investors should consider the report as only a single factor in making their investment decision. The report is for informational purposes only and is not intended as an offer or solicitation for the purchase or sale of a security. FactSet sourced information is the exclusive property of FactSet. Without prior written permission of FactSet, this information may not be reproduced, disseminated or used to create any financial products. All indices are unmanaged and performance of the indices include reinvestment of dividends and interest income, unless otherwise noted, are not illustrative of any particular investment and an investment cannot be made in any index. Past performance is no guarantee of future results.