
by Ivan Martchev
October 6, 2026
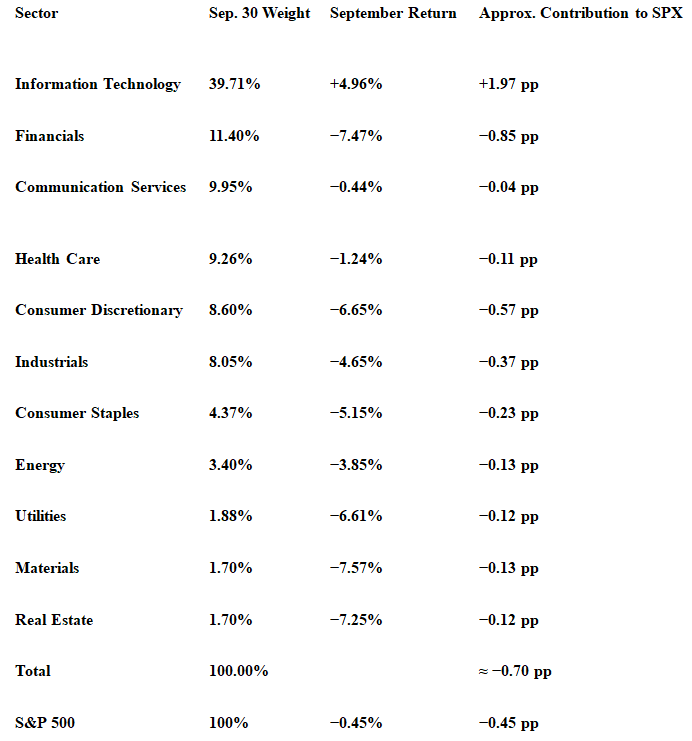
For the month of September, rounding the numbers, the S&P 500 was down 0.4%, which most people would call more or less “flat,” but digging under the surface a different picture emerges. Every sector in the index other than tech was down for the month, in some cases dramatically so, while the tech sector was solidly up, so September lived up to its terrible seasonality, but not for the technology stock sector.
Source: ChatGPT, Gemini
Graphs are for illustrative and discussion purposes only. Please read important disclosures at the end of this commentary.
If you calculate the return for the S&P 500 Equal Weight Index, the same index but with every stock equally weighted rather than by market cap, that index is down 4.8%, representing a truer market profile.
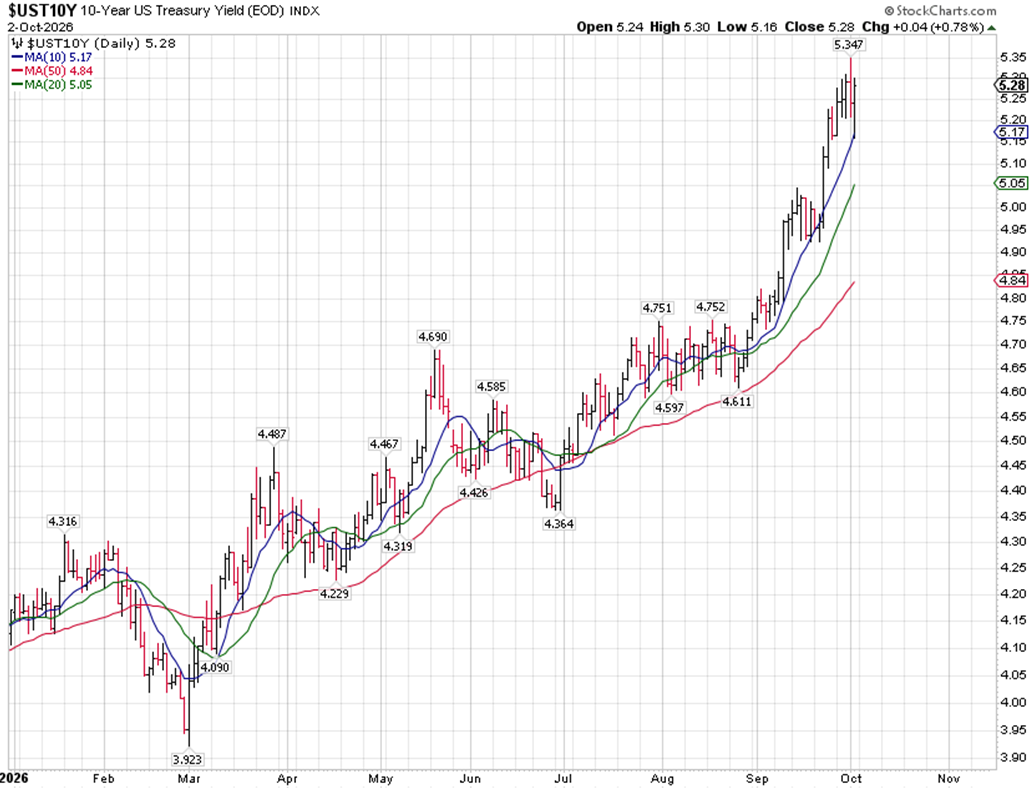
The reason for this friction is the Treasury market, which saw the 10-year note reach a few ticks below 5.35% last week. As dramatic as the recovery in the bond market was on Thursday, seeing yields drop about 14 basis points from their high, they rose about the same on Friday after the weak jobs report.
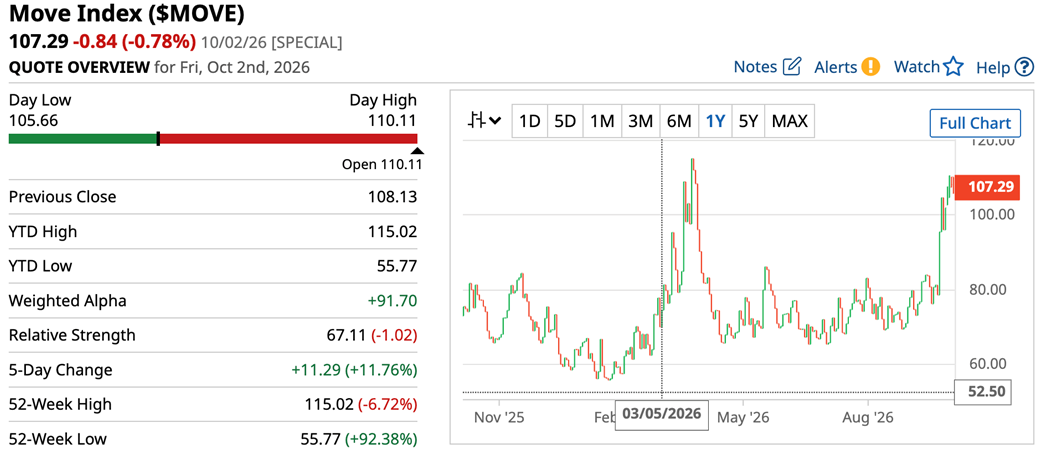
To make the comparison easier to understand, this is roughly equivalent to the Dow Industrials rising 1000 points one day and declining 1000 points the next day, using intraday lows. The real drama is playing out in Treasury futures and is spilling over into sectoral collision within the S&P 500 Index.
Graphs are for illustrative and discussion purposes only. Please read important disclosures at the end of this commentary.
I have shown this MOVE Index for bonds here before. In the simplest possible terms, it can be described as the “bond VIX.” MOVE and VIX are not calculated the same way, and they measure different markets, but MOVE is a gauge of bond volatility. MOVE and the VIX can diverge dramatically when bonds are more volatile and stocks less so, like now, but it is possible to see 60-70% correlation between MOVE and VIX when stock investors realize the Treasury market will hurt the price of their favorite stocks.
Graphs are for illustrative and discussion purposes only. Please read important disclosures at the end of this commentary.
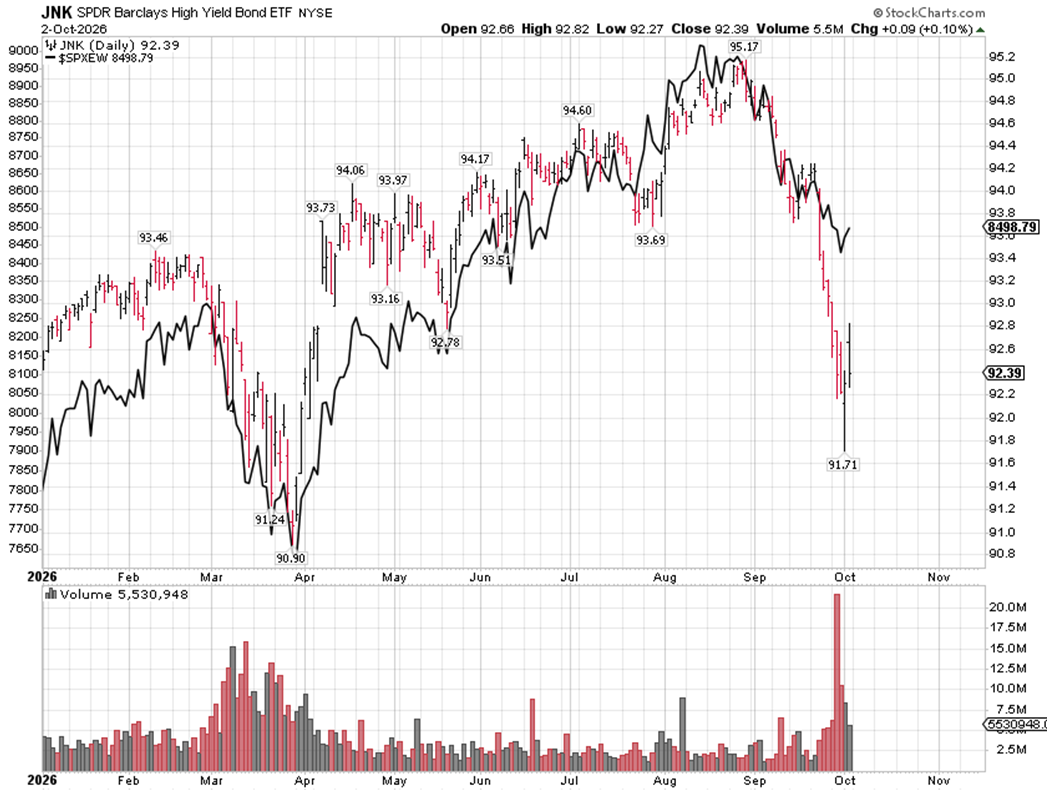
Last week I showed a chart of the S&P 500 Index and a popular junk bond ETF showing great divergence vs. their typical heavy correlation. This week, I am showing the same junk bond ETF with the S&P 500 Equal Weight Index (above) and there is no divergence. Needless to say, if this drama in Treasury futures continues, which is certainly possible, the relative calm masqueraded on the surface of the S&P 500 Index will turn out to be a more dramatic experience, more similar to what the Equal Weight Index is doing.
The latest Equal Weight index decline is like the situation before the Iran war started, which for the S&P 500 was about 10%, at that time, yet this time the S&P 500 is sitting a little over 1% below an all-time high and there is no decline. To say the tech sector is bailing out the S&P 500 is an understatement.
It’s very simple: For the stock market to be out of the woods, the drama in the Treasury market needs to end. Since the relentless climb started more less on the day the Iran war started, one would think if the war ends, or they negotiate in earnest again, the Treasury rout will stop. I don’t think it will be that simple but it would definitely improve the situation dramatically and we may even drop under 5% with a drop in oil prices, which would cause the stock market to explode higher because of very high EPS growth in Q3.
If, however, that third aircraft carrier group that got ordered to depart for Iran last week gets into action and crude oil begins to spike again, it is possible 10-year Treasury yields will be at 5.5% or higher – a game changer for equities, where the tech sector may not have the pull to keep the S&P 500 this calm.
Graphs are for illustrative and discussion purposes only. Please read important disclosures at the end of this commentary.
I see a potential silver lining here. It is possible that the recent moving around aircraft carrier groups is just an example of hardball negotiations on behalf of the Trump administration, and if we see some Iranian de-escalation this week – impossible to predict, as I am speculating – or a similar deal we got in mid-May and June, the Treasury market has likely made an intermediate-term top in yields.
We have a climactic high in the 10-year yield with two lower daily highs around it. A veteran futures trader told me this is what all potential intermediate-term high look like, before most traders are sure they are intermediate-term highs. The 10-year yield needs to decline below 5.16% (last week’s and Friday’s low) and stay there for a few days and the move in both in stocks and bonds will be historic, yields dropping and stocks surging. In that case, the stock market won’t wait for the election to start rallying.
Any disorderly trading above 5.35% (on the 10-year Treasury bond yield) increases the possibility of a sharp pullback in equities, perhaps dramatically. Which will it be? I suppose we will know by this Friday.
All content above represents the opinion of Ivan Martchev of Navellier & Associates, Inc.
Also In This Issue
A Look Ahead by Louis Navellier
The Fourth Quarter is When Stocks Usually Shine the Brightest
Income Mail by Bryan Perry
The Bond Market Deserves a Sigh of Relief
Growth Mail by Gary Alexander
The Current AI Scare Resembles Past Techno-Terror Tales
Global Mail by Ivan Martchev
Sector Friction in the S&P 500 Widens
Sector Spotlight by Jason Bodner
Like the Seasons, Markets Often Wax and Wane on Schedule
View Full Archive
Read Past Issues Here

Ivan Martchev
INVESTMENT STRATEGIST
Ivan Martchev is an investment strategist with Navellier. Previously, Ivan served as editorial director at InvestorPlace Media. Ivan was editor of Louis Rukeyser’s Mutual Funds and associate editor of Personal Finance. Ivan is also co-author of The Silk Road to Riches (Financial Times Press). The book provided analysis of geopolitical issues and investment strategy in natural resources and emerging markets with an emphasis on Asia. The book also correctly predicted the collapse in the U.S. real estate market, the rise of precious metals, and the resulting increased investor interest in emerging markets. Ivan’s commentaries have been published by MSNBC, The Motley Fool, MarketWatch, and others. All content of “Global Mail” represents the opinion of Ivan Martchev
Important Disclosures:
Although information in these reports has been obtained from and is based upon sources that Navellier believes to be reliable, Navellier does not guarantee its accuracy and it may be incomplete or condensed. All opinions and estimates constitute the authors opinions as of the date the report was created and are subject to change without notice. These reports are for informational purposes only and are not a solicitation for the purchase or sale of any securities or financial services. Any decision to purchase securities mentioned in these reports must take into account existing public information on such securities or any registered prospectus. To the extent permitted by law, neither Navellier & Associates, Inc., nor any of its affiliates, agents, or service providers are providing any investment advice herein and do not assume any liability or responsibility for the readers’ decisions if any. No reader should act or refrain from acting in reliance on the information contained in this communication or for any decision based on it.
None of the stock information, data, or company information presented herein constitutes investment advice or a recommendation by Navellier or a solicitation to buy or sell any securities. Any specific securities identified and described herein do not represent any investment advice.
Information presented is general information that does not take into account your individual circumstances, financial situation, or needs, nor does it present a personalized recommendation to you. Individual stocks presented may not be suitable for every investor. Investment in securities involves significant risk and has the potential for partial or complete loss of funds invested. Investment in fixed income securities has the potential for the investment return and principal value of an investment to fluctuate so that an investor’s holdings, when redeemed, may be worth less than their original cost.
- This report contains statements that are, or may be considered to be, forward-looking statements. All statements that are not historical facts, including statements about our beliefs or expectations, are “forward-looking statements” within the meaning of The U.S. Private Securities Litigation Reform Act of 1995. These statements may be identified by such forward-looking terminology as “expect,” “estimate,” “plan,” “intend,” “believe,” “anticipate,” “may,” “will,” “should,” “could,” “continue,” “project,” or similar statements or variations of such terms. Our forward-looking statements are based on a series of expectations, assumptions, and projections, are not investment advice. All of our forward-looking statements are as of the date of this report only.
- Federal Tax Advice Disclaimer: As required by U.S. Treasury Regulations, you are informed that, to the extent this presentation mentions any federal taxes, Navellier is not presenting any tax advice and should not be used or relied on as tax advice. Navellier does not advise on any income tax requirements or issues. Use of any information presented by Navellier is for general information only and does not represent tax advice either express or implied. You are encouraged to seek professional tax advice for income tax questions and assistance.
- FactSet Disclosure: Navellier does not independently calculate the statistical information included in the attached report. The calculation and the information are provided by FactSet, a company not related to Navellier. Although information contained in the report has been obtained from FactSet and is based on sources Navellier believes to be reliable, Navellier does not guarantee its accuracy, and it may be inaccurate, incomplete or condensed. The report and the related FactSet sourced information is for general information purposes only.