
by Bryan Perry
October 6, 2026
Friday’s rally across most equity sectors stemmed primarily from a cooler-than-anticipated payroll report. Headline job growth came in noticeably below consensus forecasts. Along with a slight uptick in the jobless rate, investors bet the labor market is finally cooling from its previously overheated state.
This moderating trend provides tangible evidence of the Fed’s restrictive monetary policy is having its intended effect, suppressing runaway economic heat without tipping the economy into contraction.
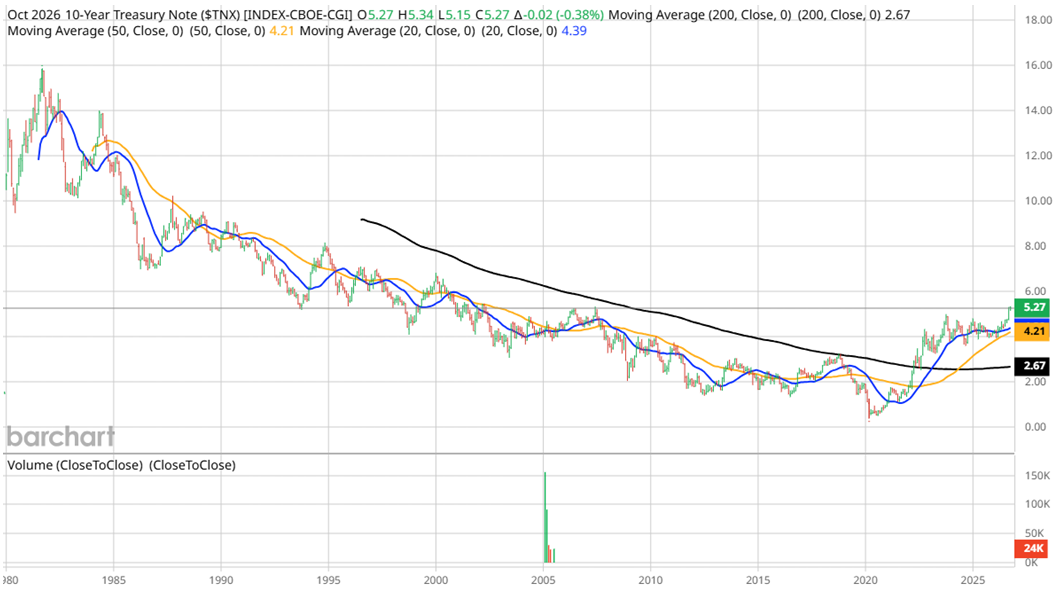
For fixed-income investors, softer hiring data immediately translates to a stabilizing effect in benchmark Treasury yields. The cooler labor figures dramatically reduced market expectations for further policy tightening by the Federal Reserve this month, easing upward pressure on short- and long-term borrowing rates. The benchmark 10-year Treasury hit some overhead technical resistance at 5.30%. However, a breach of this level could send the yield up to 6.0% and stymie the market’s desire to push higher.
Graphs are for illustrative and discussion purposes only. Please read important disclosures at the end of this commentary.
Stock markets capitalized on the jobs data with a relief rally in high-growth sectors, such as technology and consumer discretionary, both sectors particularly sensitive to interest rate expectations, as lower discount rates increase the net present value of their future cash flows. The stemming of selling pressure in Treasury yields gives equity valuations some much-needed breathing room, which contains the potential to fuel broad gains across major benchmarks heading into third quarter earnings season.
Quite frankly, the September jobs report resembles what analysts often describe as a Goldilocks scenario. While job growth slowed enough to cool inflation concerns and clear the path for monetary easing, the labor market remains stable enough to prevent widespread panic over an impending recession.
This combination of moderating wage growth and hiring pressures without economic collapse reassures investors that corporate earnings can hold steady while financial conditions ease, creating a favorable backdrop for both asset classes to move higher. Not too hot, not too cold, just what the market needed.
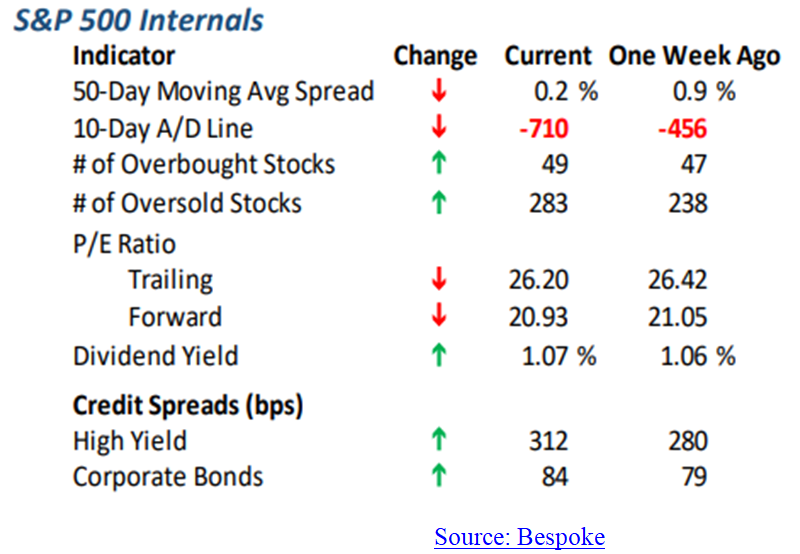
One yellow caution flag comes from a glance at the market’s internals. The S&P Advance/Decline line has been notably negative for the past several weeks and seems to have bottomed out as of yesterday. The last time the A/D line was this negative was back in March, right before a torrid rally into June.
Graphs are for illustrative and discussion purposes only. Please read important disclosures at the end of this commentary.
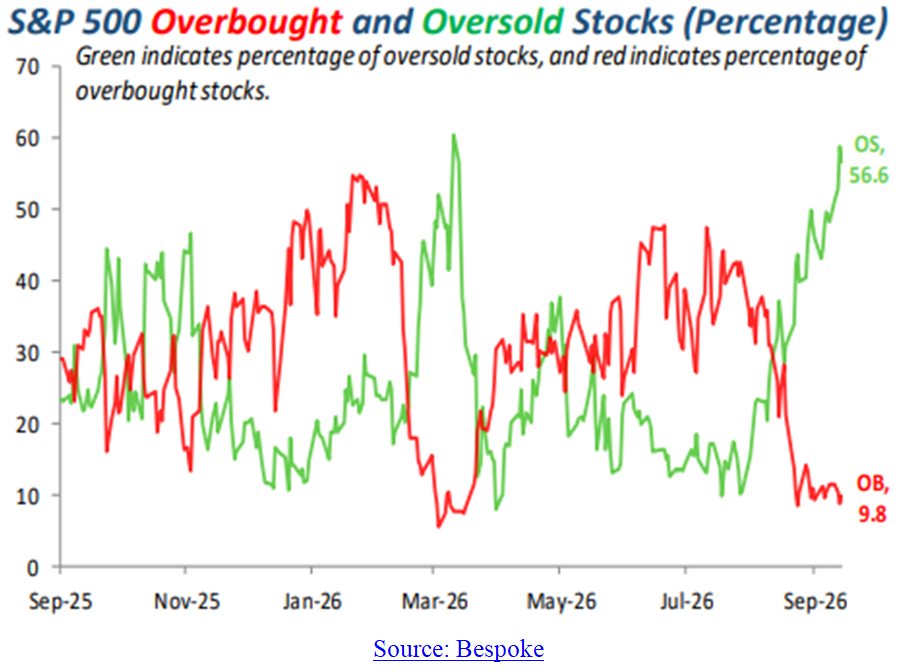
Heading into Friday’s rally, the number of oversold stocks in the S&P stood at 283, with spreads on corporate bonds and high yield debt widening. Again, investors are looking for last week’s action to define a bottom, with the way forward being where the trends for the A/D line and bond spreads recover. So, fingers crossed, we are at that same inflection point, a time when the bulls can seize the moment.
Graphs are for illustrative and discussion purposes only. Please read important disclosures at the end of this commentary.
To put this picture into perspective, as per my most recent writings, the bond market is re-adjusting back to pre-Great Recession levels, when the job market, stock market, and overall economy thrived when the 10-year Treasury was trading with a yield of 5.0%-6.5%. Inflation was running at around a 3%-4% annual rate, and the stock market gained 315% from 1990 to 2000. If you include dividends, the 1990s return was 432%, for an annual return of 18.2%. But we also did not have to service a $40 trillion federal debt.
Looking ahead, strong sales and earnings can override any normally rising rates, at least for now. Companies that refinanced their balance sheets when rates were near zero are in the catbird seat of AI productivity and low debt service. One would think the Treasury would have taken the same steps when they could have refinanced the entire debt at phenomenally low rates, but that ship has sailed.
In the near term, market conditions are set to improve, supported by last week’s jobs report and mild PCE inflation data. Oil prices are steady-to-lower, with reports of another U.S. aircraft carrier group with 10,000 troops en route to the Middle East to shore up efforts to strangle Iran and enhance the free flow of legal oil shipments. If bond yields just hold steady and third-quarter earnings season for the S&P 500 can deliver better-than-forecast results while maintaining upward guidance, there is a higher probability the market can withstand whatever the midterms deliver and trade to new highs.
All content above represents the opinion of Bryan Perry of Navellier & Associates, Inc.
Also In This Issue
A Look Ahead by Louis Navellier
The Fourth Quarter is When Stocks Usually Shine the Brightest
Income Mail by Bryan Perry
The Bond Market Deserves a Sigh of Relief
Growth Mail by Gary Alexander
The Current AI Scare Resembles Past Techno-Terror Tales
Global Mail by Ivan Martchev
Sector Friction in the S&P 500 Widens
Sector Spotlight by Jason Bodner
Like the Seasons, Markets Often Wax and Wane on Schedule
View Full Archive
Read Past Issues Here

Bryan Perry
SENIOR DIRECTOR
Bryan Perry is a Senior Director with Navellier Private Client Group, advising and facilitating high net worth investors in the pursuit of their financial goals.
Bryan’s financial services career spanning the past three decades includes over 20-years of wealth management experience with Wall Street firms that include Bear Stearns, Lehman Brothers and Paine Webber, working with both retail and institutional clients. Bryan earned a B.A. in Political Science from Virginia Polytechnic Institute & State University and currently holds a Series 65 license. All content of “Income Mail” represents the opinion of Bryan Perry
Important Disclosures:
Although information in these reports has been obtained from and is based upon sources that Navellier believes to be reliable, Navellier does not guarantee its accuracy and it may be incomplete or condensed. All opinions and estimates constitute the authors opinions as of the date the report was created and are subject to change without notice. These reports are for informational purposes only and are not a solicitation for the purchase or sale of any securities or financial services. Any decision to purchase securities mentioned in these reports must take into account existing public information on such securities or any registered prospectus. To the extent permitted by law, neither Navellier & Associates, Inc., nor any of its affiliates, agents, or service providers are providing any investment advice herein and do not assume any liability or responsibility for the readers’ decisions if any. No reader should act or refrain from acting in reliance on the information contained in this communication or for any decision based on it.
None of the stock information, data, or company information presented herein constitutes investment advice or a recommendation by Navellier or a solicitation to buy or sell any securities. Any specific securities identified and described herein do not represent any investment advice.
Information presented is general information that does not take into account your individual circumstances, financial situation, or needs, nor does it present a personalized recommendation to you. Individual stocks presented may not be suitable for every investor. Investment in securities involves significant risk and has the potential for partial or complete loss of funds invested. Investment in fixed income securities has the potential for the investment return and principal value of an investment to fluctuate so that an investor’s holdings, when redeemed, may be worth less than their original cost.
- This report contains statements that are, or may be considered to be, forward-looking statements. All statements that are not historical facts, including statements about our beliefs or expectations, are “forward-looking statements” within the meaning of The U.S. Private Securities Litigation Reform Act of 1995. These statements may be identified by such forward-looking terminology as “expect,” “estimate,” “plan,” “intend,” “believe,” “anticipate,” “may,” “will,” “should,” “could,” “continue,” “project,” or similar statements or variations of such terms. Our forward-looking statements are based on a series of expectations, assumptions, and projections, are not investment advice. All of our forward-looking statements are as of the date of this report only.
- Federal Tax Advice Disclaimer: As required by U.S. Treasury Regulations, you are informed that, to the extent this presentation mentions any federal taxes, Navellier is not presenting any tax advice and should not be used or relied on as tax advice. Navellier does not advise on any income tax requirements or issues. Use of any information presented by Navellier is for general information only and does not represent tax advice either express or implied. You are encouraged to seek professional tax advice for income tax questions and assistance.
- FactSet Disclosure: Navellier does not independently calculate the statistical information included in the attached report. The calculation and the information are provided by FactSet, a company not related to Navellier. Although information contained in the report has been obtained from FactSet and is based on sources Navellier believes to be reliable, Navellier does not guarantee its accuracy, and it may be inaccurate, incomplete or condensed. The report and the related FactSet sourced information is for general information purposes only.