by Jason Bodner
June 30, 2026
In 1892, German surgeon Julius Wolff made a fascinating discovery: Bones aren’t static structures, they are alive. When subjected to stress, microscopic fractures often form. But instead of just healing, the bones rebuild denser and stronger than before. So, stress isn’t the problem…. It’s a growth opportunity.
Orthopedic surgeons named this syndrome after its founder, Wolff’s Law, namely “bones that never face stress become weak. Bones under stress are more likely to become stronger.”
The technology sector on Wall Street just experienced its own version of Wolff’s Law.
From the March low to the June 2 peak, the NASDAQ Composite rallied by more than 30% in roughly 60-trading sessions. Markets don’t move in straight lines forever, of course. Every strong advance eventually needs a pause. Gains get digested, and some enthusiasm gets shaken out. That’s healthy and necessary.
Last week, that’s exactly what happened. NASDAQ pulled back roughly 6.4% from its recent high, while the NASDAQ 100 fell about 4%. Right on cue come the fear and explanations. AI enthusiasm is fading. Valuations are stretched. Inflation remains stubborn. The Iran war, which looked settled two-weeks ago, is back in the headlines after a cargo ship was struck near Oman, briefly sending Brent crude above $80.
Every correction comes with a brand-new reason why “this time is different,” but the data disagrees.
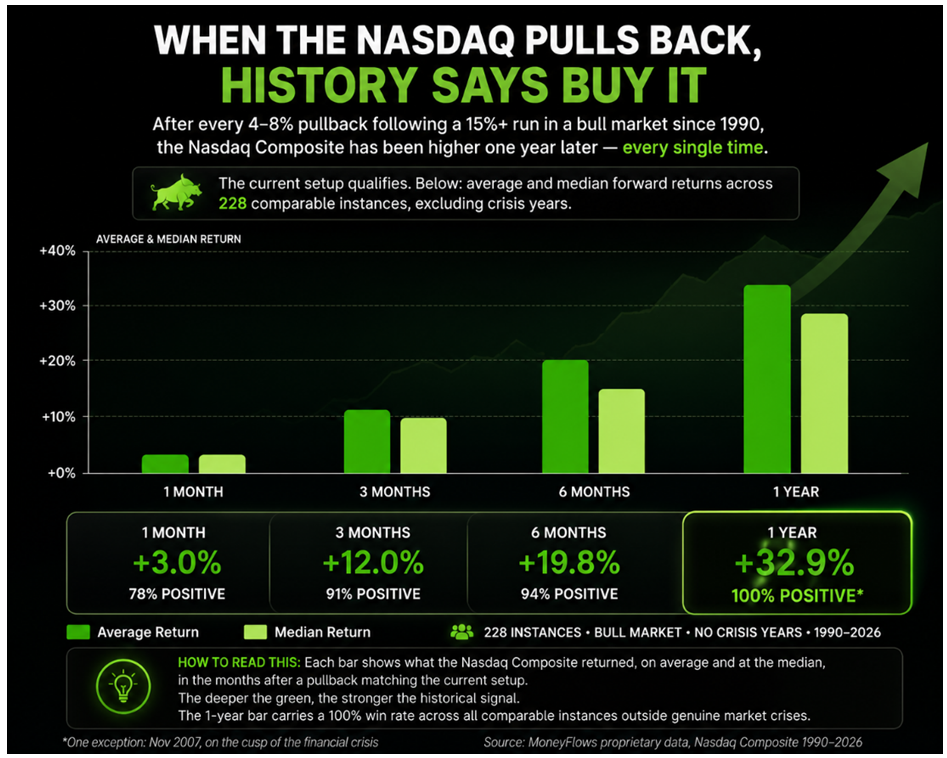
Looking at similar setups since 1990, NASDAQ has experienced 228-pullbacks of between 4.5% and 8% after previously rallying by at least 15%, excluding genuine crisis periods. This week’s setup fits the pattern almost perfectly. What followed those moments is worth studying a bit closer. One-month later, the NASDAQ was higher 78% of the time, averaging 3% gains. Three-months later, it was positive 91% of the time, up roughly 12%. Six-months out, the win rate climbed to 94%, with gains approaching 20%.
And one year later? Across all 228-instances, the NASDAQ finished higher every time, averaging +33%!
Graphs are for illustrative and discussion purposes only. Please read important disclosures at the end of this commentary.
Naturally, that’s not a forecast or a guarantee of a repeat in 2026, but it’s the historical baseline. Base rates deserve more respect than whatever narrative dominates the headlines in any given week.
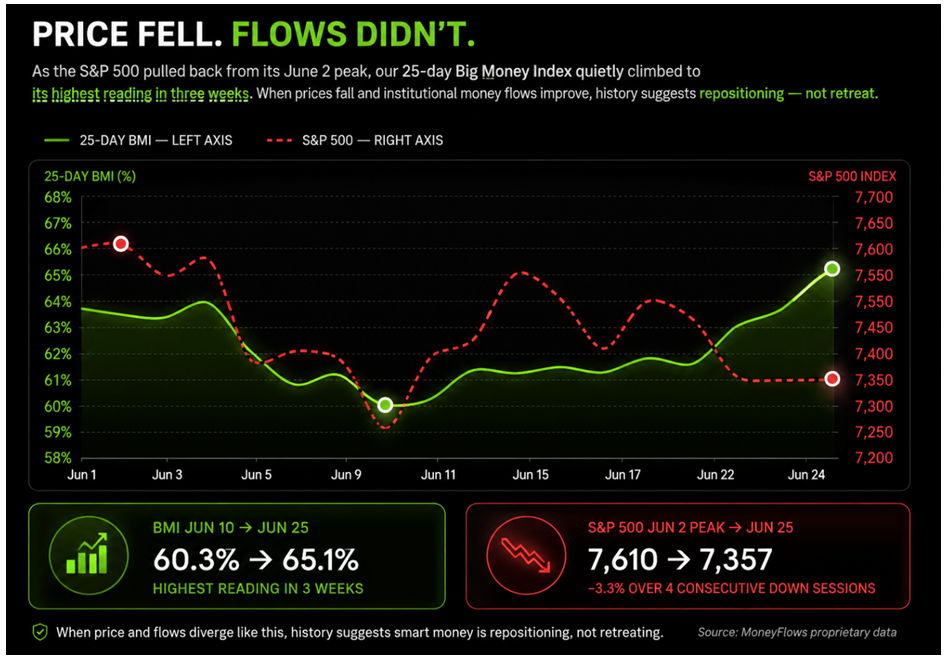
The money flows I follow reinforced that read. Our 25-day Big Money Index (BMI) climbed to 65.1% by Thursday, its highest reading in three-weeks, even while the NASDAQ fell in four-consecutive sessions.
Prices were moving lower, but the underlying money flows were quietly improving.
Graphs are for illustrative and discussion purposes only. Please read important disclosures at the end of this commentary.
Historically speaking, divergence like that means repositioning, not running for cover.
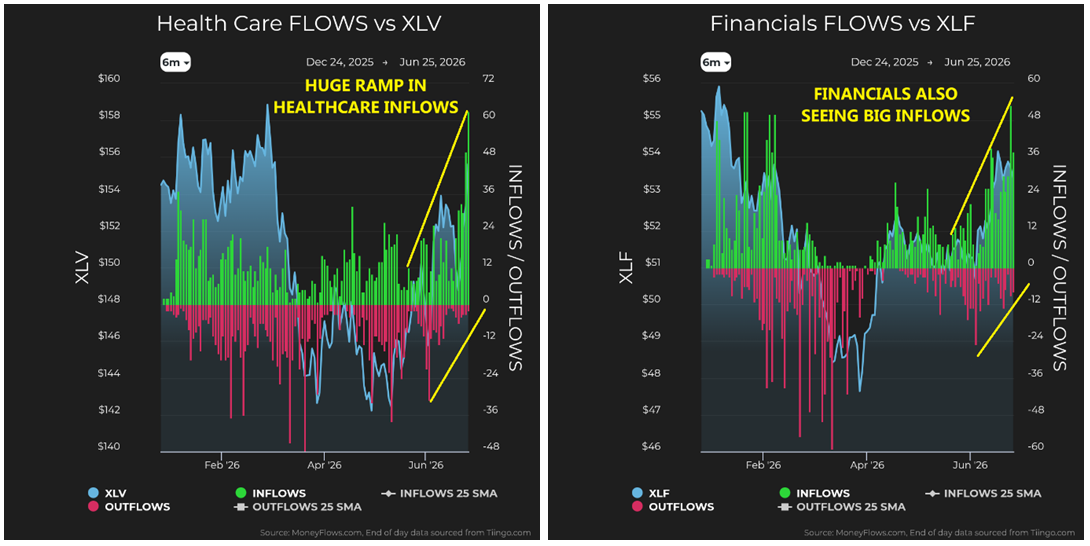
The sector rotation confirms it. Healthcare attracted the strongest inflows of the week by a wide margin, led by clinical-stage biotechnology and specialty pharmaceutical companies. Financials were close behind, with buying spread across banks, insurers, and capital markets firms.
Graphs are for illustrative and discussion purposes only. Please read important disclosures at the end of this commentary.
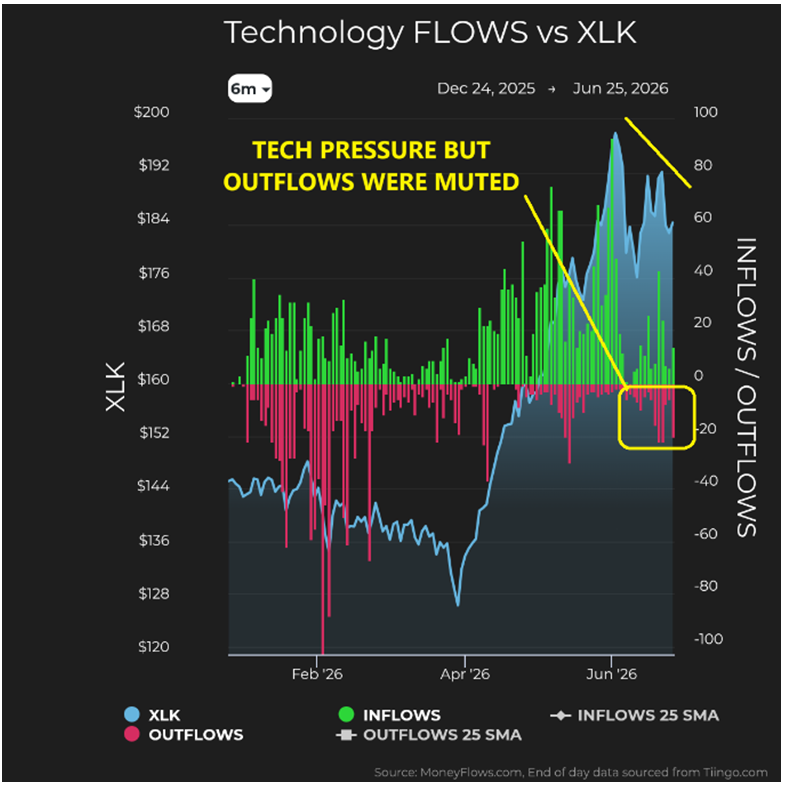
Technology was modestly negative overall, but the details matter. Investors weren’t abandoning AI. They were getting selective. The most crowded names experienced selling while semiconductor and networking infrastructure companies continued attracting buyers.
Graphs are for illustrative and discussion purposes only. Please read important disclosures at the end of this commentary.
Then came one of the week’s most telling earnings reports; Micron Technology, the world’s largest memory chip maker reported quarterly revenue of $41.5-billion, up 346% from a year earlier, with gross margins of 84.9% surpassing both Nvidia and Meta. Earnings beat estimates by 23%. Guidance for next quarter called for $50-billion in revenue, nearly $7-billion above Wall Street’s expectations. And high-bandwidth memory products are fully booked through 2027.
The ripple effect hit consumers the same day. A major technology company announced price increases of $100 to $300 on laptops and tablets, saying it had never seen component costs rise this much, this quickly.
The AI boom isn’t softening. It’s arriving in terms of both earnings and price tags simultaneously.
There was rotation this week, but it looked healthy. Over-extended names cooled off, but companies with real earnings, solid cash flows, and business momentum kept attracting buyers. Healthcare and financials led the way, while semiconductors held steady. This doesn’t resemble a market bracing for trouble. It looks like a bull-market becoming more disciplined. That’s what healthy advances tend to do.
Examining Seasonality: Monthly Trends + Mid-Term Presidential Years
Seasonality adds one more reason not to overreact. June has historically been one of the flattest months of the year, while July has consistently been one of the strongest, producing average gains approaching 1.5%, with positive returns roughly two-thirds of the time.
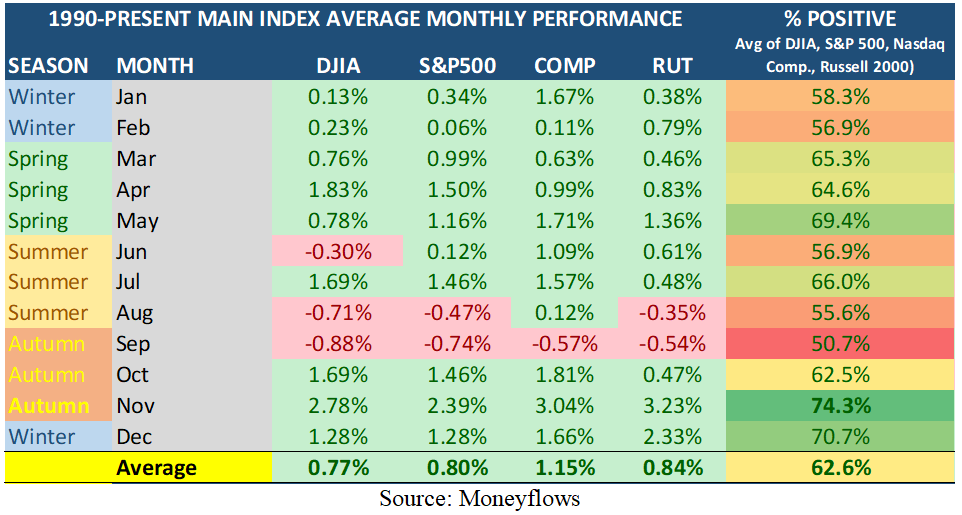
Graphs are for illustrative and discussion purposes only. Please read important disclosures at the end of this commentary.
There’s another historical lens worth adding here, one arriving at a remarkably similar conclusion from a completely different direction. I am referring to the history of mid-term election years, since 2026 is as a midterm election year. Mid-term years have the worst reputation in the four-year presidential cycle, averaging just 5.8% total returns since 1926 and punishing intra-year draw-downs averaging 16%.
The first nine months tend to be choppy, frustrating, and full of reasons to give up. Sound familiar?
But the crowd consistently forgets any election uncertainty in the fourth-quarter, when mid-term years historically snap-back hard. Since 1926, the S&P 500 has averaged a 7% gain in Q4 of mid-term years alone, with an 88% positivity rate. And since 1950, the market has averaged 36% one-year returns!
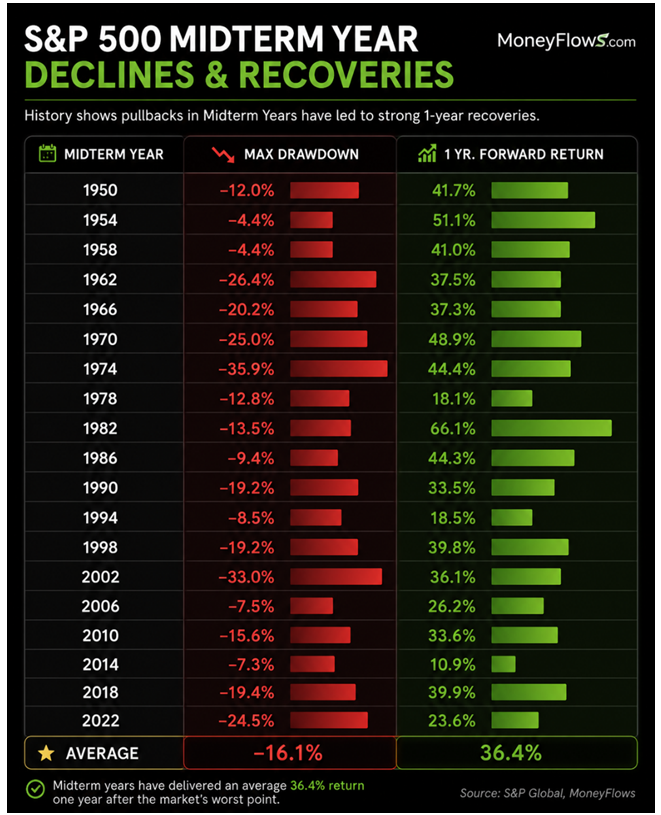
Graphs are for illustrative and discussion purposes only. Please read important disclosures at the end of this commentary.
That kind of juice is exactly what the NASDAQ’s 228-instance pullback study produced from a completely different methodology. Two independent historical frameworks, arriving at nearly the same number. That kind of convergence is worth paying attention to.
The choppy front half of a mid-term year might finally be here. The lows may or may not be behind us, but history suggests the direction of least resistance from here is higher. Mid-term years have a way of exhausting the skeptics and rewarding the patient. Q4 could deliver gains dwarfing any short-term losses.
Here’s the deal: A 30% market sprint earlier this year demanded an imminent breather. It came on schedule, dressed in fresh headlines designed to make it feel like something worse than a pause. Neither flows nor data support the fear story. And earnings coming out of AI infrastructure don’t support it either.
Wolff’s Law says stressed bones grow back stronger. History says the same about bull market pullbacks.
“What doesn’t break you makes you denser.” – Julius Wolf
Bend – don’t break.
Navellier & Associates; own Nvidia (NVDA), Micron (MU), Apple (AAPL) and Meta Platforms Inc Class A (META) in managed accounts. Jason Bodner owns Nvidia (NVDA), Micron (MU), Apple (AAPL) and Meta Platforms Inc Class A (META) personally.
All content above represents the opinion of Jason Bodner of Navellier & Associates, Inc.
Also In This Issue
A Look Ahead by Louis Navellier
Are We Headed into Space – Or Is “Space” Headed Here?!
Income Mail by Bryan Perry
Decoding Big Tech’s $600 Billion Bet: Is it a Mad Gamble or a Master Plan?
Growth Mail by Gary Alexander
Beware Mid-Term Election Years (But Celebrate What Follows)
Global Mail by Ivan Martchev
The Revenge of the 493
Sector Spotlight by Jason Bodner
Stress Builds Strength – In Humans and in the Markets
View Full Archive
Read Past Issues Here

Jason Bodner
MARKETMAIL EDITOR FOR SECTOR SPOTLIGHT
Jason Bodner writes Sector Spotlight in the weekly Marketmail publication and has authored several white papers for the company. He is also Co-Founder of Macro Analytics for Professionals which produces proprietary equity accumulation and distribution research for its clients. Previously, Mr. Bodner served as Director of European Equity Derivatives for Cantor Fitzgerald Europe in London, then moved to the role of Head of Equity Derivatives North America for the same company in New York. He also served as S.V.P. Equity Derivatives for Jefferies, LLC. He received a B.S. in business administration in 1996, with honors, from Skidmore College as a member of the Periclean Honors Society. All content of “Sector Spotlight” represents the opinion of Jason Bodner
Important Disclosures:
Jason Bodner is a co-founder and co-owner of Mapsignals. Mr. Bodner is an independent contractor who is occasionally hired by Navellier & Associates to write an article and or provide opinions for possible use in articles that appear in Navellier & Associates weekly Market Mail. Mr. Bodner is not employed or affiliated with Louis Navellier, Navellier & Associates, Inc., or any other Navellier owned entity. The opinions and statements made here are those of Mr. Bodner and not necessarily those of any other persons or entities. This is not an endorsement, or solicitation or testimonial or investment advice regarding the BMI Index or any statements or recommendations or analysis in the article or the BMI Index or Mapsignals or its products or strategies.
Although information in these reports has been obtained from and is based upon sources that Navellier believes to be reliable, Navellier does not guarantee its accuracy and it may be incomplete or condensed. All opinions and estimates constitute Navellier’s judgment as of the date the report was created and are subject to change without notice. These reports are for informational purposes only and are not a solicitation for the purchase or sale of a security. Any decision to purchase securities mentioned in these reports must take into account existing public information on such securities or any registered prospectus.To the extent permitted by law, neither Navellier & Associates, Inc., nor any of its affiliates, agents, or service providers assumes any liability or responsibility nor owes any duty of care for any consequences of any person acting or refraining to act in reliance on the information contained in this communication or for any decision based on it.
Past performance is no indication of future results. Investment in securities involves significant risk and has the potential for partial or complete loss of funds invested. It should not be assumed that any securities recommendations made by Navellier. in the future will be profitable or equal the performance of securities made in this report. Dividend payments are not guaranteed. The amount of a dividend payment, if any, can vary over time and issuers may reduce dividends paid on securities in the event of a recession or adverse event affecting a specific industry or issuer.
None of the stock information, data, and company information presented herein constitutes a recommendation by Navellier or a solicitation to buy or sell any securities. Any specific securities identified and described do not represent all of the securities purchased, sold, or recommended for advisory clients. The holdings identified do not represent all of the securities purchased, sold, or recommended for advisory clients and the reader should not assume that investments in the securities identified and discussed were or will be profitable.
Information presented is general information that does not take into account your individual circumstances, financial situation, or needs, nor does it present a personalized recommendation to you. Individual stocks presented may not be suitable for every investor. Investment in securities involves significant risk and has the potential for partial or complete loss of funds invested. Investment in fixed income securities has the potential for the investment return and principal value of an investment to fluctuate so that an investor’s holdings, when redeemed, may be worth less than their original cost.
One cannot invest directly in an index. Index is unmanaged and index performance does not reflect deduction of fees, expenses, or taxes. Presentation of Index data does not reflect a belief by Navellier that any stock index constitutes an investment alternative to any Navellier equity strategy or is necessarily comparable to such strategies. Among the most important differences between the Indices and Navellier strategies are that the Navellier equity strategies may (1) incur material management fees, (2) concentrate its investments in relatively few stocks, industries, or sectors, (3) have significantly greater trading activity and related costs, and (4) be significantly more or less volatile than the Indices.
ETF Risk: We may invest in exchange traded funds (“ETFs”) and some of our investment strategies are generally fully invested in ETFs. Like traditional mutual funds, ETFs charge asset-based fees, but they generally do not charge initial sales charges or redemption fees and investors typically pay only customary brokerage fees to buy and sell ETF shares. The fees and costs charged by ETFs held in client accounts will not be deducted from the compensation the client pays Navellier. ETF prices can fluctuate up or down, and a client account could lose money investing in an ETF if the prices of the securities owned by the ETF go down. ETFs are subject to additional risks:
- ETF shares may trade above or below their net asset value;
- An active trading market for an ETF’s shares may not develop or be maintained;
- The value of an ETF may be more volatile than the underlying portfolio of securities the ETF is designed to track;
- The cost of owning shares of the ETF may exceed those a client would incur by directly investing in the underlying securities and;
- Trading of an ETF’s shares may be halted if the listing exchange’s officials deem it appropriate, the shares are delisted from the exchange, or the activation of market-wide “circuit breakers” (which are tied to large decreases in stock prices) halts stock trading generally.
Grader Disclosures: Investment in equity strategies involves substantial risk and has the potential for partial or complete loss of funds invested. The sample portfolio and any accompanying charts are for informational purposes only and are not to be construed as a solicitation to buy or sell any financial instrument and should not be relied upon as the sole factor in an investment making decision. As a matter of normal and important disclosures to you, as a potential investor, please consider the following: The performance presented is not based on any actual securities trading, portfolio, or accounts, and the reported performance of the A, B, C, D, and F portfolios (collectively the “model portfolios”) should be considered mere “paper” or pro forma performance results based on Navellier’s research.
Investors evaluating any of Navellier & Associates, Inc.’s, (or its affiliates’) Investment Products must not use any information presented here, including the performance figures of the model portfolios, in their evaluation of any Navellier Investment Products. Navellier Investment Products include the firm’s mutual funds and managed accounts. The model portfolios, charts, and other information presented do not represent actual funded trades and are not actual funded portfolios. There are material differences between Navellier Investment Products’ portfolios and the model portfolios, research, and performance figures presented here. The model portfolios and the research results (1) may contain stocks or ETFs that are illiquid and difficult to trade; (2) may contain stock or ETF holdings materially different from actual funded Navellier Investment Product portfolios; (3) include the reinvestment of all dividends and other earnings, estimated trading costs, commissions, or management fees; and, (4) may not reflect prices obtained in an actual funded Navellier Investment Product portfolio. For these and other reasons, the reported performances of model portfolios do not reflect the performance results of Navellier’s actually funded and traded Investment Products. In most cases, Navellier’s Investment Products have materially lower performance results than the performances of the model portfolios presented.
This report contains statements that are, or may be considered to be, forward-looking statements. All statements that are not historical facts, including statements about our beliefs or expectations, are “forward-looking statements” within the meaning of The U.S. Private Securities Litigation Reform Act of 1995. These statements may be identified by such forward-looking terminology as “expect,” “estimate,” “plan,” “intend,” “believe,” “anticipate,” “may,” “will,” “should,” “could,” “continue,” “project,” or similar statements or variations of such terms. Our forward-looking statements are based on a series of expectations, assumptions, and projections, are not guarantees of future results or performance, and involve substantial risks and uncertainty as described in Form ADV Part 2A of our filing with the Securities and Exchange Commission (SEC), which is available at www.adviserinfo.sec.gov or by requesting a copy by emailing info@navellier.com. All of our forward-looking statements are as of the date of this report only. We can give no assurance that such expectations or forward-looking statements will prove to be correct. Actual results may differ materially. You are urged to carefully consider all such factors.
FEDERAL TAX ADVICE DISCLAIMER: As required by U.S. Treasury Regulations, you are informed that, to the extent this presentation includes any federal tax advice, the presentation is not written by Navellier to be used, and cannot be used, for the purpose of avoiding federal tax penalties. Navellier does not advise on any income tax requirements or issues. Use of any information presented by Navellier is for general information only and does not represent tax advice either express or implied. You are encouraged to seek professional tax advice for income tax questions and assistance.
IMPORTANT NEWSLETTER DISCLOSURE:The hypothetical performance results for investment newsletters that are authored or edited by Louis Navellier, including Louis Navellier’s Growth Investor, Louis Navellier’s Breakthrough Stocks, Louis Navellier’s Accelerated Profits, and Louis Navellier’s Platinum Club, are not based on any actual securities trading, portfolio, or accounts, and the newsletters’ reported hypothetical performances should be considered mere “paper” or proforma hypothetical performance results and are not actual performance of real world trades. Navellier & Associates, Inc. does not have any relation to or affiliation with the owner of these newsletters. There are material differences between Navellier Investment Products’ portfolios and the InvestorPlace Media, LLC newsletter portfolios authored by Louis Navellier. The InvestorPlace Media, LLC newsletters contain hypothetical performance that do not include transaction costs, advisory fees, or other fees a client might incur if actual investments and trades were being made by an investor. As a result, newsletter performance should not be used to evaluate Navellier Investment services which are separate and different from the newsletters. The owner of the newsletters is InvestorPlace Media, LLC and any questions concerning the newsletters, including any newsletter advertising or hypothetical Newsletter performance claims, (which are calculated solely by Investor Place Media and not Navellier) should be referred to InvestorPlace Media, LLC at (800) 718-8289.
Please note that Navellier & Associates and the Navellier Private Client Group are managed completely independent of the newsletters owned and published by InvestorPlace Media, LLC and written and edited by Louis Navellier, and investment performance of the newsletters should in no way be considered indicative of potential future investment performance for any Navellier & Associates separately managed account portfolio. Potential investors should consult with their financial advisor before investing in any Navellier Investment Product.
Navellier claims compliance with Global Investment Performance Standards (GIPS). To receive a complete list and descriptions of Navellier’s composites and/or a presentation that adheres to the GIPS standards, please contact Navellier or click here. It should not be assumed that any securities recommendations made by Navellier & Associates, Inc. in the future will be profitable or equal the performance of securities made in this report.
FactSet Disclosure: Navellier does not independently calculate the statistical information included in the attached report. The calculation and the information are provided by FactSet, a company not related to Navellier. Although information contained in the report has been obtained from FactSet and is based on sources Navellier believes to be reliable, Navellier does not guarantee its accuracy, and it may be incomplete or condensed. The report and the related FactSet sourced information are provided on an “as is” basis. The user assumes the entire risk of any use made of this information. Investors should consider the report as only a single factor in making their investment decision. The report is for informational purposes only and is not intended as an offer or solicitation for the purchase or sale of a security. FactSet sourced information is the exclusive property of FactSet. Without prior written permission of FactSet, this information may not be reproduced, disseminated or used to create any financial products. All indices are unmanaged and performance of the indices include reinvestment of dividends and interest income, unless otherwise noted, are not illustrative of any particular investment and an investment cannot be made in any index. Past performance is no guarantee of future results.