by Gary Alexander
June 30, 2026
As we reach the mid-point of the year, we need to face the unpleasant history of mid-term election years as the worst year of the four – by far – in the four-year cycle. In my early investing life, I lived through 10 of 11 major market collapses in the mid-term years between 1962 (the Cuban Missile crisis and U.S. Steel wars) and 2002 (the dot-com/NASDAQ collapse). The next three mid-term years (2006, 2010 and 2014) were thankfully peaceful, but then we saw a big market retreat in late 2018 (over the aggressive monetary policies of new Fed Chair Powell) and then over the Fed’s (and President Biden’s) 2022 inflation denials.
Here’s the good news – a spoiler alert, in reverse: The flip side of such a dismal historical track record is the 6-12 months following each mid-term election – netting the strongest market surge of the four-year cycle, by far – partly due to the inevitable hope (“this time is different”) a new Congressional mix will somehow solve all our problems, since all we need is to create more checks and balances in Washington.
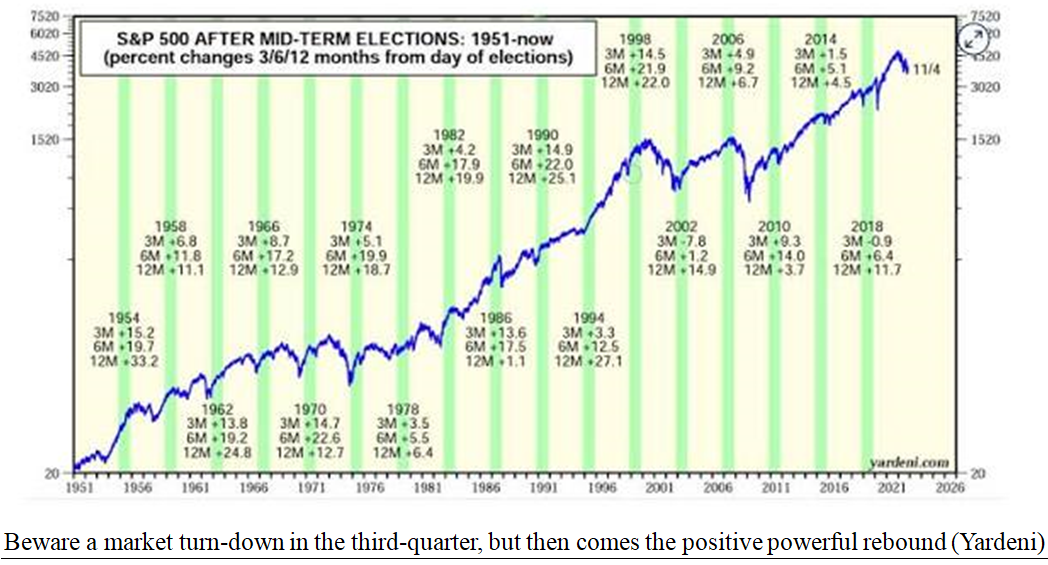
So, the one takeaway, I want everyone to recall from the following track record is the 12-months after a mid-term election never posted a negative return since 1950 – and the average gain was +16.3%.
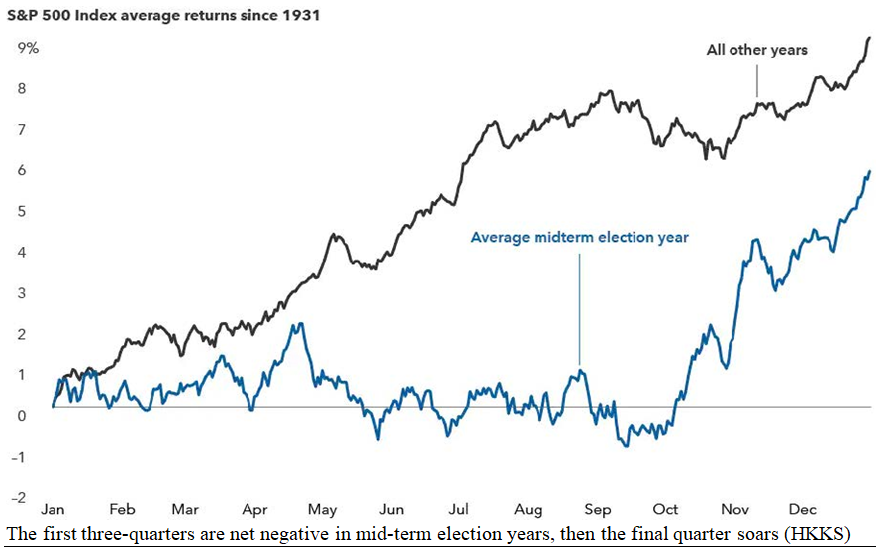
First off, let’s review the bidding: Most mid-term years are flat in the first half, down in the third quarter, then soaring in the final quarter, as reviewed in mid-term years over nearly 100-years:
Graphs are for illustrative and discussion purposes only. Please read important disclosures at the end of this commentary.
It’s important to know your history, too. Most mid-term downers were caused by external events more than the market’s internal health. To demonstrate that, let’s review the 10 (of 11) downers since 1962:
1962 featured two external crises: the real one, in October, was the Cuban Missile Crisis, but the earlier crisis is when the market tanked, during a spring war between President Kennedy and U.S. Steel. The Dow fell 27% from December 13, 1961, to June 26, 1962, but then it gained 85.7% by February 9, 1966.
1966 delivered a short recession disguised as a “credit crunch,” running from February to October, delivering a 25.2% haircut in eight months, followed by a major market recovery in 1967 and 1968.
1970 brought a tech-stock crash similar to the dot-com bubble of 2000, as the Nifty 50 and an array of computer and software stocks fell up to 80% in the second quarter of 1970. Then came a 50% rebound.
1974 capped the worst long-term market collapse (in real, after inflation terms) in the postwar era. The primary cause was the OPEC oil embargo of late 1973, tripling gasoline prices, but we also had major drains coming from the endgame in Vietnam and the Watergate crisis, with President Nixon’s resignation. Then came Ford’s attempt at healing us, and the best single market year since the 1950s, +38% in 1975.
1978 brought a second oil shock, exacerbated by Carter’s new Department of Energy, resulting in long gas lines and sky-high prices, yielding a sense of malaise and Carter’s loss to Reagan in a “misery index” peak year (1980) of 20% interest rates, 12% inflation and 11% jobless rates – but a 15% market surge!
1982 delivered the second of a “double-dip” recessionary blow at the start of Reagan’s first term, in the steep (but mercifully short) inflationary recession of 1982, ending suddenly, with 15-fold gains, 1982-99.
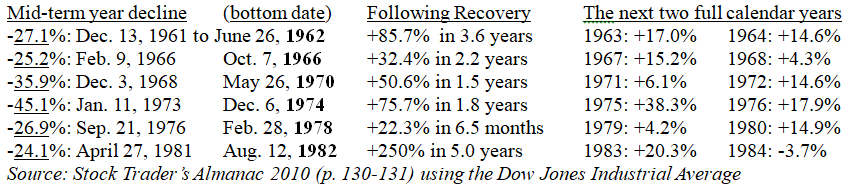
In summary form, here are those sad mid-term markets and the strong recoveries following these dips:
Whew! Time to take a break from this bad news to recall the bull-market of 1982-99, and why the next mid-term election year (1986) broke the cycle. First of all, the 1984 stock market had no business falling by 3.7%, since 1984 was the biggest, strongest GDP growth year (+6.9%) we’ve seen since 1950. And that’s the year President Reagan won the election by a landslide, with a slogan, “Morning in America.”
Then came a counter-cyclical +22.6% market gain in the mid-term election year of 1986, largely tied to the most dramatic tax reform package ever passed, lowering top tax rates to 28%, delivering a “morning” to America. As a result, the market soared too far too fast in 1987, resulting in a major crash in October.
Now, let’s return to our regularly scheduled program, reciting mid-term election year market collapses.
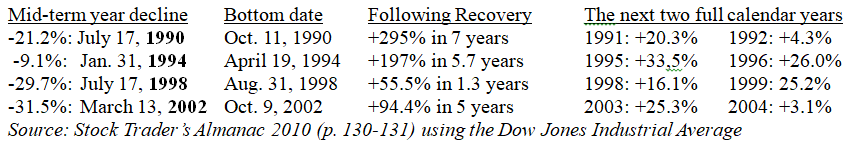
In brief, the 1990 decline followed the August invasion of Kuwait by Saddam Hussein, the 1994 decline followed a sudden surprise rate-rising regimen by Greenspan’s Fed in a fight against phantom inflation. The 1998 decline stemmed from the failure of the Long-Term Capital Management (LTCM) hedge fund and 2002’s decline was the final dismal market spasm of the dot-com bubble (and post-9/11 fears).
The next two mid-terms involved massive election reversals by voters disgruntled with (1) Bush’s wars (in 2006) and (2) Obama’s health-care plans (in 2010): Then, 2014 passed without major incidents, but now we’ve seen two major (19%+) market reversals in the last two mid-term election years, namely:
In 2018, new Fed Chair Jerome Powell raised interest rates one time too many, perhaps in defiance of President Trump’s multiple Tweets not to hazard such a destructive move. The President was right, but wrong in his meddling ways, as the market tanked in December 2018. The Dow Industrial Average fell by nearly 20% from its early October 2018 peak, delivering its worst December performance since 1931.
In 2022, the Fed’s delay in raising rates to fight what they called “transient” inflation increases in 2021 led to a 21% decline in the Dow over the first nine months of 2022 before recovering strongly since then.
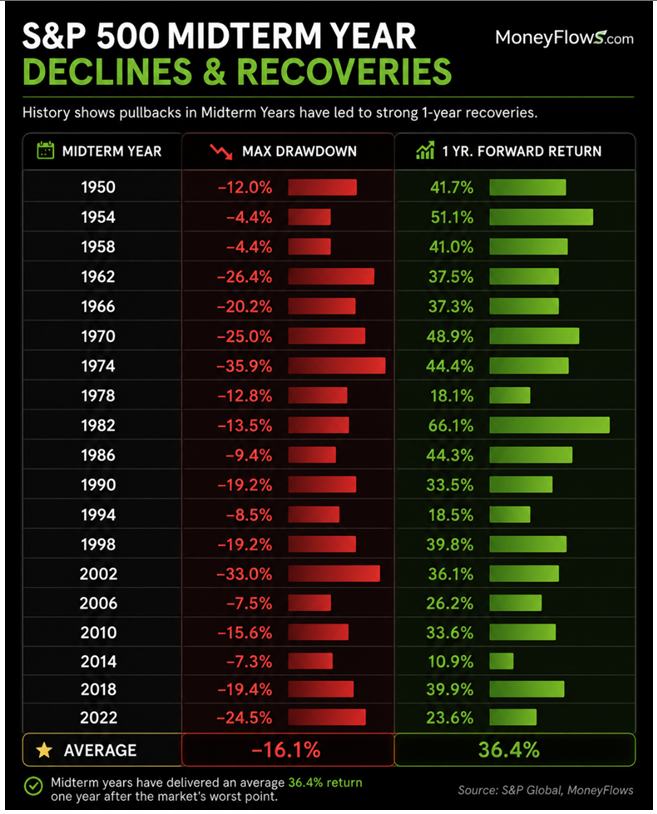
In all instances above, I’ve used the Dow Jones Industrial metrics, since it is the longest-running market measure, but the same trend is even more evident in the S&P 500 (computed actively since 1950) and NASDAQ (since 1971). Here’s a summary of the S&P downdrafts and subsequent recoveries since 1950.
Graphs are for illustrative and discussion purposes only. Please read important disclosures at the end of this commentary.
These numbers differ from my data above since this table covers the S&P 500, not the Dow, and covers mid-term years alone, not from its previous peak level, and the recovery covers a 12-month period only.
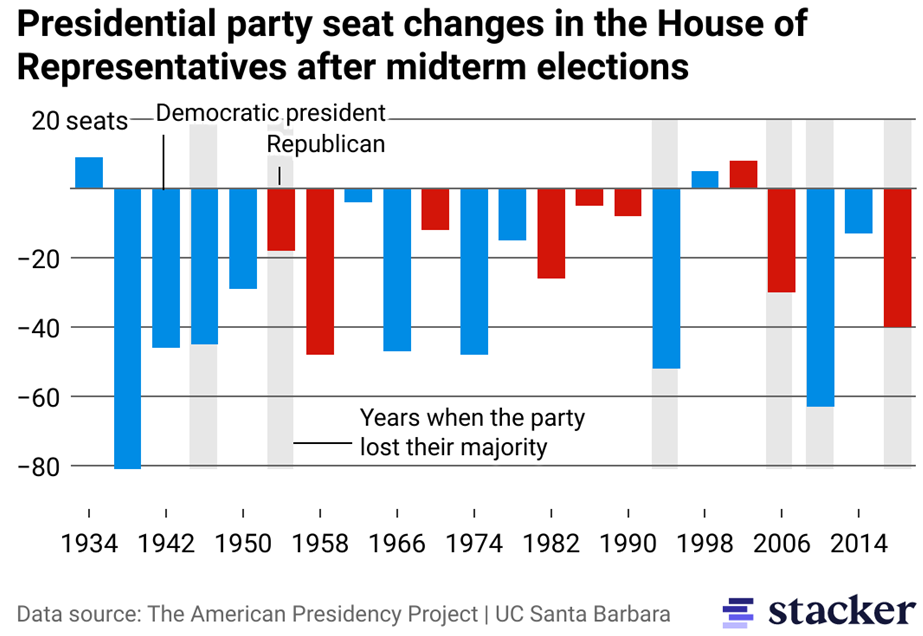
One of the major causes for the big recoveries following mid-term elections is the “restraining orders” put on one-party power monopolies in these mid-term elections. The last four incumbent presidents suffered massive reversals of their seats in Congress in 1994 (Clinton), 2006 (Bush), 2010 (Obama) and 2018 (Trump), and it could happen again in 2026. Voters like to think they have some veto powers.
Graphs are for illustrative and discussion purposes only. Please read important disclosures at the end of this commentary.
We don’t yet know if President Trump will receive a second mid-term spanking in November 2026, but American voters have this “get out of electoral jail free” card every mid-term. The market likes that, too.
Graphs are for illustrative and discussion purposes only. Please read important disclosures at the end of this commentary.
Enjoy the second half of 2026: Ignore any big draw-downs by remembering those fourth-quarter surges!
All content above represents the opinion of Gary Alexander of Navellier & Associates, Inc.
Also In This Issue
A Look Ahead by Louis Navellier
Are We Headed into Space – Or Is “Space” Headed Here?!
Income Mail by Bryan Perry
Decoding Big Tech’s $600 Billion Bet: Is it a Mad Gamble or a Master Plan?
Growth Mail by Gary Alexander
Beware Mid-Term Election Years (But Celebrate What Follows)
Global Mail by Ivan Martchev
The Revenge of the 493
Sector Spotlight by Jason Bodner
Stress Builds Strength – In Humans and in the Markets
View Full Archive
Read Past Issues Here
About The Author

Gary Alexander
SENIOR EDITOR
Gary Alexander has been Senior Writer at Navellier since 2009. He edits Navellier’s weekly Marketmail and writes a weekly Growth Mail column, in which he uses market history to support the case for growth stocks. For the previous 20-years before joining Navellier, he was Senior Executive Editor at InvestorPlace Media (formerly Phillips Publishing), where he worked with several leading investment analysts, including Louis Navellier (since 1997), helping launch Louis Navellier’s Blue Chip Growth and Global Growth newsletters.
Prior to that, Gary edited Wealth Magazine and Gold Newsletter and wrote various investment research reports for Jefferson Financial in New Orleans in the 1980s. He began his financial newsletter career with KCI Communications in 1980, where he served as consulting editor for Personal Finance newsletter while serving as general manager of KCI’s Alexandria House book division. Before that, he covered the economics beat for news magazines. All content of “Growth Mail” represents the opinion of Gary Alexander
Important Disclosures:
Although information in these reports has been obtained from and is based upon sources that Navellier believes to be reliable, Navellier does not guarantee its accuracy and it may be incomplete or condensed. All opinions and estimates constitute Navellier’s judgment as of the date the report was created and are subject to change without notice. These reports are for informational purposes only and are not a solicitation for the purchase or sale of a security. Any decision to purchase securities mentioned in these reports must take into account existing public information on such securities or any registered prospectus.To the extent permitted by law, neither Navellier & Associates, Inc., nor any of its affiliates, agents, or service providers assumes any liability or responsibility nor owes any duty of care for any consequences of any person acting or refraining to act in reliance on the information contained in this communication or for any decision based on it.
Past performance is no indication of future results. Investment in securities involves significant risk and has the potential for partial or complete loss of funds invested. It should not be assumed that any securities recommendations made by Navellier. in the future will be profitable or equal the performance of securities made in this report. Dividend payments are not guaranteed. The amount of a dividend payment, if any, can vary over time and issuers may reduce dividends paid on securities in the event of a recession or adverse event affecting a specific industry or issuer.
None of the stock information, data, and company information presented herein constitutes a recommendation by Navellier or a solicitation to buy or sell any securities. Any specific securities identified and described do not represent all of the securities purchased, sold, or recommended for advisory clients. The holdings identified do not represent all of the securities purchased, sold, or recommended for advisory clients and the reader should not assume that investments in the securities identified and discussed were or will be profitable.
Information presented is general information that does not take into account your individual circumstances, financial situation, or needs, nor does it present a personalized recommendation to you. Individual stocks presented may not be suitable for every investor. Investment in securities involves significant risk and has the potential for partial or complete loss of funds invested. Investment in fixed income securities has the potential for the investment return and principal value of an investment to fluctuate so that an investor’s holdings, when redeemed, may be worth less than their original cost.
One cannot invest directly in an index. Index is unmanaged and index performance does not reflect deduction of fees, expenses, or taxes. Presentation of Index data does not reflect a belief by Navellier that any stock index constitutes an investment alternative to any Navellier equity strategy or is necessarily comparable to such strategies. Among the most important differences between the Indices and Navellier strategies are that the Navellier equity strategies may (1) incur material management fees, (2) concentrate its investments in relatively few stocks, industries, or sectors, (3) have significantly greater trading activity and related costs, and (4) be significantly more or less volatile than the Indices.
ETF Risk: We may invest in exchange traded funds (“ETFs”) and some of our investment strategies are generally fully invested in ETFs. Like traditional mutual funds, ETFs charge asset-based fees, but they generally do not charge initial sales charges or redemption fees and investors typically pay only customary brokerage fees to buy and sell ETF shares. The fees and costs charged by ETFs held in client accounts will not be deducted from the compensation the client pays Navellier. ETF prices can fluctuate up or down, and a client account could lose money investing in an ETF if the prices of the securities owned by the ETF go down. ETFs are subject to additional risks:
- ETF shares may trade above or below their net asset value;
- An active trading market for an ETF’s shares may not develop or be maintained;
- The value of an ETF may be more volatile than the underlying portfolio of securities the ETF is designed to track;
- The cost of owning shares of the ETF may exceed those a client would incur by directly investing in the underlying securities; and
- Trading of an ETF’s shares may be halted if the listing exchange’s officials deem it appropriate, the shares are delisted from the exchange, or the activation of market-wide “circuit breakers” (which are tied to large decreases in stock prices) halts stock trading generally.
Grader Disclosures: Investment in equity strategies involves substantial risk and has the potential for partial or complete loss of funds invested. The sample portfolio and any accompanying charts are for informational purposes only and are not to be construed as a solicitation to buy or sell any financial instrument and should not be relied upon as the sole factor in an investment making decision. As a matter of normal and important disclosures to you, as a potential investor, please consider the following: The performance presented is not based on any actual securities trading, portfolio, or accounts, and the reported performance of the A, B, C, D, and F portfolios (collectively the “model portfolios”) should be considered mere “paper” or pro forma performance results based on Navellier’s research.
Investors evaluating any of Navellier & Associates, Inc.’s, (or its affiliates’) Investment Products must not use any information presented here, including the performance figures of the model portfolios, in their evaluation of any Navellier Investment Products. Navellier Investment Products include the firm’s mutual funds and managed accounts. The model portfolios, charts, and other information presented do not represent actual funded trades and are not actual funded portfolios. There are material differences between Navellier Investment Products’ portfolios and the model portfolios, research, and performance figures presented here. The model portfolios and the research results (1) may contain stocks or ETFs that are illiquid and difficult to trade; (2) may contain stock or ETF holdings materially different from actual funded Navellier Investment Product portfolios; (3) include the reinvestment of all dividends and other earnings, estimated trading costs, commissions, or management fees; and, (4) may not reflect prices obtained in an actual funded Navellier Investment Product portfolio. For these and other reasons, the reported performances of model portfolios do not reflect the performance results of Navellier’s actually funded and traded Investment Products. In most cases, Navellier’s Investment Products have materially lower performance results than the performances of the model portfolios presented.
This report contains statements that are, or may be considered to be, forward-looking statements. All statements that are not historical facts, including statements about our beliefs or expectations, are “forward-looking statements” within the meaning of The U.S. Private Securities Litigation Reform Act of 1995. These statements may be identified by such forward-looking terminology as “expect,” “estimate,” “plan,” “intend,” “believe,” “anticipate,” “may,” “will,” “should,” “could,” “continue,” “project,” or similar statements or variations of such terms. Our forward-looking statements are based on a series of expectations, assumptions, and projections, are not guarantees of future results or performance, and involve substantial risks and uncertainty as described in Form ADV Part 2A of our filing with the Securities and Exchange Commission (SEC), which is available at www.adviserinfo.sec.gov or by requesting a copy by emailing info@navellier.com. All of our forward-looking statements are as of the date of this report only. We can give no assurance that such expectations or forward-looking statements will prove to be correct. Actual results may differ materially. You are urged to carefully consider all such factors.
FEDERAL TAX ADVICE DISCLAIMER: As required by U.S. Treasury Regulations, you are informed that, to the extent this presentation includes any federal tax advice, the presentation is not written by Navellier to be used, and cannot be used, for the purpose of avoiding federal tax penalties. Navellier does not advise on any income tax requirements or issues. Use of any information presented by Navellier is for general information only and does not represent tax advice either express or implied. You are encouraged to seek professional tax advice for income tax questions and assistance.
IMPORTANT NEWSLETTER DISCLOSURE:The hypothetical performance results for investment newsletters that are authored or edited by Louis Navellier, including Louis Navellier’s Growth Investor, Louis Navellier’s Breakthrough Stocks, Louis Navellier’s Accelerated Profits, and Louis Navellier’s Platinum Club, are not based on any actual securities trading, portfolio, or accounts, and the newsletters’ reported hypothetical performances should be considered mere “paper” or proforma hypothetical performance results and are not actual performance of real world trades. Navellier & Associates, Inc. does not have any relation to or affiliation with the owner of these newsletters. There are material differences between Navellier Investment Products’ portfolios and the InvestorPlace Media, LLC newsletter portfolios authored by Louis Navellier. The InvestorPlace Media, LLC newsletters contain hypothetical performance that do not include transaction costs, advisory fees, or other fees a client might incur if actual investments and trades were being made by an investor. As a result, newsletter performance should not be used to evaluate Navellier Investment services which are separate and different from the newsletters. The owner of the newsletters is InvestorPlace Media, LLC and any questions concerning the newsletters, including any newsletter advertising or hypothetical Newsletter performance claims, (which are calculated solely by Investor Place Media and not Navellier) should be referred to InvestorPlace Media, LLC at (800) 718-8289.
Please note that Navellier & Associates and the Navellier Private Client Group are managed completely independent of the newsletters owned and published by InvestorPlace Media, LLC and written and edited by Louis Navellier, and investment performance of the newsletters should in no way be considered indicative of potential future investment performance for any Navellier & Associates separately managed account portfolio. Potential investors should consult with their financial advisor before investing in any Navellier Investment Product.
Navellier claims compliance with Global Investment Performance Standards (GIPS). To receive a complete list and descriptions of Navellier’s composites and/or a presentation that adheres to the GIPS standards, please contact Navellier or click here. It should not be assumed that any securities recommendations made by Navellier & Associates, Inc. in the future will be profitable or equal the performance of securities made in this report.
FactSet Disclosure: Navellier does not independently calculate the statistical information included in the attached report. The calculation and the information are provided by FactSet, a company not related to Navellier. Although information contained in the report has been obtained from FactSet and is based on sources Navellier believes to be reliable, Navellier does not guarantee its accuracy, and it may be incomplete or condensed. The report and the related FactSet sourced information are provided on an “as is” basis. The user assumes the entire risk of any use made of this information. Investors should consider the report as only a single factor in making their investment decision. The report is for informational purposes only and is not intended as an offer or solicitation for the purchase or sale of a security. FactSet sourced information is the exclusive property of FactSet. Without prior written permission of FactSet, this information may not be reproduced, disseminated or used to create any financial products. All indices are unmanaged and performance of the indices include reinvestment of dividends and interest income, unless otherwise noted, are not illustrative of any particular investment and an investment cannot be made in any index. Past performance is no guarantee of future results.