by Gary Alexander
June 23, 2026
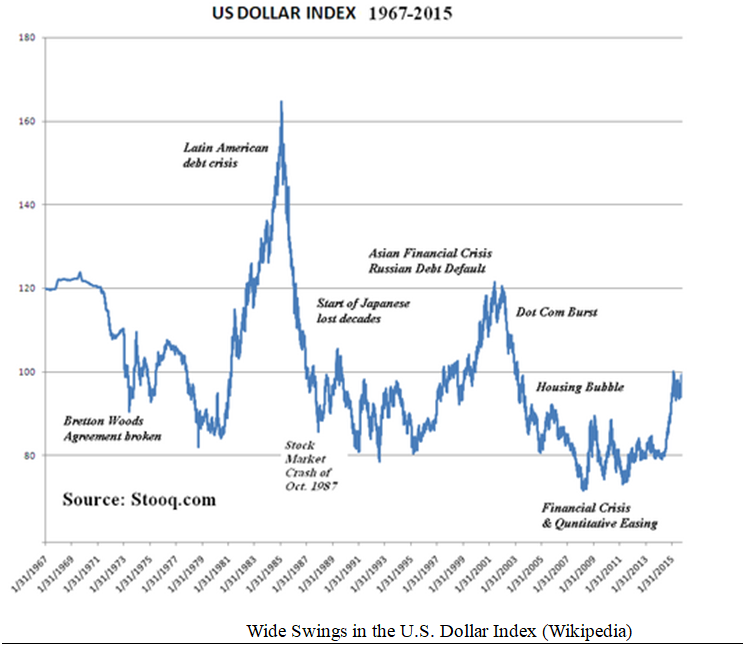
Very quietly, the U.S. dollar has reached a 15-month high as of last Friday, with the U.S. Dollar Index (DXY) reaching 101, slightly above its founding value of 100 some 53-years ago, in 1973 – about two years after President Nixon closed the gold window on August 15, 1971. Does that mean the dollar has “held steady” for over 50-years, despite all its ups and downs? Not quite. Even though the dollar has fallen and risen in great arcs, the dollar has lost 99% of its value to gold, and 88% in purchasing power.
When calling the dollar “strong” or “weak,” we refer only to other paper moneys, not gold. A quick look at the Dollar Index (below), shows a steep fall in the 1970s, then a bubble peak in early 1985, reaching a record high 164.72 in February 1985, before the Plaza Accords punctured that bubble. The DXY fell 50% by 1990, then reached an all-time low of 70.7 at the start of the 2008 financial crisis, on March 16, 2008.
Graphs are for illustrative and discussion purposes only. Please read important disclosures at the end of this commentary.
It is important to realize this Dollar Index is not comprehensive, nor balanced. It is a “trade-weighted” currency index, yet it oddly ignores two of our leading trading partners, China’s Yuan and Mexico’s Peso.
The DXY originally included the German Mark, French Franc, Italian Lira and other European paper, but those all became subsumed into the Euro in 1999, giving the European currency the heaviest weighting:
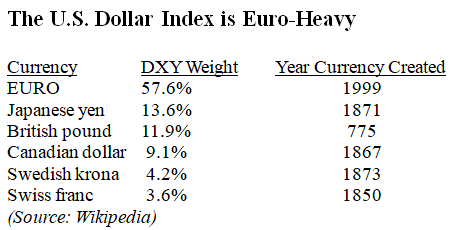
Except for the ancient British pound sterling, the U.S. Dollar is the oldest currency on this list, dating to our Coinage Act of 1792, but in the 8th century, 240-silver pence weighed a pound, hence the arcane math of 12-pence making a shilling, and 20-shillings composing “pound [of] sterling” (i.e., a pound of silver).
Alchemy was the medieval search for how to create gold out of base metals, like lead. Today, that quest has expanded to the alchemy of creating value using paper (currencies) or computer code (Bitcoin).

The gold dollar wasn’t America’s first dollar. As we approach our nation’s 250th birthday 11-days from now, we would do well to recall another vital event falling in July 1776. As mentioned here before, our Grand Paper Money Experiment began on July 22, 1776, when the Continental Congress issued $2-million in new bills, known as Continentals, bearing the inscription, “The United Colonies.” Unbacked by gold or any other hard asset, the bills led to almost immediate inflation. By 1778, it took $6 in paper to buy what $1 bought in 1776. By November 1779, it took $40 to buy what $1 bought in 1776. As General George Washington said, “A wagonload of currency will hardly purchase a wagonload of provisions.”
The Continental failed and left our young nation with a hefty war debt. Chastened by this experience of that Continental currency, the U.S. Constitution prescribed: “No State shall…make any Thing but gold and silver Coin a Tender in Payment of Debts,” and America drafted a series of gold and silver coins.

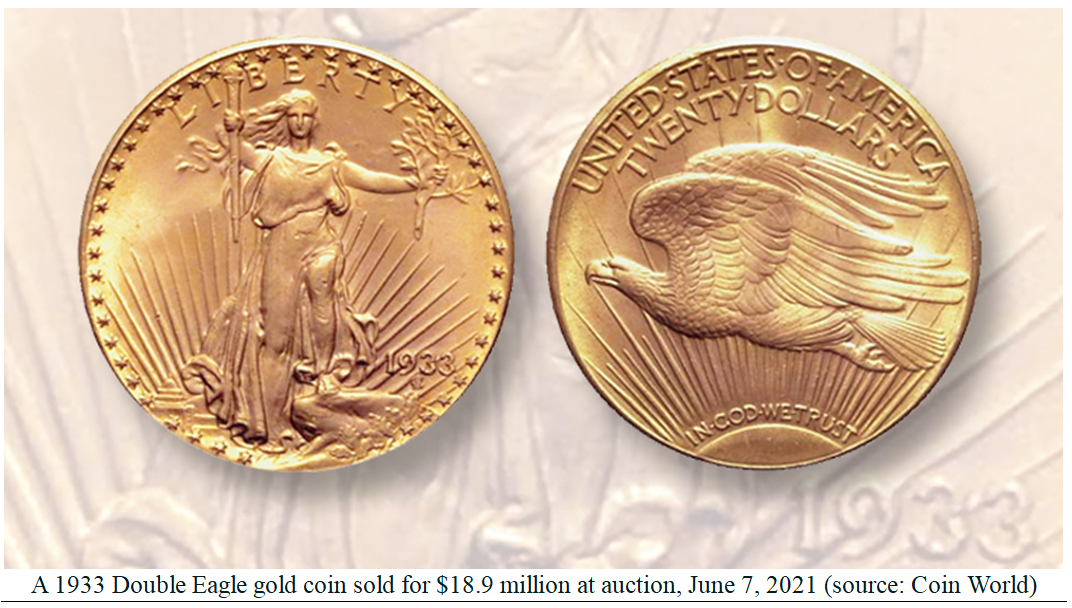
The U.S. didn’t abandon gold in one step. In June 1933, America officially went off the gold standard for domestic convertibility, but nations still traded in gold. The newly minted 1933 $20-gold Double Eagles were almost all confiscated, melted and destroyed, but a dozen remain. On June 7, 2021, one sold for a record $18.9-million. Once owned by Egypt’s King Farouk, it was later seized in a Secret Service sting. With a face value of $20, this one-of-a-kind gem nearly made $19-million at auction. Beat that, Bitcoin!
The most important monetary milestone of our lifetime comes later this summer – the 55th anniversary of President Nixon “closing the gold window” on August 15, 1971 – a Sunday night. Before that night, gold’s price was fixed at $35 per ounce. It’s now about $4,200 – or about 120 times higher than pre-1971.
Not bad. In the same 55-years, the Dow is up 59-fold, and the S&P 500 is up 76-fold. That’s not entirely fair, since stocks pay dividends and gold is not designed to compete with stocks. However, gold is very well designed to compete with paper money or bonds, and gold is doing an excellent job in that regard.
Central Banks Are Loading up on Gold – Again
After a slight retreat in central bank gold buying last year, the world’s central banks are once again loading up “real money” (vs. all forms of paper currencies). If you want to know why, the British newspaper, the Daily Telegraph, blames it all on President Trump’s financial and political policies:
“Gold has over-taken US bonds to become central banks’ favorite investment, as Donald Trump rattles faith in America’s political stability.” – From the Daily Telegraph (Britain), June 2, 2026
The first fact is true, as the dollar value of gold has risen so rapidly in the last two-years it has surpassed the face value of all U.S. bonds held by world central banks. The Telegraph admits as much, writing:
“The share of gold in central banks’ official holdings of foreign currencies climbed to 27% last year, surpassing U.S. Treasuries at 22%, according to a report from the European Central Bank,” since “The cost of a troy ounce rose by 65% last year.” – The Telegraph, June 2, 2026
However, the second half of the Telegraph’s analysis ‘telegraphs’ their bias. Even though the Telegraph is labeled as a “right-wing, conservative” newspaper, they betray no alliance with Republicans – or the facts – when they blame the current president rather than his predecessor for recent rapid surges in gold buying.
The Telegraph fails to research the simple facts, as the vast majority of central bank gold buying came in 2022-24, the Biden years. From a base average of 500-metric tons per year of central bank gold buying from 2011 to 2021, annual gold purchases doubled to over 1,000-tons per year in the Biden years. Then, in 2025, Trump’s first-year, central bank gold buying fell to 863-metric tons before rising again this year.
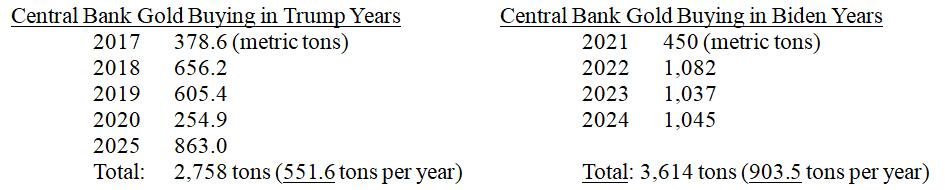
So, if anything, the “loss of faith in America’s political stability” came in the Biden years, not Trump’s.
The peak wave of central bank gold buying from 2022 to 2024 was caused by: (1) high inflation due to President Biden’s spending and stimulus programs, including $6-trillion 2021 stimulus packages feeding an already-robust economy, fueling 9% inflation rates; (2) the Russian attack on Ukraine in early 2022, and (3) rising Middle East tensions after Hamas invaded Israel in October 2023, when gold was $1,900.
Then came the separation of real money from the pretenders: Bitcoin peaked at over $126,000 last October 5, and it is now priced at about half that amount. In those same 8+ months, gold rose a small amount. When I talk to young folk enamored with crypto, their three-main arguments seem to be: (1) Crypto will rise again, far faster than stocks or gold; (2) Crypto is the only private money, with holdings unseen or untracked by government, and (3) governments can’t inflate Bitcoin. The supply is limited.
These arguments have some merit, but in the end, cryptocurrencies are “mined” from energy-burning computer code stored in massive data-centers. Crypto’s advantages are far more proven, over time, by gold’s 4,000-year track record than Bitcoin’s 15-years, so I will opt for gold and silver coins I can hold.
All content above represents the opinion of Gary Alexander of Navellier & Associates, Inc.
Also In This Issue
A Look Ahead by Louis Navellier
President Trump Entered a “Shark Tank” at the G-7 Summit
Income Mail by Bryan Perry
Crude Oil Price Correction Will Crush Headline Inflation
Growth Mail by Gary Alexander
The Dream of Turning Lead (or Paper) into Gold Still Lives
Global Mail by Ivan Martchev
A Round-Trip Ride in Space Exploration Stocks
Sector Spotlight by Jason Bodner
Seismic Market Changes Can Seem Boring (at First)
View Full Archive
Read Past Issues Here
About The Author

Gary Alexander
SENIOR EDITOR
Gary Alexander has been Senior Writer at Navellier since 2009. He edits Navellier’s weekly Marketmail and writes a weekly Growth Mail column, in which he uses market history to support the case for growth stocks. For the previous 20-years before joining Navellier, he was Senior Executive Editor at InvestorPlace Media (formerly Phillips Publishing), where he worked with several leading investment analysts, including Louis Navellier (since 1997), helping launch Louis Navellier’s Blue Chip Growth and Global Growth newsletters.
Prior to that, Gary edited Wealth Magazine and Gold Newsletter and wrote various investment research reports for Jefferson Financial in New Orleans in the 1980s. He began his financial newsletter career with KCI Communications in 1980, where he served as consulting editor for Personal Finance newsletter while serving as general manager of KCI’s Alexandria House book division. Before that, he covered the economics beat for news magazines. All content of “Growth Mail” represents the opinion of Gary Alexander
Important Disclosures:
Although information in these reports has been obtained from and is based upon sources that Navellier believes to be reliable, Navellier does not guarantee its accuracy and it may be incomplete or condensed. All opinions and estimates constitute Navellier’s judgment as of the date the report was created and are subject to change without notice. These reports are for informational purposes only and are not a solicitation for the purchase or sale of a security. Any decision to purchase securities mentioned in these reports must take into account existing public information on such securities or any registered prospectus.To the extent permitted by law, neither Navellier & Associates, Inc., nor any of its affiliates, agents, or service providers assumes any liability or responsibility nor owes any duty of care for any consequences of any person acting or refraining to act in reliance on the information contained in this communication or for any decision based on it.
Past performance is no indication of future results. Investment in securities involves significant risk and has the potential for partial or complete loss of funds invested. It should not be assumed that any securities recommendations made by Navellier. in the future will be profitable or equal the performance of securities made in this report. Dividend payments are not guaranteed. The amount of a dividend payment, if any, can vary over time and issuers may reduce dividends paid on securities in the event of a recession or adverse event affecting a specific industry or issuer.
None of the stock information, data, and company information presented herein constitutes a recommendation by Navellier or a solicitation to buy or sell any securities. Any specific securities identified and described do not represent all of the securities purchased, sold, or recommended for advisory clients. The holdings identified do not represent all of the securities purchased, sold, or recommended for advisory clients and the reader should not assume that investments in the securities identified and discussed were or will be profitable.
Information presented is general information that does not take into account your individual circumstances, financial situation, or needs, nor does it present a personalized recommendation to you. Individual stocks presented may not be suitable for every investor. Investment in securities involves significant risk and has the potential for partial or complete loss of funds invested. Investment in fixed income securities has the potential for the investment return and principal value of an investment to fluctuate so that an investor’s holdings, when redeemed, may be worth less than their original cost.
One cannot invest directly in an index. Index is unmanaged and index performance does not reflect deduction of fees, expenses, or taxes. Presentation of Index data does not reflect a belief by Navellier that any stock index constitutes an investment alternative to any Navellier equity strategy or is necessarily comparable to such strategies. Among the most important differences between the Indices and Navellier strategies are that the Navellier equity strategies may (1) incur material management fees, (2) concentrate its investments in relatively few stocks, industries, or sectors, (3) have significantly greater trading activity and related costs, and (4) be significantly more or less volatile than the Indices.
ETF Risk: We may invest in exchange traded funds (“ETFs”) and some of our investment strategies are generally fully invested in ETFs. Like traditional mutual funds, ETFs charge asset-based fees, but they generally do not charge initial sales charges or redemption fees and investors typically pay only customary brokerage fees to buy and sell ETF shares. The fees and costs charged by ETFs held in client accounts will not be deducted from the compensation the client pays Navellier. ETF prices can fluctuate up or down, and a client account could lose money investing in an ETF if the prices of the securities owned by the ETF go down. ETFs are subject to additional risks:
- ETF shares may trade above or below their net asset value;
- An active trading market for an ETF’s shares may not develop or be maintained;
- The value of an ETF may be more volatile than the underlying portfolio of securities the ETF is designed to track;
- The cost of owning shares of the ETF may exceed those a client would incur by directly investing in the underlying securities; and
- Trading of an ETF’s shares may be halted if the listing exchange’s officials deem it appropriate, the shares are delisted from the exchange, or the activation of market-wide “circuit breakers” (which are tied to large decreases in stock prices) halts stock trading generally.
Grader Disclosures: Investment in equity strategies involves substantial risk and has the potential for partial or complete loss of funds invested. The sample portfolio and any accompanying charts are for informational purposes only and are not to be construed as a solicitation to buy or sell any financial instrument and should not be relied upon as the sole factor in an investment making decision. As a matter of normal and important disclosures to you, as a potential investor, please consider the following: The performance presented is not based on any actual securities trading, portfolio, or accounts, and the reported performance of the A, B, C, D, and F portfolios (collectively the “model portfolios”) should be considered mere “paper” or pro forma performance results based on Navellier’s research.
Investors evaluating any of Navellier & Associates, Inc.’s, (or its affiliates’) Investment Products must not use any information presented here, including the performance figures of the model portfolios, in their evaluation of any Navellier Investment Products. Navellier Investment Products include the firm’s mutual funds and managed accounts. The model portfolios, charts, and other information presented do not represent actual funded trades and are not actual funded portfolios. There are material differences between Navellier Investment Products’ portfolios and the model portfolios, research, and performance figures presented here. The model portfolios and the research results (1) may contain stocks or ETFs that are illiquid and difficult to trade; (2) may contain stock or ETF holdings materially different from actual funded Navellier Investment Product portfolios; (3) include the reinvestment of all dividends and other earnings, estimated trading costs, commissions, or management fees; and, (4) may not reflect prices obtained in an actual funded Navellier Investment Product portfolio. For these and other reasons, the reported performances of model portfolios do not reflect the performance results of Navellier’s actually funded and traded Investment Products. In most cases, Navellier’s Investment Products have materially lower performance results than the performances of the model portfolios presented.
This report contains statements that are, or may be considered to be, forward-looking statements. All statements that are not historical facts, including statements about our beliefs or expectations, are “forward-looking statements” within the meaning of The U.S. Private Securities Litigation Reform Act of 1995. These statements may be identified by such forward-looking terminology as “expect,” “estimate,” “plan,” “intend,” “believe,” “anticipate,” “may,” “will,” “should,” “could,” “continue,” “project,” or similar statements or variations of such terms. Our forward-looking statements are based on a series of expectations, assumptions, and projections, are not guarantees of future results or performance, and involve substantial risks and uncertainty as described in Form ADV Part 2A of our filing with the Securities and Exchange Commission (SEC), which is available at www.adviserinfo.sec.gov or by requesting a copy by emailing info@navellier.com. All of our forward-looking statements are as of the date of this report only. We can give no assurance that such expectations or forward-looking statements will prove to be correct. Actual results may differ materially. You are urged to carefully consider all such factors.
FEDERAL TAX ADVICE DISCLAIMER: As required by U.S. Treasury Regulations, you are informed that, to the extent this presentation includes any federal tax advice, the presentation is not written by Navellier to be used, and cannot be used, for the purpose of avoiding federal tax penalties. Navellier does not advise on any income tax requirements or issues. Use of any information presented by Navellier is for general information only and does not represent tax advice either express or implied. You are encouraged to seek professional tax advice for income tax questions and assistance.
IMPORTANT NEWSLETTER DISCLOSURE:The hypothetical performance results for investment newsletters that are authored or edited by Louis Navellier, including Louis Navellier’s Growth Investor, Louis Navellier’s Breakthrough Stocks, Louis Navellier’s Accelerated Profits, and Louis Navellier’s Platinum Club, are not based on any actual securities trading, portfolio, or accounts, and the newsletters’ reported hypothetical performances should be considered mere “paper” or proforma hypothetical performance results and are not actual performance of real world trades. Navellier & Associates, Inc. does not have any relation to or affiliation with the owner of these newsletters. There are material differences between Navellier Investment Products’ portfolios and the InvestorPlace Media, LLC newsletter portfolios authored by Louis Navellier. The InvestorPlace Media, LLC newsletters contain hypothetical performance that do not include transaction costs, advisory fees, or other fees a client might incur if actual investments and trades were being made by an investor. As a result, newsletter performance should not be used to evaluate Navellier Investment services which are separate and different from the newsletters. The owner of the newsletters is InvestorPlace Media, LLC and any questions concerning the newsletters, including any newsletter advertising or hypothetical Newsletter performance claims, (which are calculated solely by Investor Place Media and not Navellier) should be referred to InvestorPlace Media, LLC at (800) 718-8289.
Please note that Navellier & Associates and the Navellier Private Client Group are managed completely independent of the newsletters owned and published by InvestorPlace Media, LLC and written and edited by Louis Navellier, and investment performance of the newsletters should in no way be considered indicative of potential future investment performance for any Navellier & Associates separately managed account portfolio. Potential investors should consult with their financial advisor before investing in any Navellier Investment Product.
Navellier claims compliance with Global Investment Performance Standards (GIPS). To receive a complete list and descriptions of Navellier’s composites and/or a presentation that adheres to the GIPS standards, please contact Navellier or click here. It should not be assumed that any securities recommendations made by Navellier & Associates, Inc. in the future will be profitable or equal the performance of securities made in this report.
FactSet Disclosure: Navellier does not independently calculate the statistical information included in the attached report. The calculation and the information are provided by FactSet, a company not related to Navellier. Although information contained in the report has been obtained from FactSet and is based on sources Navellier believes to be reliable, Navellier does not guarantee its accuracy, and it may be incomplete or condensed. The report and the related FactSet sourced information are provided on an “as is” basis. The user assumes the entire risk of any use made of this information. Investors should consider the report as only a single factor in making their investment decision. The report is for informational purposes only and is not intended as an offer or solicitation for the purchase or sale of a security. FactSet sourced information is the exclusive property of FactSet. Without prior written permission of FactSet, this information may not be reproduced, disseminated or used to create any financial products. All indices are unmanaged and performance of the indices include reinvestment of dividends and interest income, unless otherwise noted, are not illustrative of any particular investment and an investment cannot be made in any index. Past performance is no guarantee of future results.