by Jason Bodner
May 19, 2026
The Coelacanth is a fish declared to have gone extinct some 66-million years ago. Then, in 1938, a fisherman pulled one out of the Indian Ocean.
The fossil record said this was impossible, but the fisherman’s net said otherwise.
The lesson is simple: Evidence in your hands matters more than a scientific consensus written in books.
This week, the screaming headlines and the quiet money flows told two very different stories. For investors, the question is the same one those scientists faced: Which one will you believe?
Here’s What the Headlines Wanted You to Focus On
The mainstream narrative stitched five-major events last week into one bearish conclusion.
- Consumer inflation accelerated to 3.8%, the highest rate since May 2023.
- Wholesale prices ran even hotter, at 6% annualized, the worst reading in nearly four-years.
- Real wages turned negative for the first time in three-years.
- Kevin Warsh was confirmed as Fed chair by the narrowest margin in history.
- President Trump rejected Iran’s peace proposal, so the Strait of Hormuz remained shut.
Read those headlines in any order you wish and you would likely arrive at the same conclusion: Last week should have been a risk-off week, a time of retrenchment and fear of a market turn-down.
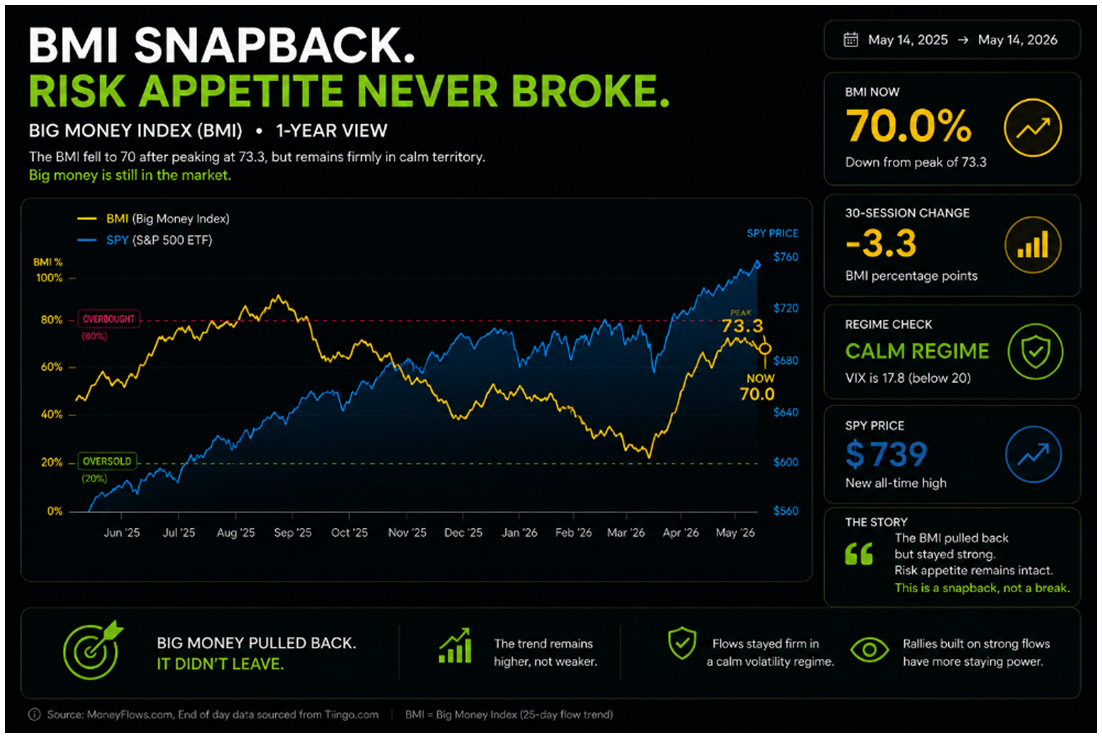
Instead, while headlines screamed danger, the longer-term flow trend kept grinding higher. The BMI climbed from roughly 41% in early April to 73% (now 70%), among the sharpest snap-backs in 36-years.
Graphs are for illustrative and discussion purposes only. Please read important disclosures at the end of this commentary.
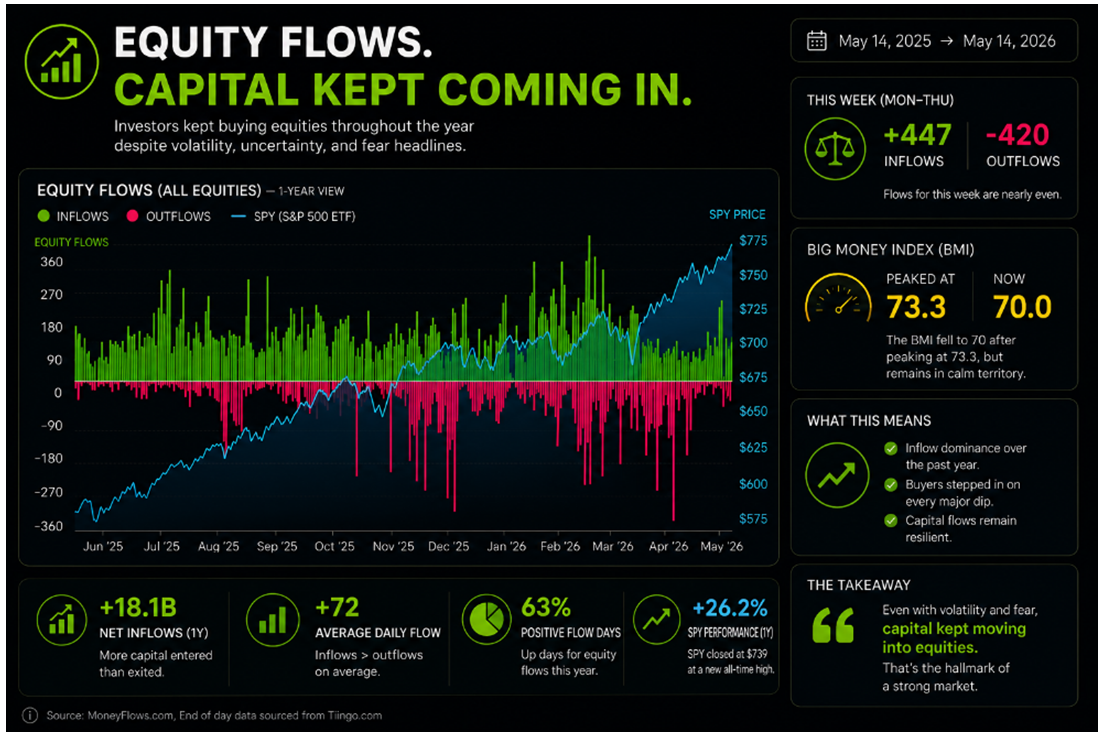
The ETF version of the BMI pushed to a fresh high above 83%. SPY also printed another all-time high. The VIX (volatility) stayed contained, near 18, despite all the noise. However, flows were virtually even:
Graphs are for illustrative and discussion purposes only. Please read important disclosures at the end of this commentary.
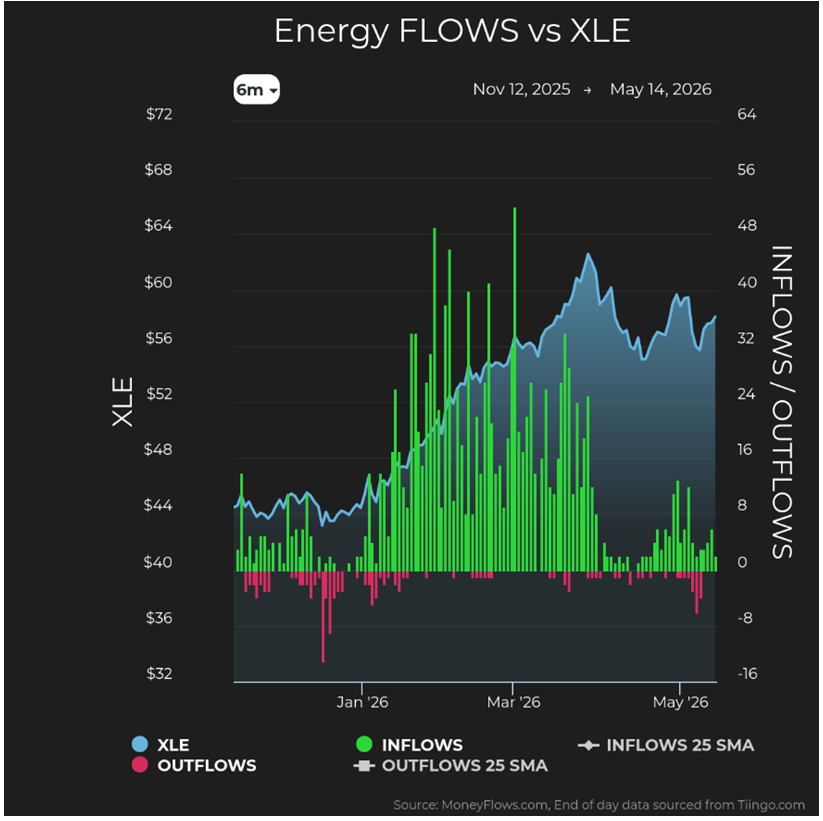
Energy saw 15-inflows and zero outflows, and the AI infrastructure complex continued attracting capital.
Then, on Thursday, Cerebras Systems (CBRS) went public in the largest U.S. technology IPO since Uber. The deal was reportedly 20-times over-subscribed, priced well above the expected range at $185. It opened at near $350, and finished the session at $311, or 68% above expectations. This means institutional capital handed a Nvidia competitor a $95-billion valuation on the same day inflation data kept the Fed hawkish.
That is not how risk-off markets behave.
When the narrative turns uniformly bearish while smart money keeps buying, the flows are usually seeing something the headlines have not caught up to yet.
First, let’s look at what got bought. Energy dominated the inflow lists for the second-consecutive week. With the Strait of Hormuz closed and oil prices elevated, the energy sector is catching three tail-winds at once – an inflation hedge, a value rotation and the growing AI power-demand story.
Graphs are for illustrative and discussion purposes only. Please read important disclosures at the end of this commentary.
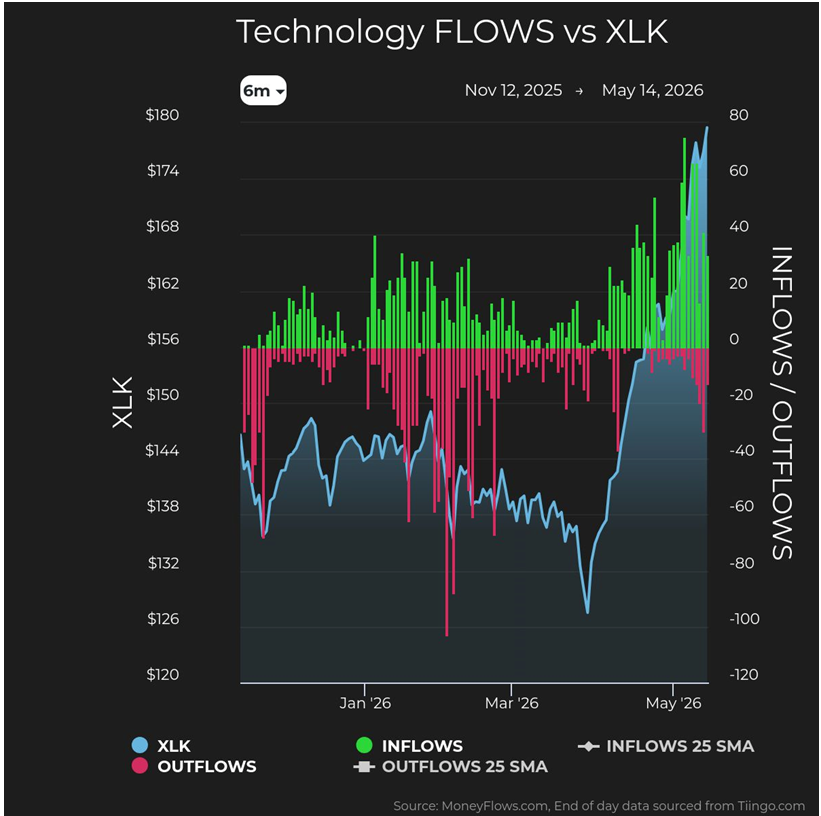
Meanwhile, the AI infrastructure complex kept attracting capital across, including the picks-and-shovels of the build-out: semiconductor equipment, memory, networking, and data-center power.
The CBRS IPO reception only reinforced the theme.
Graphs are for illustrative and discussion purposes only. Please read important disclosures at the end of this commentary.
Now look at what got sold…
The entire housing complex showed up on the outflow list. Twelve names. Builders, home improvement, pool and yard equipment, materials, online listings. Zero inflows across the category. IT services and consulting continued repricing for a fourth-straight week. The market is increasingly treating AI as a hardware and infrastructure story while viewing the implementation services as a disruption target.
Put it together and the call becomes clear. Capital is positioning for sticky inflation, a Fed that cannot ease aggressively, oil that stays bid, AI capex that keeps compounding, and a consumer getting squeezed.
The Historical Backdrop to the Current Situation
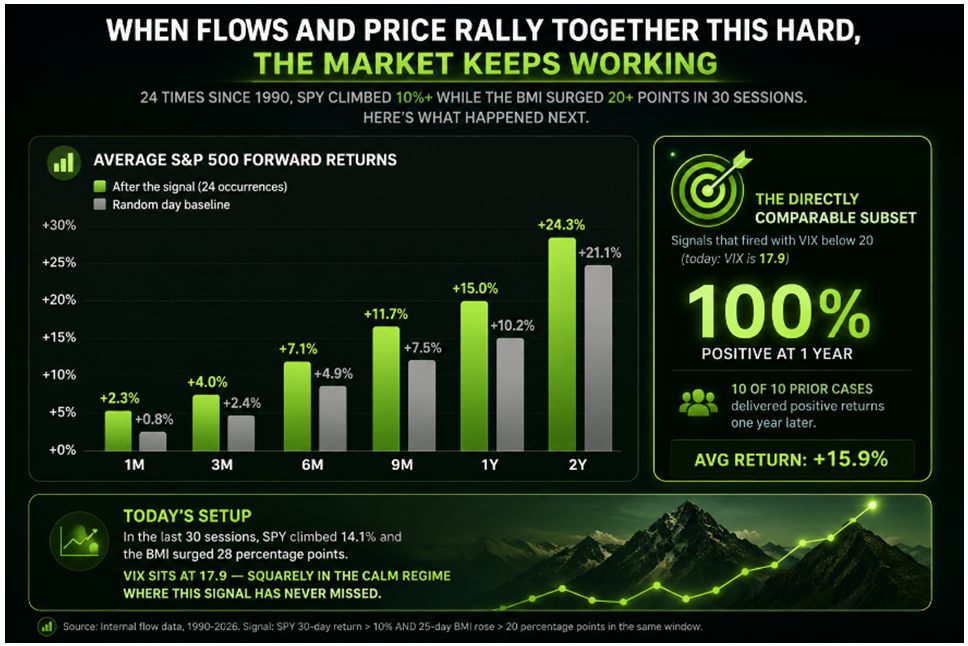
When something unusual happens, I go back through the data to see where else it showed up, and the current setup has a very specific fingerprint: SPY climbed 14.1% in the last 30-trading sessions while the 25-day BMI surged 28-percentage points over the same stretch: Price and flow data rallying together.
Going back to 1990, this pattern, of SPY up 10% or more while BMI rises at least 20-points in 30-sessions has appeared 24-times, and here is what happened next, compared to a random (normal) day baseline:
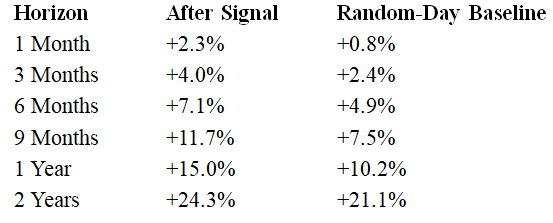
At every horizon, the signal materially outperformed the baseline.
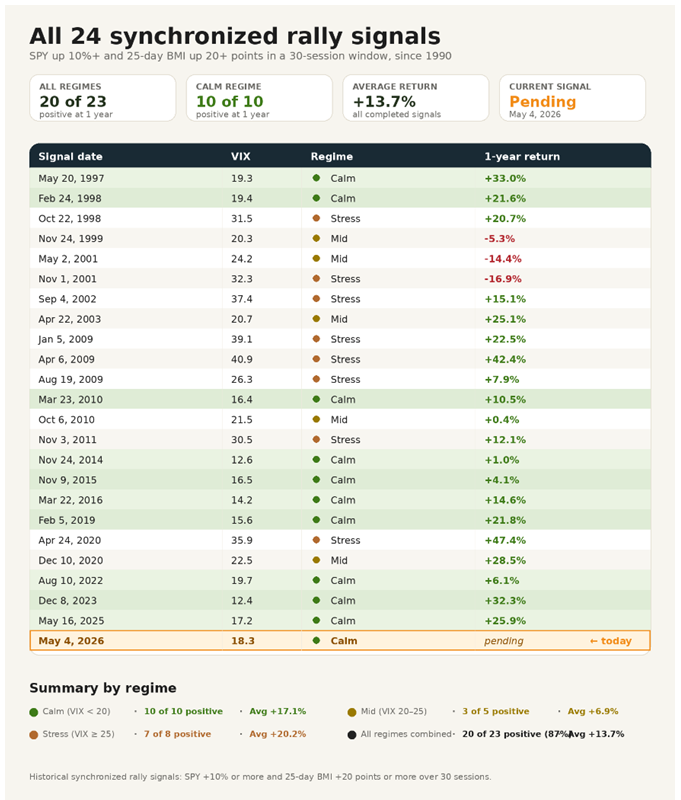
But the more interesting observation comes from separating those signals by volatility regime. Eleven of the 24-signals fired with the VIX below 20, which is where we sit today, around 17.3.
Every single one of those calm-regime signals produced a positive return one-year later.
Ten out of ten with fully mature data and zero misses – with an average gain of 15.9%.
Graphs are for illustrative and discussion purposes only. Please read important disclosures at the end of this commentary.
The failures in the broader sample mostly occurred during stress regimes when the VIX was already above 20 and markets were facing near panic conditions.
Graphs are for illustrative and discussion purposes only. Please read important disclosures at the end of this commentary.
These panic situations do not reflect today’s environment. Right now, flows are conviction-buying into a calm market which just absorbed the hottest inflation print-out in three-years without breaking.
That matters. Flow data isn’t infallible. Markets can stay irrational, and macro can overwhelm almost anything in the short term, but the clearest warning signs would be visible deterioration in the consumer, a further spike in oil if Hormuz remains closed, or widening credit spreads.
I’m watching the VIX. As long as it stays below 20, the calm-regime analog remains intact. Above 25, we enter a very different statistical neighborhood.
So, for now, the data says the rally still has legs.
Bottom Line: Ignore Screaming Headlines, Listen to Data Flows Whispering the Truth
The headlines this week told you the world is getting harder. But flows showed which trades might thrive in a harder world: energy, AI infrastructure, and the picks-and-shovels behind the build-out.
They also showed what is struggling: housing, consumer cyclicals, and businesses dependent on easy Fed policy and a strong consumer. So, the history is clear. When price and flows rally together this hard with a calm VIX, markets have historically continued higher. Ten times out of ten.
“It ain’t what you don’t know that gets you into trouble. It’s what you know for sure that just ain’t so.”
— Mark Twain
All content above represents the opinion of Jason Bodner of Navellier & Associates, Inc.
Also In This Issue
A Look Ahead by Louis Navellier
Inflation (and GDP) Soared in April
Income Mail by Bryan Perry
Trump Trip Triggers a Rare Pullback in the Super AI Tech Sector
Growth Mail by Gary Alexander
Is China’s Growth Dynamo Now Running on Empty?
Global Mail by Ivan Martchev
Quantifying a “Normal” Correction
Sector Spotlight by Jason Bodner
Headlines Scream, While Money Flows Whisper
View Full Archive
Read Past Issues Here

Jason Bodner
MARKETMAIL EDITOR FOR SECTOR SPOTLIGHT
Jason Bodner writes Sector Spotlight in the weekly Marketmail publication and has authored several white papers for the company. He is also Co-Founder of Macro Analytics for Professionals which produces proprietary equity accumulation and distribution research for its clients. Previously, Mr. Bodner served as Director of European Equity Derivatives for Cantor Fitzgerald Europe in London, then moved to the role of Head of Equity Derivatives North America for the same company in New York. He also served as S.V.P. Equity Derivatives for Jefferies, LLC. He received a B.S. in business administration in 1996, with honors, from Skidmore College as a member of the Periclean Honors Society. All content of “Sector Spotlight” represents the opinion of Jason Bodner
Important Disclosures:
Jason Bodner is a co-founder and co-owner of Mapsignals. Mr. Bodner is an independent contractor who is occasionally hired by Navellier & Associates to write an article and or provide opinions for possible use in articles that appear in Navellier & Associates weekly Market Mail. Mr. Bodner is not employed or affiliated with Louis Navellier, Navellier & Associates, Inc., or any other Navellier owned entity. The opinions and statements made here are those of Mr. Bodner and not necessarily those of any other persons or entities. This is not an endorsement, or solicitation or testimonial or investment advice regarding the BMI Index or any statements or recommendations or analysis in the article or the BMI Index or Mapsignals or its products or strategies.
Although information in these reports has been obtained from and is based upon sources that Navellier believes to be reliable, Navellier does not guarantee its accuracy and it may be incomplete or condensed. All opinions and estimates constitute Navellier’s judgment as of the date the report was created and are subject to change without notice. These reports are for informational purposes only and are not a solicitation for the purchase or sale of a security. Any decision to purchase securities mentioned in these reports must take into account existing public information on such securities or any registered prospectus.To the extent permitted by law, neither Navellier & Associates, Inc., nor any of its affiliates, agents, or service providers assumes any liability or responsibility nor owes any duty of care for any consequences of any person acting or refraining to act in reliance on the information contained in this communication or for any decision based on it.
Past performance is no indication of future results. Investment in securities involves significant risk and has the potential for partial or complete loss of funds invested. It should not be assumed that any securities recommendations made by Navellier. in the future will be profitable or equal the performance of securities made in this report. Dividend payments are not guaranteed. The amount of a dividend payment, if any, can vary over time and issuers may reduce dividends paid on securities in the event of a recession or adverse event affecting a specific industry or issuer.
None of the stock information, data, and company information presented herein constitutes a recommendation by Navellier or a solicitation to buy or sell any securities. Any specific securities identified and described do not represent all of the securities purchased, sold, or recommended for advisory clients. The holdings identified do not represent all of the securities purchased, sold, or recommended for advisory clients and the reader should not assume that investments in the securities identified and discussed were or will be profitable.
Information presented is general information that does not take into account your individual circumstances, financial situation, or needs, nor does it present a personalized recommendation to you. Individual stocks presented may not be suitable for every investor. Investment in securities involves significant risk and has the potential for partial or complete loss of funds invested. Investment in fixed income securities has the potential for the investment return and principal value of an investment to fluctuate so that an investor’s holdings, when redeemed, may be worth less than their original cost.
One cannot invest directly in an index. Index is unmanaged and index performance does not reflect deduction of fees, expenses, or taxes. Presentation of Index data does not reflect a belief by Navellier that any stock index constitutes an investment alternative to any Navellier equity strategy or is necessarily comparable to such strategies. Among the most important differences between the Indices and Navellier strategies are that the Navellier equity strategies may (1) incur material management fees, (2) concentrate its investments in relatively few stocks, industries, or sectors, (3) have significantly greater trading activity and related costs, and (4) be significantly more or less volatile than the Indices.
ETF Risk: We may invest in exchange traded funds (“ETFs”) and some of our investment strategies are generally fully invested in ETFs. Like traditional mutual funds, ETFs charge asset-based fees, but they generally do not charge initial sales charges or redemption fees and investors typically pay only customary brokerage fees to buy and sell ETF shares. The fees and costs charged by ETFs held in client accounts will not be deducted from the compensation the client pays Navellier. ETF prices can fluctuate up or down, and a client account could lose money investing in an ETF if the prices of the securities owned by the ETF go down. ETFs are subject to additional risks:
- ETF shares may trade above or below their net asset value;
- An active trading market for an ETF’s shares may not develop or be maintained;
- The value of an ETF may be more volatile than the underlying portfolio of securities the ETF is designed to track;
- The cost of owning shares of the ETF may exceed those a client would incur by directly investing in the underlying securities and;
- Trading of an ETF’s shares may be halted if the listing exchange’s officials deem it appropriate, the shares are delisted from the exchange, or the activation of market-wide “circuit breakers” (which are tied to large decreases in stock prices) halts stock trading generally.
Grader Disclosures: Investment in equity strategies involves substantial risk and has the potential for partial or complete loss of funds invested. The sample portfolio and any accompanying charts are for informational purposes only and are not to be construed as a solicitation to buy or sell any financial instrument and should not be relied upon as the sole factor in an investment making decision. As a matter of normal and important disclosures to you, as a potential investor, please consider the following: The performance presented is not based on any actual securities trading, portfolio, or accounts, and the reported performance of the A, B, C, D, and F portfolios (collectively the “model portfolios”) should be considered mere “paper” or pro forma performance results based on Navellier’s research.
Investors evaluating any of Navellier & Associates, Inc.’s, (or its affiliates’) Investment Products must not use any information presented here, including the performance figures of the model portfolios, in their evaluation of any Navellier Investment Products. Navellier Investment Products include the firm’s mutual funds and managed accounts. The model portfolios, charts, and other information presented do not represent actual funded trades and are not actual funded portfolios. There are material differences between Navellier Investment Products’ portfolios and the model portfolios, research, and performance figures presented here. The model portfolios and the research results (1) may contain stocks or ETFs that are illiquid and difficult to trade; (2) may contain stock or ETF holdings materially different from actual funded Navellier Investment Product portfolios; (3) include the reinvestment of all dividends and other earnings, estimated trading costs, commissions, or management fees; and, (4) may not reflect prices obtained in an actual funded Navellier Investment Product portfolio. For these and other reasons, the reported performances of model portfolios do not reflect the performance results of Navellier’s actually funded and traded Investment Products. In most cases, Navellier’s Investment Products have materially lower performance results than the performances of the model portfolios presented.
This report contains statements that are, or may be considered to be, forward-looking statements. All statements that are not historical facts, including statements about our beliefs or expectations, are “forward-looking statements” within the meaning of The U.S. Private Securities Litigation Reform Act of 1995. These statements may be identified by such forward-looking terminology as “expect,” “estimate,” “plan,” “intend,” “believe,” “anticipate,” “may,” “will,” “should,” “could,” “continue,” “project,” or similar statements or variations of such terms. Our forward-looking statements are based on a series of expectations, assumptions, and projections, are not guarantees of future results or performance, and involve substantial risks and uncertainty as described in Form ADV Part 2A of our filing with the Securities and Exchange Commission (SEC), which is available at www.adviserinfo.sec.gov or by requesting a copy by emailing info@navellier.com. All of our forward-looking statements are as of the date of this report only. We can give no assurance that such expectations or forward-looking statements will prove to be correct. Actual results may differ materially. You are urged to carefully consider all such factors.
FEDERAL TAX ADVICE DISCLAIMER: As required by U.S. Treasury Regulations, you are informed that, to the extent this presentation includes any federal tax advice, the presentation is not written by Navellier to be used, and cannot be used, for the purpose of avoiding federal tax penalties. Navellier does not advise on any income tax requirements or issues. Use of any information presented by Navellier is for general information only and does not represent tax advice either express or implied. You are encouraged to seek professional tax advice for income tax questions and assistance.
IMPORTANT NEWSLETTER DISCLOSURE:The hypothetical performance results for investment newsletters that are authored or edited by Louis Navellier, including Louis Navellier’s Growth Investor, Louis Navellier’s Breakthrough Stocks, Louis Navellier’s Accelerated Profits, and Louis Navellier’s Platinum Club, are not based on any actual securities trading, portfolio, or accounts, and the newsletters’ reported hypothetical performances should be considered mere “paper” or proforma hypothetical performance results and are not actual performance of real world trades. Navellier & Associates, Inc. does not have any relation to or affiliation with the owner of these newsletters. There are material differences between Navellier Investment Products’ portfolios and the InvestorPlace Media, LLC newsletter portfolios authored by Louis Navellier. The InvestorPlace Media, LLC newsletters contain hypothetical performance that do not include transaction costs, advisory fees, or other fees a client might incur if actual investments and trades were being made by an investor. As a result, newsletter performance should not be used to evaluate Navellier Investment services which are separate and different from the newsletters. The owner of the newsletters is InvestorPlace Media, LLC and any questions concerning the newsletters, including any newsletter advertising or hypothetical Newsletter performance claims, (which are calculated solely by Investor Place Media and not Navellier) should be referred to InvestorPlace Media, LLC at (800) 718-8289.
Please note that Navellier & Associates and the Navellier Private Client Group are managed completely independent of the newsletters owned and published by InvestorPlace Media, LLC and written and edited by Louis Navellier, and investment performance of the newsletters should in no way be considered indicative of potential future investment performance for any Navellier & Associates separately managed account portfolio. Potential investors should consult with their financial advisor before investing in any Navellier Investment Product.
Navellier claims compliance with Global Investment Performance Standards (GIPS). To receive a complete list and descriptions of Navellier’s composites and/or a presentation that adheres to the GIPS standards, please contact Navellier or click here. It should not be assumed that any securities recommendations made by Navellier & Associates, Inc. in the future will be profitable or equal the performance of securities made in this report.
FactSet Disclosure: Navellier does not independently calculate the statistical information included in the attached report. The calculation and the information are provided by FactSet, a company not related to Navellier. Although information contained in the report has been obtained from FactSet and is based on sources Navellier believes to be reliable, Navellier does not guarantee its accuracy, and it may be incomplete or condensed. The report and the related FactSet sourced information are provided on an “as is” basis. The user assumes the entire risk of any use made of this information. Investors should consider the report as only a single factor in making their investment decision. The report is for informational purposes only and is not intended as an offer or solicitation for the purchase or sale of a security. FactSet sourced information is the exclusive property of FactSet. Without prior written permission of FactSet, this information may not be reproduced, disseminated or used to create any financial products. All indices are unmanaged and performance of the indices include reinvestment of dividends and interest income, unless otherwise noted, are not illustrative of any particular investment and an investment cannot be made in any index. Past performance is no guarantee of future results.