by Ivan Martchev
April 28, 2026
April is not over, but we are already close to a 13% rise in the S&P 500 since March 30, closing Friday at a new all-time high. The market is trading like it has made a major bottom, after not pulling back much.
Investors read the current de-escalation in Iran as an end to the war, with the only thing likely to spoil the party, creating some type of correction, is restarting the war, followed by the oil price making new highs.
Iran’s leaders know about our November elections coming in the U.S., so they appear to be dragging their feet trying to get a better deal – as they know we want to wrap the war up. This is evident from the failed Islamabad talks. The Trump administration secured a three-week ceasefire in Lebanon (which was necessary for an Iran deal). Still, the key takeaway is oil is not flowing at a normal rate through the Strait of Hormuz and so the oil price will likely begin to respond with an upside bias this week.
Graphs are for illustrative and discussion purposes only. Please read important disclosures at the end of this commentary.
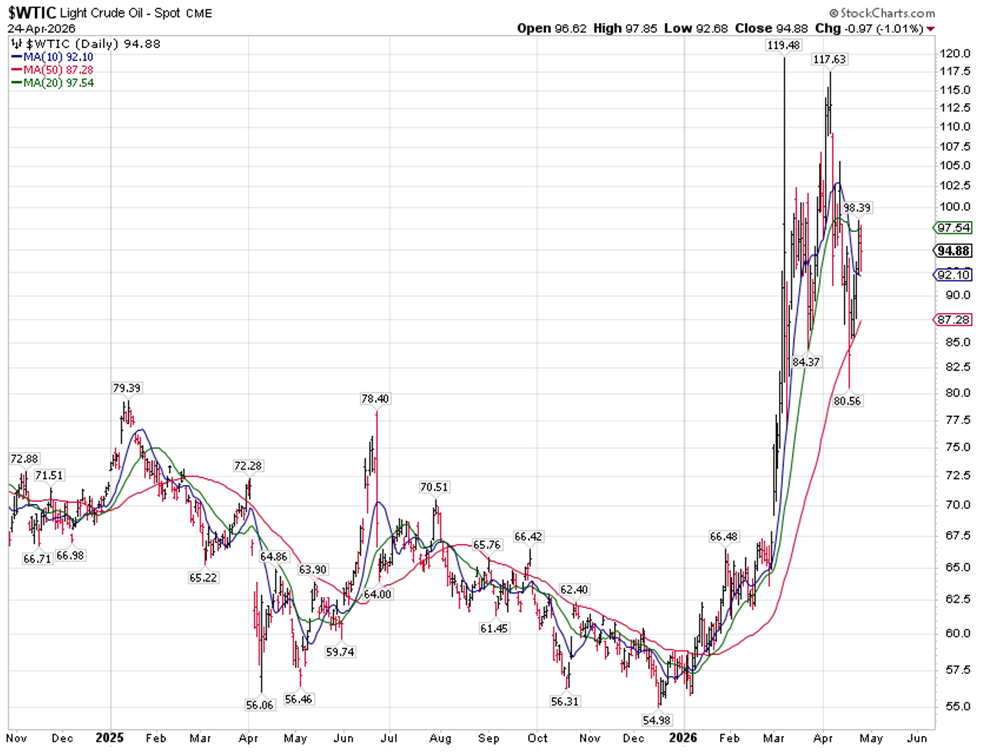
WTI crude oil has not spent much time above $100, so any surge above that level will not be liked by the stock market and may create a much-needed correction, as small as it may be. Oil supplies are running low on buffer inventories and rationing has started in some countries. Every day, the Strait of Hormuz remains practically closed suggests a higher oil price for longer (even if the Strait reopens) as inventories need to be rebuilt. After dealing with rationing, some countries are likely to keep more oil than they had before in inventory. That implies elevated demand compared with normal levels, before the Strait closure.
Graphs are for illustrative and discussion purposes only. Please read important disclosures at the end of this commentary.
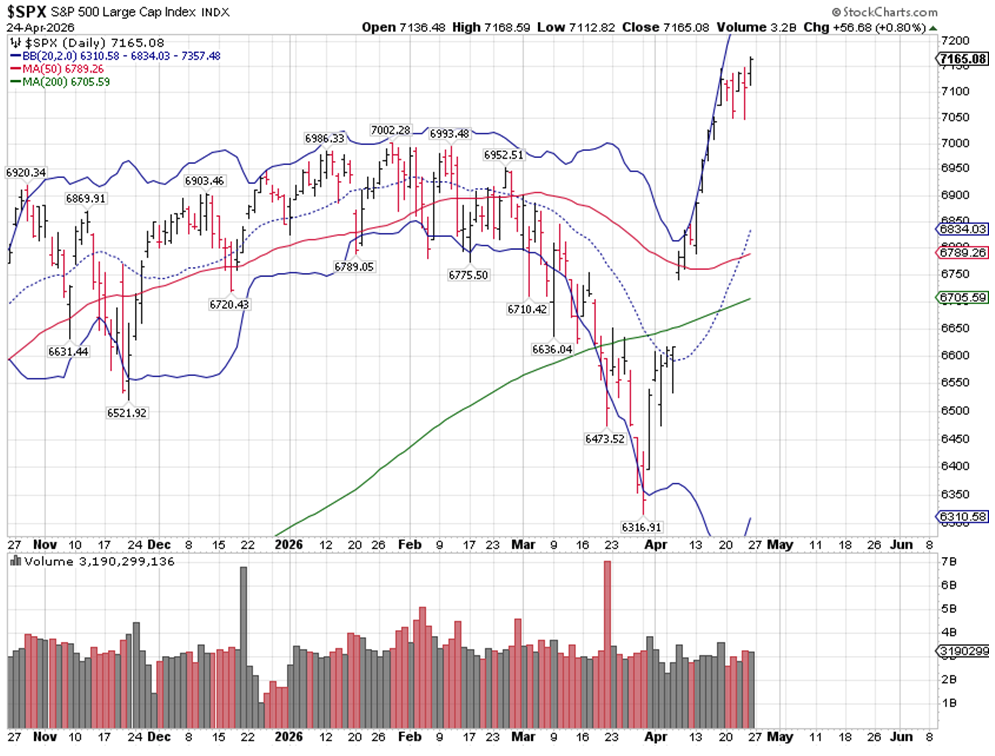
In March, we went from hugging (or walking) the Bollinger Bands (indicating selling pressure) to waking those bands up in April (indicating buying pressure), almost at the flip of a switch.
One reason for such a dramatic reversal is the stock market declined about 10% during the height of Iran hostilities while S&P 500 earnings estimates went up! Earnings going up and stock prices going down is not typically a sustainable situation, as it tends to resolve itself in the typical manner.
So far, this is similar to last year’s Tariff Tantrum, when stocks went down sharply at the onset of cost-prohibitive tariffs, but then a fierce rally began after a 90-day delay was instituted. The Trump administration never intended to keep the original tariffs at their initial cost-prohibitive levels and never intended to keep the Iran war going past the running out of buffer oil inventories in the global system.
The only problem now is the time of the war ending is mostly up to Iran and U.S.-Israel talks, where the Tariff Tantrum ended quickly since the U.S. was the only decision maker, with China being the only country retaliating. I keep thinking the Iranians know all this and are dragging their feet intentionally, as they know the Trump team will be reluctant to restart hostilities, even though they may not have a choice.
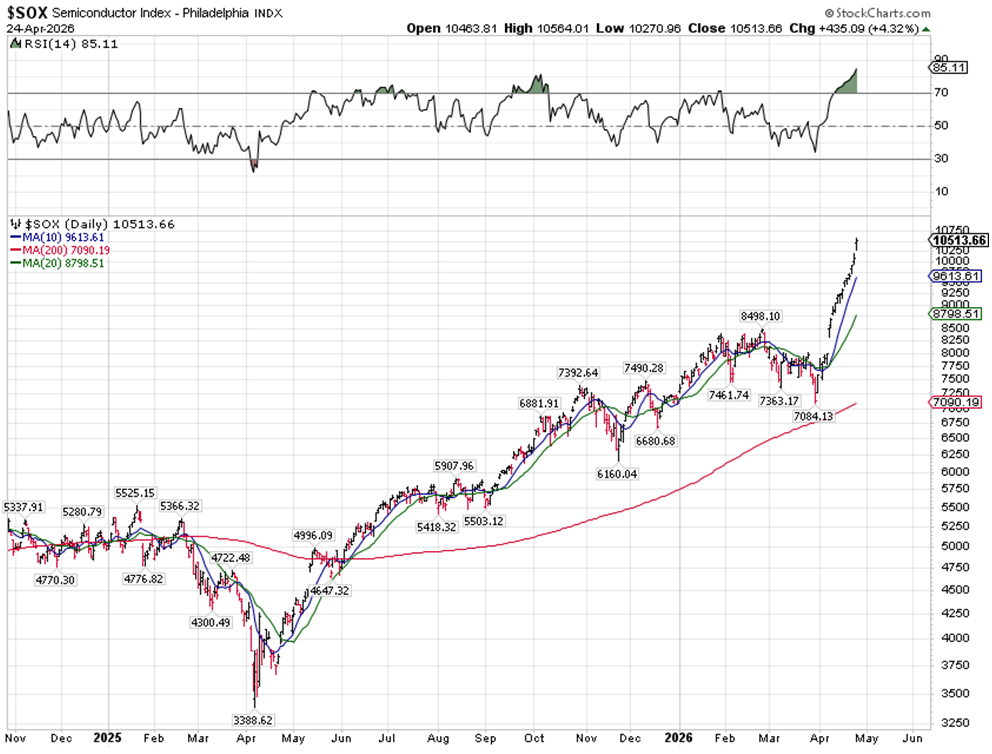
One sector strongly suggesting the stock market is extended is the semiconductor sector, which by some measures is the most overbought in years, the only outlier being the ultimate top in the year 2000.
At 85.11, the RSI overbought-oversold oscillator is higher today than it was in late October of last year when we started to see a nice size correction of about 5% for the S&P 500 in November.
Graphs are for illustrative and discussion purposes only. Please read important disclosures at the end of this commentary.
The thing about these overbought-oversold oscillators, though, is they are not precise. Momentum markets can get overbought and stay overbought and the semiconductor sector is definitely a momentum market. If you are bullish, you want this sector to have some type of consolidation similar to what we saw in November of last year, but I am aware this may last all the way till the end of May, or May 20 to be exact, the day Nvidia reports earnings. We have many more earnings reports in the next three-weeks and the vast majority are likely to be very good. Since the stock market just began running, corrections are likely to be shallow (more like sideways moving consolidations), similar to action we saw last week.
Graphs are for illustrative and discussion purposes only. Please read important disclosures at the end of this commentary.
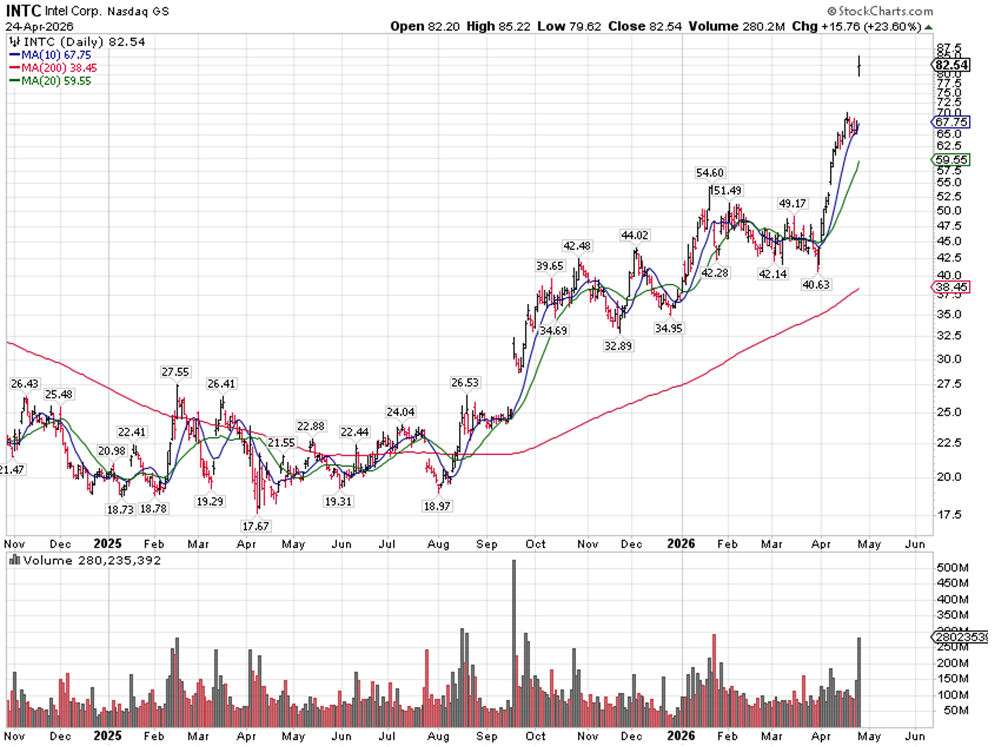
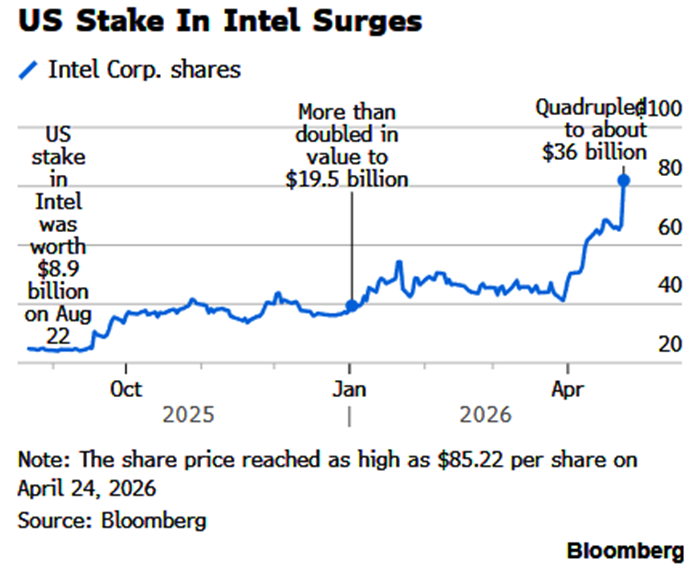
Intel Rises from Disaster to Record Highs in Short Order
One of the bigger culprits is Intel, which went from an operational disaster last year, when a new CEO took over, to become a company closing at an all-time high last Friday! Intel has doubled in a month and quadrupled since last August, when the Trump administration took a 10% stake in a “nationally important company” spearheading domestic chip production. I would not put it past Donald Trump to call Nvidia CEO Jensen Huang to nudge him to take a stake in Intel – which he did in December of last year.
Graphs are for illustrative and discussion purposes only. Please read important disclosures at the end of this commentary.
So, the U.S. government has quadrupled its money in Intel, while Nvidia has more than doubled their stake. (While Intel is clearly in a turnaround, I would not chase the stock here. Some pullback is likely).
It seems the only way to spoil this bullish market is by the war restarting in earnest, and oil prices rising.
Navellier & Associates; own Nvidia Corp (NVDA), and Intel Corp (INTC), in managed accounts. Ivan Martchev does not own Intel Corp (INTC), or Nvidia Corp (NVDA) personally.
All content above represents the opinion of Ivan Martchev of Navellier & Associates, Inc.
Also In This Issue
A Look Ahead by Louis Navellier
Earnings Continue to Surprise on the Upside
Income Mail by Bryan Perry
Massive AI Capex Spending is Justified by Anthropic’s Mythos
Growth Mail by Gary Alexander
A Call to Action (Like Getting a Job) on “May Day”
Global Mail by Ivan Martchev
Is April the Cruelest Month?
Sector Spotlight by Jason Bodner
Did You Get the Memo…About AI?
View Full Archive
Read Past Issues Here

Ivan Martchev
INVESTMENT STRATEGIST
Ivan Martchev is an investment strategist with Navellier. Previously, Ivan served as editorial director at InvestorPlace Media. Ivan was editor of Louis Rukeyser’s Mutual Funds and associate editor of Personal Finance. Ivan is also co-author of The Silk Road to Riches (Financial Times Press). The book provided analysis of geopolitical issues and investment strategy in natural resources and emerging markets with an emphasis on Asia. The book also correctly predicted the collapse in the U.S. real estate market, the rise of precious metals, and the resulting increased investor interest in emerging markets. Ivan’s commentaries have been published by MSNBC, The Motley Fool, MarketWatch, and others. All content of “Global Mail” represents the opinion of Ivan Martchev
Important Disclosures:
Although information in these reports has been obtained from and is based upon sources that Navellier believes to be reliable, Navellier does not guarantee its accuracy and it may be incomplete or condensed. All opinions and estimates constitute Navellier’s judgment as of the date the report was created and are subject to change without notice. These reports are for informational purposes only and are not a solicitation for the purchase or sale of a security. Any decision to purchase securities mentioned in these reports must take into account existing public information on such securities or any registered prospectus.To the extent permitted by law, neither Navellier & Associates, Inc., nor any of its affiliates, agents, or service providers assumes any liability or responsibility nor owes any duty of care for any consequences of any person acting or refraining to act in reliance on the information contained in this communication or for any decision based on it.
Past performance is no indication of future results. Investment in securities involves significant risk and has the potential for partial or complete loss of funds invested. It should not be assumed that any securities recommendations made by Navellier. in the future will be profitable or equal the performance of securities made in this report. Dividend payments are not guaranteed. The amount of a dividend payment, if any, can vary over time and issuers may reduce dividends paid on securities in the event of a recession or adverse event affecting a specific industry or issuer.
None of the stock information, data, and company information presented herein constitutes a recommendation by Navellier or a solicitation to buy or sell any securities. Any specific securities identified and described do not represent all of the securities purchased, sold, or recommended for advisory clients. The holdings identified do not represent all of the securities purchased, sold, or recommended for advisory clients and the reader should not assume that investments in the securities identified and discussed were or will be profitable.
Information presented is general information that does not take into account your individual circumstances, financial situation, or needs, nor does it present a personalized recommendation to you. Individual stocks presented may not be suitable for every investor. Investment in securities involves significant risk and has the potential for partial or complete loss of funds invested. Investment in fixed income securities has the potential for the investment return and principal value of an investment to fluctuate so that an investor’s holdings, when redeemed, may be worth less than their original cost.
One cannot invest directly in an index. Index is unmanaged and index performance does not reflect deduction of fees, expenses, or taxes. Presentation of Index data does not reflect a belief by Navellier that any stock index constitutes an investment alternative to any Navellier equity strategy or is necessarily comparable to such strategies. Among the most important differences between the Indices and Navellier strategies are that the Navellier equity strategies may (1) incur material management fees, (2) concentrate its investments in relatively few stocks, industries, or sectors, (3) have significantly greater trading activity and related costs, and (4) be significantly more or less volatile than the Indices.
ETF Risk: We may invest in exchange traded funds (“ETFs”) and some of our investment strategies are generally fully invested in ETFs. Like traditional mutual funds, ETFs charge asset-based fees, but they generally do not charge initial sales charges or redemption fees and investors typically pay only customary brokerage fees to buy and sell ETF shares. The fees and costs charged by ETFs held in client accounts will not be deducted from the compensation the client pays Navellier. ETF prices can fluctuate up or down, and a client account could lose money investing in an ETF if the prices of the securities owned by the ETF go down. ETFs are subject to additional risks:
- ETF shares may trade above or below their net asset value;
- An active trading market for an ETF’s shares may not develop or be maintained;
- The value of an ETF may be more volatile than the underlying portfolio of securities the ETF is designed to track;
- The cost of owning shares of the ETF may exceed those a client would incur by directly investing in the underlying securities; and
- Trading of an ETF’s shares may be halted if the listing exchange’s officials deem it appropriate, the shares are delisted from the exchange, or the activation of market-wide “circuit breakers” (which are tied to large decreases in stock prices) halts stock trading generally.
Grader Disclosures: Investment in equity strategies involves substantial risk and has the potential for partial or complete loss of funds invested. The sample portfolio and any accompanying charts are for informational purposes only and are not to be construed as a solicitation to buy or sell any financial instrument and should not be relied upon as the sole factor in an investment making decision. As a matter of normal and important disclosures to you, as a potential investor, please consider the following: The performance presented is not based on any actual securities trading, portfolio, or accounts, and the reported performance of the A, B, C, D, and F portfolios (collectively the “model portfolios”) should be considered mere “paper” or pro forma performance results based on Navellier’s research.
Investors evaluating any of Navellier & Associates, Inc.’s, (or its affiliates’) Investment Products must not use any information presented here, including the performance figures of the model portfolios, in their evaluation of any Navellier Investment Products. Navellier Investment Products include the firm’s mutual funds and managed accounts. The model portfolios, charts, and other information presented do not represent actual funded trades and are not actual funded portfolios. There are material differences between Navellier Investment Products’ portfolios and the model portfolios, research, and performance figures presented here. The model portfolios and the research results (1) may contain stocks or ETFs that are illiquid and difficult to trade; (2) may contain stock or ETF holdings materially different from actual funded Navellier Investment Product portfolios; (3) include the reinvestment of all dividends and other earnings, estimated trading costs, commissions, or management fees; and, (4) may not reflect prices obtained in an actual funded Navellier Investment Product portfolio. For these and other reasons, the reported performances of model portfolios do not reflect the performance results of Navellier’s actually funded and traded Investment Products. In most cases, Navellier’s Investment Products have materially lower performance results than the performances of the model portfolios presented.
This report contains statements that are, or may be considered to be, forward-looking statements. All statements that are not historical facts, including statements about our beliefs or expectations, are “forward-looking statements” within the meaning of The U.S. Private Securities Litigation Reform Act of 1995. These statements may be identified by such forward-looking terminology as “expect,” “estimate,” “plan,” “intend,” “believe,” “anticipate,” “may,” “will,” “should,” “could,” “continue,” “project,” or similar statements or variations of such terms. Our forward-looking statements are based on a series of expectations, assumptions, and projections, are not guarantees of future results or performance, and involve substantial risks and uncertainty as described in Form ADV Part 2A of our filing with the Securities and Exchange Commission (SEC), which is available at www.adviserinfo.sec.gov or by requesting a copy by emailing info@navellier.com. All of our forward-looking statements are as of the date of this report only. We can give no assurance that such expectations or forward-looking statements will prove to be correct. Actual results may differ materially. You are urged to carefully consider all such factors.
FEDERAL TAX ADVICE DISCLAIMER: As required by U.S. Treasury Regulations, you are informed that, to the extent this presentation includes any federal tax advice, the presentation is not written by Navellier to be used, and cannot be used, for the purpose of avoiding federal tax penalties. Navellier does not advise on any income tax requirements or issues. Use of any information presented by Navellier is for general information only and does not represent tax advice either express or implied. You are encouraged to seek professional tax advice for income tax questions and assistance.
IMPORTANT NEWSLETTER DISCLOSURE:The hypothetical performance results for investment newsletters that are authored or edited by Louis Navellier, including Louis Navellier’s Growth Investor, Louis Navellier’s Breakthrough Stocks, Louis Navellier’s Accelerated Profits, and Louis Navellier’s Platinum Club, are not based on any actual securities trading, portfolio, or accounts, and the newsletters’ reported hypothetical performances should be considered mere “paper” or proforma hypothetical performance results and are not actual performance of real world trades. Navellier & Associates, Inc. does not have any relation to or affiliation with the owner of these newsletters. There are material differences between Navellier Investment Products’ portfolios and the InvestorPlace Media, LLC newsletter portfolios authored by Louis Navellier. The InvestorPlace Media, LLC newsletters contain hypothetical performance that do not include transaction costs, advisory fees, or other fees a client might incur if actual investments and trades were being made by an investor. As a result, newsletter performance should not be used to evaluate Navellier Investment services which are separate and different from the newsletters. The owner of the newsletters is InvestorPlace Media, LLC and any questions concerning the newsletters, including any newsletter advertising or hypothetical Newsletter performance claims, (which are calculated solely by Investor Place Media and not Navellier) should be referred to InvestorPlace Media, LLC at (800) 718-8289.
Please note that Navellier & Associates and the Navellier Private Client Group are managed completely independent of the newsletters owned and published by InvestorPlace Media, LLC and written and edited by Louis Navellier, and investment performance of the newsletters should in no way be considered indicative of potential future investment performance for any Navellier & Associates separately managed account portfolio. Potential investors should consult with their financial advisor before investing in any Navellier Investment Product.
Navellier claims compliance with Global Investment Performance Standards (GIPS). To receive a complete list and descriptions of Navellier’s composites and/or a presentation that adheres to the GIPS standards, please contact Navellier or click here. It should not be assumed that any securities recommendations made by Navellier & Associates, Inc. in the future will be profitable or equal the performance of securities made in this report.
FactSet Disclosure: Navellier does not independently calculate the statistical information included in the attached report. The calculation and the information are provided by FactSet, a company not related to Navellier. Although information contained in the report has been obtained from FactSet and is based on sources Navellier believes to be reliable, Navellier does not guarantee its accuracy, and it may be incomplete or condensed. The report and the related FactSet sourced information are provided on an “as is” basis. The user assumes the entire risk of any use made of this information. Investors should consider the report as only a single factor in making their investment decision. The report is for informational purposes only and is not intended as an offer or solicitation for the purchase or sale of a security. FactSet sourced information is the exclusive property of FactSet. Without prior written permission of FactSet, this information may not be reproduced, disseminated or used to create any financial products. All indices are unmanaged and performance of the indices include reinvestment of dividends and interest income, unless otherwise noted, are not illustrative of any particular investment and an investment cannot be made in any index. Past performance is no guarantee of future results.