by Jason Bodner
April 7, 2026
Astronomers recently witnessed something extraordinary. Roughly 130-million light-years away from us, two neutron stars spiraled toward each other in a slow, inevitable collision. What made it remarkable was not just the explosion, but how it was detected. Scientists did not see it. They heard it. Yes, HEARD it.
Instruments from Cal-Tech’s LIGO picked up faint gravitational waves as the system tightened. The LIGO equipment allowed the team to hear two-black holes growing as they merged into one.
The signal built gradually. Frequency increased. The orbit shrank. Long before telescopes captured the flash, the outcome was already in motion. By the time the light reached Earth, it was all over.
Markets move the same way. The visible move is usually the final stage of something developing beneath the surface. Right now, the surface looks “mixed,” but underneath, the message is far more consistent.
The market hasn’t been broken, but it has been under steady distribution pressure since the start of the year. Anyone focused only on major index levels would miss it. The internal data tell a different story.
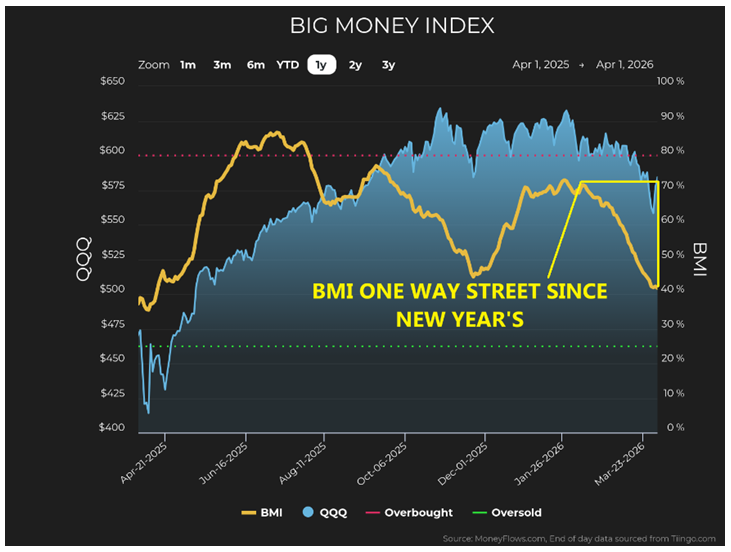
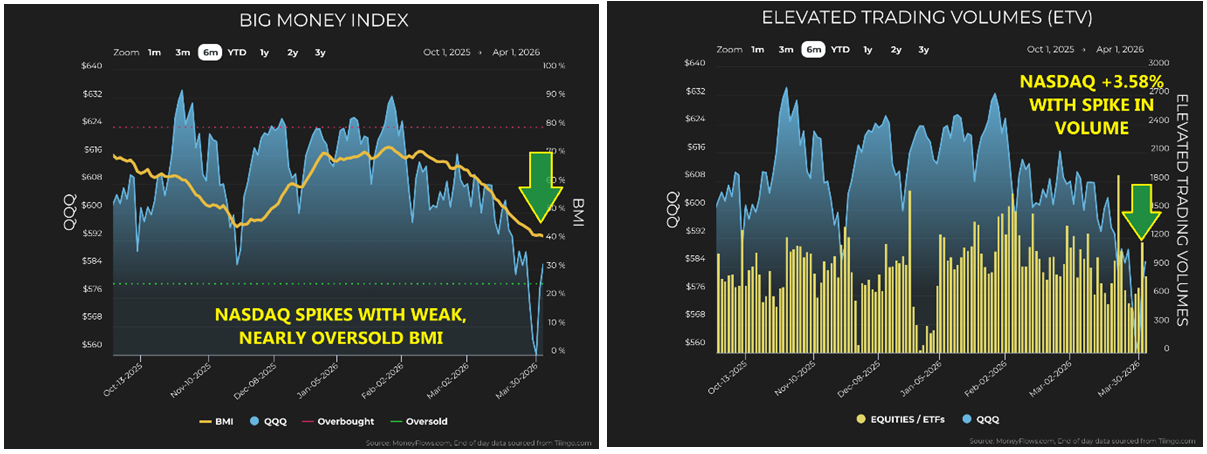
Let’s start, as usual, with the Big Money Index (BMI), which has fallen 11-straight sessions, dropping from above 70-percent in early February to 41.4 (on Friday) in under two-months. This is significant because the move pushed it below its long-term median into the lower third of all readings since 1990. The smoothed trend is still declining, which points to sustained pressure rather than a short-lived shock.
Graphs are for illustrative and discussion purposes only. Please read important disclosures at the end of this commentary.
The BMI is approaching a range which matters. Readings near 35 have often aligned with oversold conditions, with deeper extremes near 25. We are not there yet, but we are getting close enough.
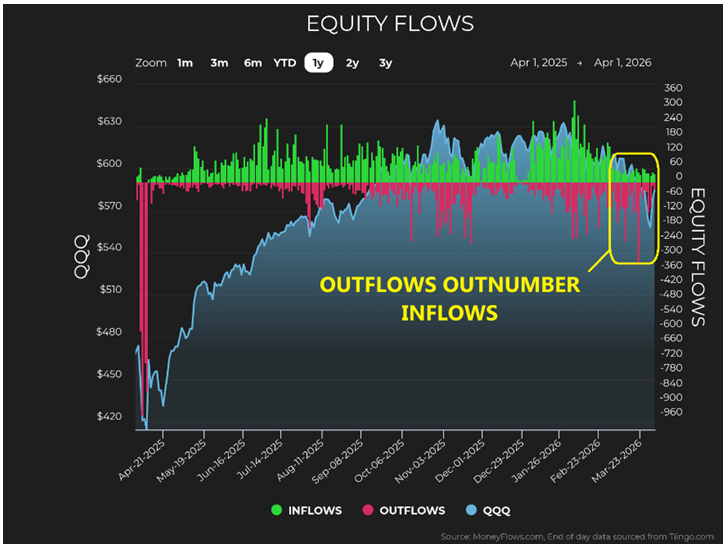
Next, we know the flow data reinforces the shift. Outflows have exceeded inflows in nine of the last 11-sessions. The change from earlier this year is clear. Control has moved from buyers to sellers, quickly.
Graphs are for illustrative and discussion purposes only. Please read important disclosures at the end of this commentary.
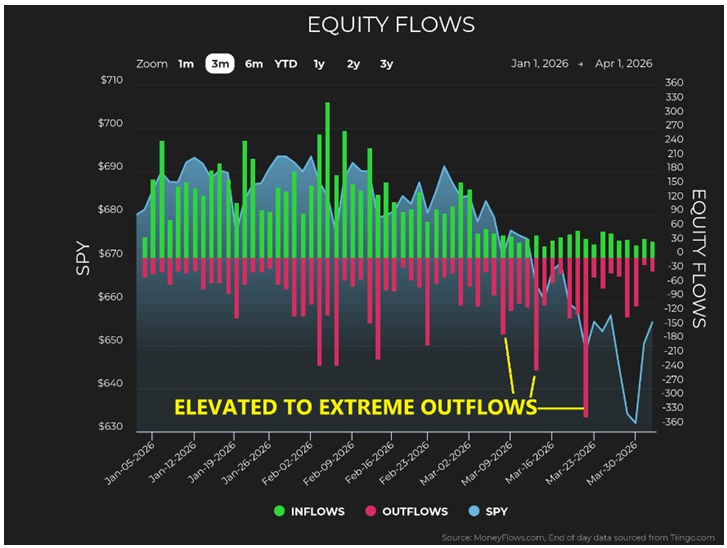
The action on March 12 stands out. Outflows surged while inflows lagged, pushing the daily ratio into the bottom decile of historical readings, which tend to appear when the flow is forced, not gradually adjusted.
Graphs are for illustrative and discussion purposes only. Please read important disclosures at the end of this commentary.
Volatility has moved higher alongside this shift. The CBOE Volatility Index is sitting in the high 20s. Elevated, but not extreme. The market is adjusting, not unraveling.
Looking at sectors, the story becomes more precise.
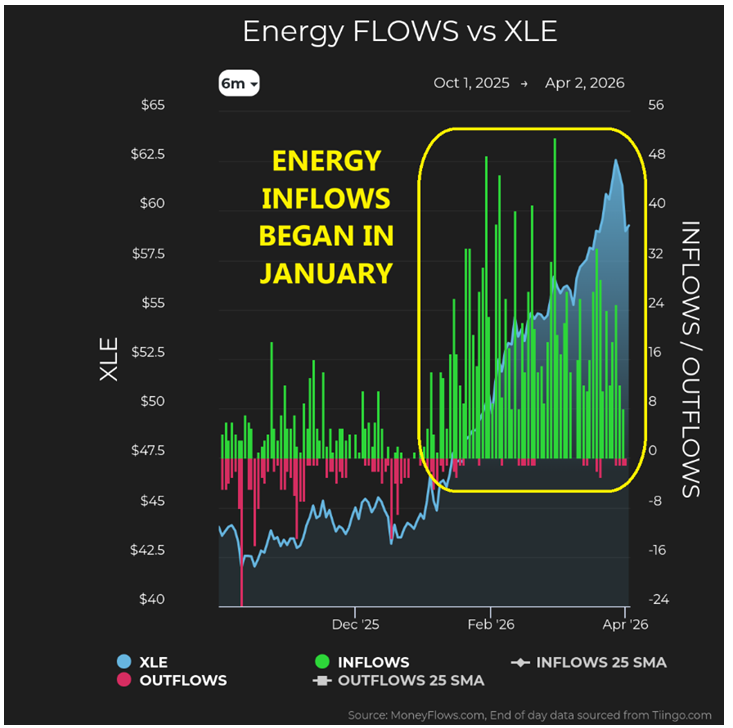
Energy is still attracting steady, persistent inflows. This is not a short burst of interest just due to the Iran War. It has been consistent and one-directional for months now:
Graphs are for illustrative and discussion purposes only. Please read important disclosures at the end of this commentary.
As of last week, 18 of the top 20-liquid ETFs are energy-related, which confirms the breadth of the move:
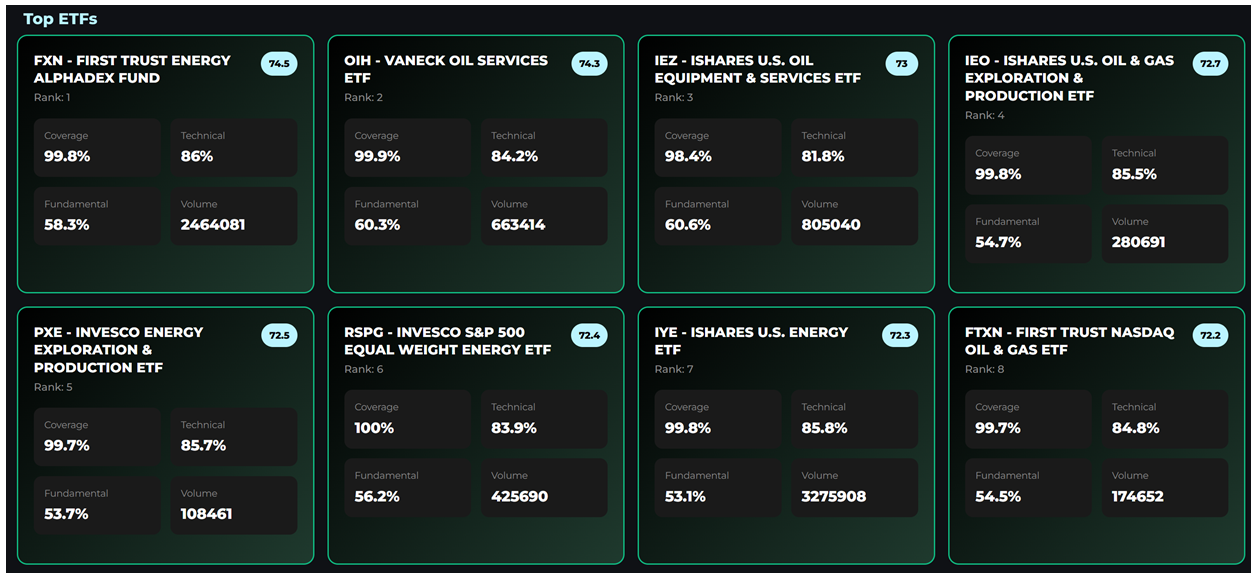
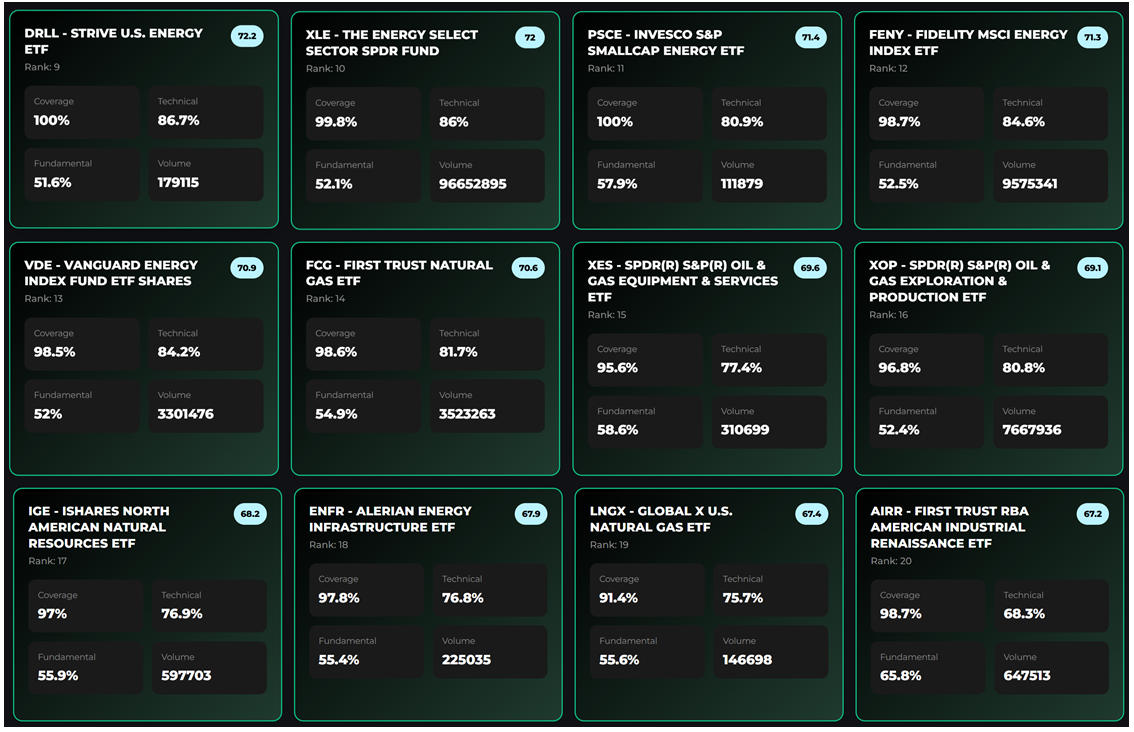
Graphs are for illustrative and discussion purposes only. Please read important disclosures at the end of this commentary.
Financials show the opposite behavior. Financials have seen sustained outflows, with several stretches in which selling overwhelmed buying by wide margins. The names being exited include several global banks and large asset managers, which suggest this is not isolated. It is broad.
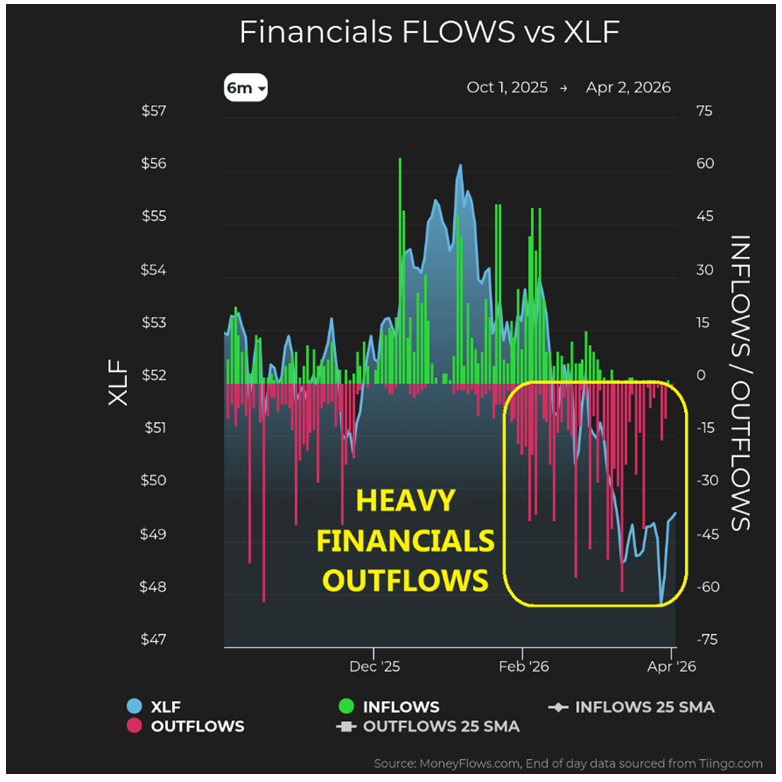
Graphs are for illustrative and discussion purposes only. Please read important disclosures at the end of this commentary.
One of the more surprising developments is in consumer staples. In a typical defensive rotation, this group would see inflows. Instead, we’ve seen selling, reflecting reallocation rather than a move to safety.
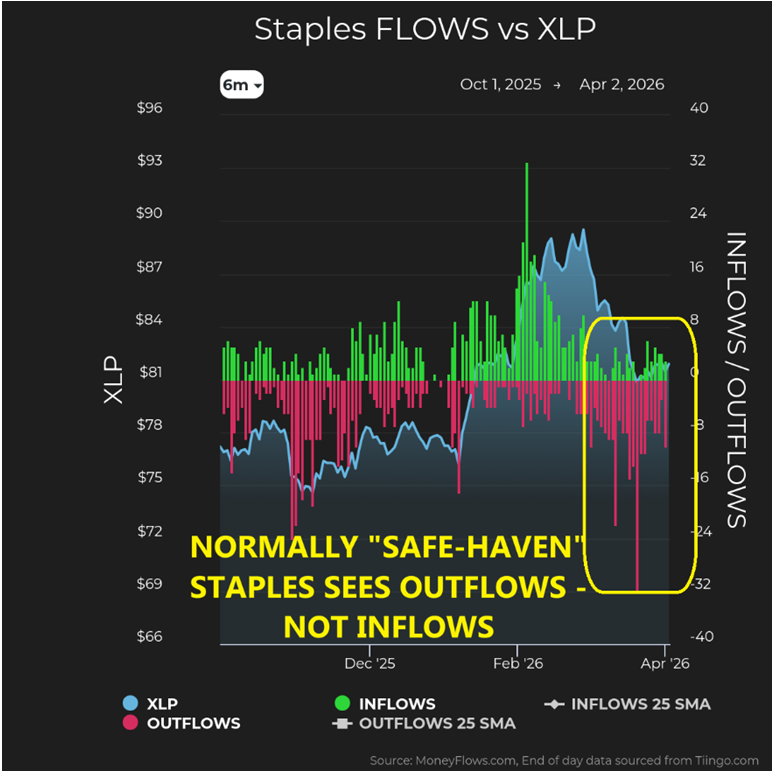
Graphs are for illustrative and discussion purposes only. Please read important disclosures at the end of this commentary.
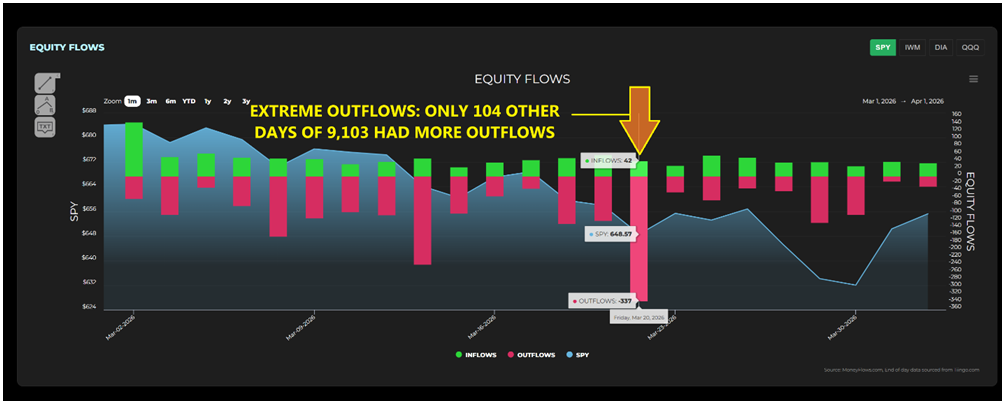
There was also a key moment in which selling became widespread. On March 20, outflows were very heavy. For context, the 337-outflows registered on March 20 lie within the top 1.1 percentile. In other words, of 9,103-trading days, 8,998-days had fewer outflows. Selling surged across nearly every sector. Industrials, health care, materials, discretionary. Everything was hit at once. These types of broad events often coincide with short-term exhaustion, where a large amount of supply is cleared quickly.
Graphs are for illustrative and discussion purposes only. Please read important disclosures at the end of this commentary.
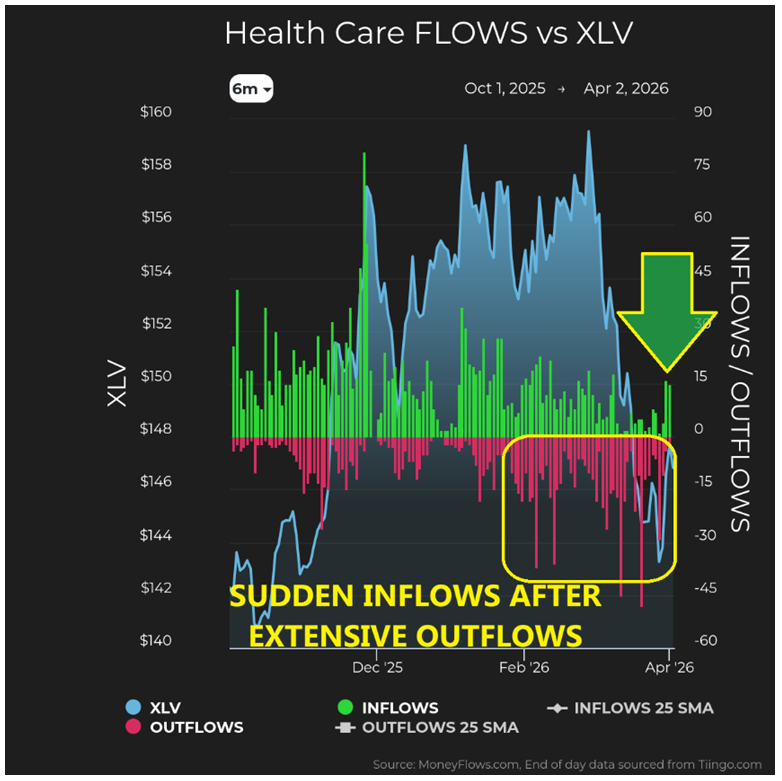
In the following sessions, outflows dwindled. Health care provides a clear example. After being one of the most heavily sold sectors earlier in the month, it has recently seen renewed inflows.
And now, biotech and some large-cap names are beginning to attract capital again.
Graphs are for illustrative and discussion purposes only. Please read important disclosures at the end of this commentary.
Taken together, this market is being reshaped, rather than moving uniformly higher or lower. The BMI is trending toward levels which have historically drawn buyers. Outflows dominate, but not at crisis levels. Volatility is elevated but contained. A broad flush has already taken place, and capital is rotating.
An Unusual Alignment to Notice…
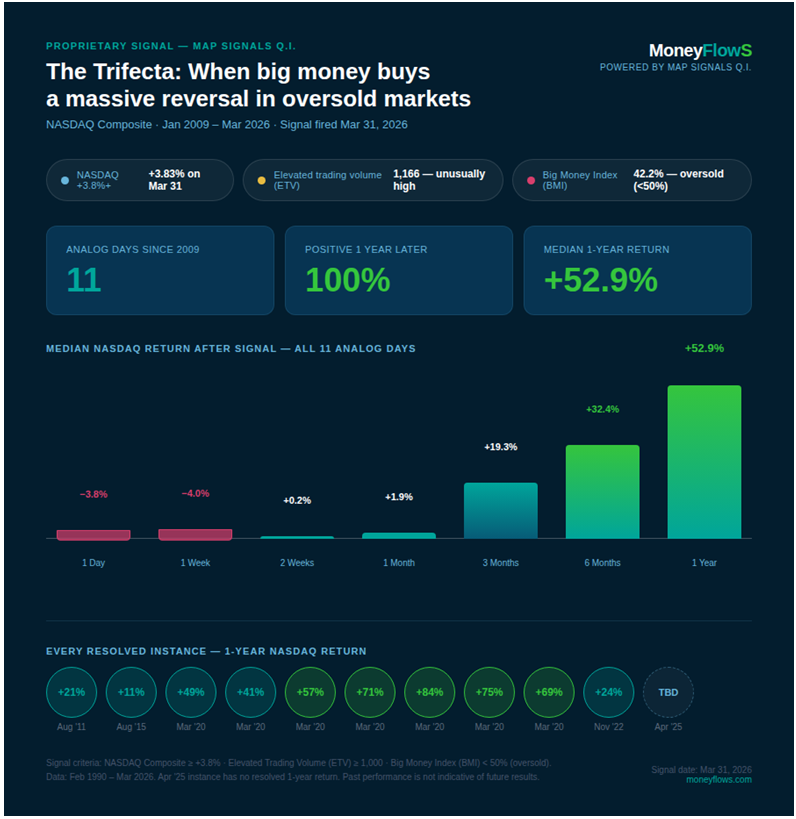
Within this context, one amazing development stands out. An ultra-rare signal has just been triggered. The setup requires a sharp one-day move in the NASDAQ Composite, elevated institutional activity, and a depressed BMI below 50. All three conditions have now aligned.
Since 2009, this combination has appeared just 11-times out of more than 4,000-trading days. The short-term aftermath has not always been smooth. Markets can stall or move unevenly in the days ahead.
Over longer periods, the pattern becomes more consistent. Forward returns have been strongly positive, with meaningful median gains. A year later, markets were higher in 100% of such instances:
Graphs are for illustrative and discussion purposes only. Please read important disclosures at the end of this commentary.
The latest instance checks every box.
- A sharp index surge.
- Heavy institutional participation.
- A BMI reading which reflects weak positioning.
Graphs are for illustrative and discussion purposes only. Please read important disclosures at the end of this commentary.
For investors, the takeaway is straightforward. Broad exposure through the Invesco QQQ Trust has historically captured much of the upside following similar setups. At the same time, the underlying flow suggest leadership will be concentrated. Capital is not moving evenly. It is targeting specific sectors.
This is where the opportunity tends to emerge first. The challenge is not identifying the setup. The data is clear. The challenge is acting while conditions still feel unsettled.
Periods like this rarely come with confirmation. They tend to feel incomplete, with mixed signals and uneven performance. Uncertainty is part of the process.
The shift is underway. Headlines scream war, but positioning change is visible beneath the surface.
The indices may not show it, but the bigger risk now might be to the upside, not downside.
As William Gibson observed: “The future is already here, but it is not evenly distributed.”
All content above represents the opinion of Jason Bodner of Navellier & Associates, Inc.
Also In This Issue
A Look Ahead by Louis Navellier
What Does President Trump’s New Deadline Imply for Markets?
Income Mail by Bryan Perry
The Next “Two” Big Things
Growth Mail by Gary Alexander
China’s Coming Sinking Spell Implies Rising U.S. Growth
Global Mail by Ivan Martchev
Investors Hope for the Best, but are they Prepared for the Worst?
Sector Spotlight by Jason Bodner
Some Important New Market Signals Emerging Beneath the Surface
View Full Archive
Read Past Issues Here

Jason Bodner
MARKETMAIL EDITOR FOR SECTOR SPOTLIGHT
Jason Bodner writes Sector Spotlight in the weekly Marketmail publication and has authored several white papers for the company. He is also Co-Founder of Macro Analytics for Professionals which produces proprietary equity accumulation and distribution research for its clients. Previously, Mr. Bodner served as Director of European Equity Derivatives for Cantor Fitzgerald Europe in London, then moved to the role of Head of Equity Derivatives North America for the same company in New York. He also served as S.V.P. Equity Derivatives for Jefferies, LLC. He received a B.S. in business administration in 1996, with honors, from Skidmore College as a member of the Periclean Honors Society. All content of “Sector Spotlight” represents the opinion of Jason Bodner
Important Disclosures:
Jason Bodner is a co-founder and co-owner of Mapsignals. Mr. Bodner is an independent contractor who is occasionally hired by Navellier & Associates to write an article and or provide opinions for possible use in articles that appear in Navellier & Associates weekly Market Mail. Mr. Bodner is not employed or affiliated with Louis Navellier, Navellier & Associates, Inc., or any other Navellier owned entity. The opinions and statements made here are those of Mr. Bodner and not necessarily those of any other persons or entities. This is not an endorsement, or solicitation or testimonial or investment advice regarding the BMI Index or any statements or recommendations or analysis in the article or the BMI Index or Mapsignals or its products or strategies.
Although information in these reports has been obtained from and is based upon sources that Navellier believes to be reliable, Navellier does not guarantee its accuracy and it may be incomplete or condensed. All opinions and estimates constitute Navellier’s judgment as of the date the report was created and are subject to change without notice. These reports are for informational purposes only and are not a solicitation for the purchase or sale of a security. Any decision to purchase securities mentioned in these reports must take into account existing public information on such securities or any registered prospectus.To the extent permitted by law, neither Navellier & Associates, Inc., nor any of its affiliates, agents, or service providers assumes any liability or responsibility nor owes any duty of care for any consequences of any person acting or refraining to act in reliance on the information contained in this communication or for any decision based on it.
Past performance is no indication of future results. Investment in securities involves significant risk and has the potential for partial or complete loss of funds invested. It should not be assumed that any securities recommendations made by Navellier. in the future will be profitable or equal the performance of securities made in this report. Dividend payments are not guaranteed. The amount of a dividend payment, if any, can vary over time and issuers may reduce dividends paid on securities in the event of a recession or adverse event affecting a specific industry or issuer.
None of the stock information, data, and company information presented herein constitutes a recommendation by Navellier or a solicitation to buy or sell any securities. Any specific securities identified and described do not represent all of the securities purchased, sold, or recommended for advisory clients. The holdings identified do not represent all of the securities purchased, sold, or recommended for advisory clients and the reader should not assume that investments in the securities identified and discussed were or will be profitable.
Information presented is general information that does not take into account your individual circumstances, financial situation, or needs, nor does it present a personalized recommendation to you. Individual stocks presented may not be suitable for every investor. Investment in securities involves significant risk and has the potential for partial or complete loss of funds invested. Investment in fixed income securities has the potential for the investment return and principal value of an investment to fluctuate so that an investor’s holdings, when redeemed, may be worth less than their original cost.
One cannot invest directly in an index. Index is unmanaged and index performance does not reflect deduction of fees, expenses, or taxes. Presentation of Index data does not reflect a belief by Navellier that any stock index constitutes an investment alternative to any Navellier equity strategy or is necessarily comparable to such strategies. Among the most important differences between the Indices and Navellier strategies are that the Navellier equity strategies may (1) incur material management fees, (2) concentrate its investments in relatively few stocks, industries, or sectors, (3) have significantly greater trading activity and related costs, and (4) be significantly more or less volatile than the Indices.
ETF Risk: We may invest in exchange traded funds (“ETFs”) and some of our investment strategies are generally fully invested in ETFs. Like traditional mutual funds, ETFs charge asset-based fees, but they generally do not charge initial sales charges or redemption fees and investors typically pay only customary brokerage fees to buy and sell ETF shares. The fees and costs charged by ETFs held in client accounts will not be deducted from the compensation the client pays Navellier. ETF prices can fluctuate up or down, and a client account could lose money investing in an ETF if the prices of the securities owned by the ETF go down. ETFs are subject to additional risks:
- ETF shares may trade above or below their net asset value;
- An active trading market for an ETF’s shares may not develop or be maintained;
- The value of an ETF may be more volatile than the underlying portfolio of securities the ETF is designed to track;
- The cost of owning shares of the ETF may exceed those a client would incur by directly investing in the underlying securities and;
- Trading of an ETF’s shares may be halted if the listing exchange’s officials deem it appropriate, the shares are delisted from the exchange, or the activation of market-wide “circuit breakers” (which are tied to large decreases in stock prices) halts stock trading generally.
Grader Disclosures: Investment in equity strategies involves substantial risk and has the potential for partial or complete loss of funds invested. The sample portfolio and any accompanying charts are for informational purposes only and are not to be construed as a solicitation to buy or sell any financial instrument and should not be relied upon as the sole factor in an investment making decision. As a matter of normal and important disclosures to you, as a potential investor, please consider the following: The performance presented is not based on any actual securities trading, portfolio, or accounts, and the reported performance of the A, B, C, D, and F portfolios (collectively the “model portfolios”) should be considered mere “paper” or pro forma performance results based on Navellier’s research.
Investors evaluating any of Navellier & Associates, Inc.’s, (or its affiliates’) Investment Products must not use any information presented here, including the performance figures of the model portfolios, in their evaluation of any Navellier Investment Products. Navellier Investment Products include the firm’s mutual funds and managed accounts. The model portfolios, charts, and other information presented do not represent actual funded trades and are not actual funded portfolios. There are material differences between Navellier Investment Products’ portfolios and the model portfolios, research, and performance figures presented here. The model portfolios and the research results (1) may contain stocks or ETFs that are illiquid and difficult to trade; (2) may contain stock or ETF holdings materially different from actual funded Navellier Investment Product portfolios; (3) include the reinvestment of all dividends and other earnings, estimated trading costs, commissions, or management fees; and, (4) may not reflect prices obtained in an actual funded Navellier Investment Product portfolio. For these and other reasons, the reported performances of model portfolios do not reflect the performance results of Navellier’s actually funded and traded Investment Products. In most cases, Navellier’s Investment Products have materially lower performance results than the performances of the model portfolios presented.
This report contains statements that are, or may be considered to be, forward-looking statements. All statements that are not historical facts, including statements about our beliefs or expectations, are “forward-looking statements” within the meaning of The U.S. Private Securities Litigation Reform Act of 1995. These statements may be identified by such forward-looking terminology as “expect,” “estimate,” “plan,” “intend,” “believe,” “anticipate,” “may,” “will,” “should,” “could,” “continue,” “project,” or similar statements or variations of such terms. Our forward-looking statements are based on a series of expectations, assumptions, and projections, are not guarantees of future results or performance, and involve substantial risks and uncertainty as described in Form ADV Part 2A of our filing with the Securities and Exchange Commission (SEC), which is available at www.adviserinfo.sec.gov or by requesting a copy by emailing info@navellier.com. All of our forward-looking statements are as of the date of this report only. We can give no assurance that such expectations or forward-looking statements will prove to be correct. Actual results may differ materially. You are urged to carefully consider all such factors.
FEDERAL TAX ADVICE DISCLAIMER: As required by U.S. Treasury Regulations, you are informed that, to the extent this presentation includes any federal tax advice, the presentation is not written by Navellier to be used, and cannot be used, for the purpose of avoiding federal tax penalties. Navellier does not advise on any income tax requirements or issues. Use of any information presented by Navellier is for general information only and does not represent tax advice either express or implied. You are encouraged to seek professional tax advice for income tax questions and assistance.
IMPORTANT NEWSLETTER DISCLOSURE:The hypothetical performance results for investment newsletters that are authored or edited by Louis Navellier, including Louis Navellier’s Growth Investor, Louis Navellier’s Breakthrough Stocks, Louis Navellier’s Accelerated Profits, and Louis Navellier’s Platinum Club, are not based on any actual securities trading, portfolio, or accounts, and the newsletters’ reported hypothetical performances should be considered mere “paper” or proforma hypothetical performance results and are not actual performance of real world trades. Navellier & Associates, Inc. does not have any relation to or affiliation with the owner of these newsletters. There are material differences between Navellier Investment Products’ portfolios and the InvestorPlace Media, LLC newsletter portfolios authored by Louis Navellier. The InvestorPlace Media, LLC newsletters contain hypothetical performance that do not include transaction costs, advisory fees, or other fees a client might incur if actual investments and trades were being made by an investor. As a result, newsletter performance should not be used to evaluate Navellier Investment services which are separate and different from the newsletters. The owner of the newsletters is InvestorPlace Media, LLC and any questions concerning the newsletters, including any newsletter advertising or hypothetical Newsletter performance claims, (which are calculated solely by Investor Place Media and not Navellier) should be referred to InvestorPlace Media, LLC at (800) 718-8289.
Please note that Navellier & Associates and the Navellier Private Client Group are managed completely independent of the newsletters owned and published by InvestorPlace Media, LLC and written and edited by Louis Navellier, and investment performance of the newsletters should in no way be considered indicative of potential future investment performance for any Navellier & Associates separately managed account portfolio. Potential investors should consult with their financial advisor before investing in any Navellier Investment Product.
Navellier claims compliance with Global Investment Performance Standards (GIPS). To receive a complete list and descriptions of Navellier’s composites and/or a presentation that adheres to the GIPS standards, please contact Navellier or click here. It should not be assumed that any securities recommendations made by Navellier & Associates, Inc. in the future will be profitable or equal the performance of securities made in this report.
FactSet Disclosure: Navellier does not independently calculate the statistical information included in the attached report. The calculation and the information are provided by FactSet, a company not related to Navellier. Although information contained in the report has been obtained from FactSet and is based on sources Navellier believes to be reliable, Navellier does not guarantee its accuracy, and it may be incomplete or condensed. The report and the related FactSet sourced information are provided on an “as is” basis. The user assumes the entire risk of any use made of this information. Investors should consider the report as only a single factor in making their investment decision. The report is for informational purposes only and is not intended as an offer or solicitation for the purchase or sale of a security. FactSet sourced information is the exclusive property of FactSet. Without prior written permission of FactSet, this information may not be reproduced, disseminated or used to create any financial products. All indices are unmanaged and performance of the indices include reinvestment of dividends and interest income, unless otherwise noted, are not illustrative of any particular investment and an investment cannot be made in any index. Past performance is no guarantee of future results.