by Gary Alexander
March 24, 2026
With wars and inflation, why is gold lower? Short answer: Gold is only lower short-term, as the Fed looks like they will keep rates high, and algorithmic traders say this hurts gold and stocks, but anything can change at any time, for patient investors. To wit, we’ve seen three-gold “buys on dips” since October:
- On October 20, 2025, gold peaked at $4,336 and fell 8.5% to $3,966 a week later before soaring to $5,000.
- On January 29, 2026, gold fell 13%, from $5,318 to $4,622 in three-days, but then soared back to $5,294.
- On March 2, 2026, gold fell 15%, from $5,294 to $4,482 last Friday, a third buying window in five-months.
The Wall Street Journal prefers shorter-term views, writing on Friday (in “Sell-off in Precious Metals Accelerates”) about gold and silver’s “worst daily declines on record Thursday,” but certainly not the worst declines – like the 80% drop in silver and -50% gold in three-months in early 1980. They also failed to mention the two examples (above) of savvy investors buying on dips rather than chasing new highs.
The Journal was on the right track citing prior expectations of two rate-cuts, now reduced to one, as a likely cause: “Traders saw a similar dynamic play out in 2022, when Russia’s invasion of Ukraine led to a surge in energy prices, fanning inflation. Gold fell for seven-straight months between April and October.”
Our compatriot here, Bryan Perry, has a more accurate analysis, in my view, as he and I recall the Black Monday stock sell-off in October 1987 leading to a gold stock massacre the next day, “Bloody Tuesday.”
This week, Bryan wrote:
“Last week, investors saw a rare phenomenon: Gold and equities both sold-off sharply, together. This usually means large hedge funds have to meet major margin calls, so they are forced to sell their winners (like gold) to cover losses in their losers (like technology stocks or small-caps).”
Looking at any market over a two-day, two-week, or even two-month period is, to me, fairly senseless (and exhausting). I’ve been a “gold bug” (favoring gold over the dollar) since my 1960s college days, when my dad was in a gold-oriented investment club and sent me all his “hard money” newsletters, but my first journalistic offering in that field was an 8-page article for a major international magazine in October 1971, “America Faces the Dollar Crisis,” following Nixon’s August closing of the gold window.
My opening paragraph back then put the crisis in perspective: “The American dollar reigned supreme in world trade and finance,” until 1968, when “claims on U.S. gold were running into the millions of dollars per-day. More than $12-billion (half) of U.S. gold was drained between 1958 and 1968, and much of that came in the last hectic months before March 1968, when the U.S. temporarily closed the gold window.”
In the 1970s, I joined the “hard money movement, and in the 1980s, I edited Jim Blanchard’s “Gold Newsletter.” Since then, I have also authored a weekly gold newsletter for 20-years now, since 2005.
That said, being a gold bug often demands long-term patience – for two-decades, 1980 to 2000. While the mainstream press blows hot and cold on gold, making them late in identifying trends and prone to focus on gold’s flaws, I see a lot of golden nonsense printed on all sides. Lately, on March 2, The Wall Street Journal printed a chart showing gold badly under-performing both the S&P 500 and Warren Buffett’s Berkshire Hathaway since 2011, defending Buffett’s broadside against gold in his 2011 shareholder letter.
Bear in mind – I like stocks more than gold, and we have built our net worth mostly in stocks, with gold as a dollar hedge. I have owned Buffett’s Berkshire shares for 20+ years and am pleased with the results, but that doesn’t mean Warren Buffett knows enough about gold to bash its major role as a dollar hedge.
As a long-time (nearly 60-year) gold bug, I am familiar with all the arguments – both ways – and I still don’t see any reason for a war here. Both gold and stocks are vital portions of any portfolio, with stocks claiming the majority position and leadership role. Gold is more of a currency hedge than a stock market hedge, but it so happens gold has beaten most market indexes over most holding periods since the 1960s.
Whenever I see some fan of stocks try to bash gold, I see they invariably show gold charts starting during a gold bubble peak – either that single-day in January 1980 when gold hit $850, or the $1,900 peak in 2011, both following 10-year surges and peaking in a buying frenzy. Gold bugs tend to do the same thing, starting their charts at a market peak, like 2000, when gold was low. I’ve devised a formula for this craft:
If you want a dazzling CHART,
Let me choose the date to START…
Or if you want to prove a TREND,
Let me choose the date to END.
There’s an old axiom (“charts don’t lie”), but biased advocates use charts all the time to warp results in their favor. Disraeli (British statesman and former prime minister of the U.K.) reportedly said, “There are three-types of lies: Lies, damned lies, and statistics.”
The March 2 Journal article starts out saying, “If they gave out medals in financial trash talking, Warren Buffett would be on the podium. He’d probably ask for cash in lieu of a metal disk.” That’s a clever quip, but presumptuous, since the winner’s “metal disk” in the Olympics is Gold – so, who would prefer paper?
The article goes on to say Buffett quipped that gold “gets dug out of the ground in Africa, or someplace. Then we melt it down, dig another hole, bury it again and pay people to stand around guarding it. It has no utility.” But Buffett uttered that quote in a speech at Harvard in 1998, and if you chart gold vs. stocks since 1998, instead of 1980 or 2011 (in the Journal review), gold is the clear winner. Gold’s average price in 1998 was $294, so even with its recent correction to $4,500, it is up 1430%, while the S&P 500 is up about one-third as much, +480, but invariably, anti-gold writers prefer starting gold charts in early 1980.
Gold has beaten every historic currency over time. Most past currencies were inflated out of existence. Of those which remain, all are off 90% or more to gold in our adult lifetimes, since the 1960s. Gold is up 140-fold vs. the U.S. dollar since 1971, so today’s dollar is worth less than a 1971 penny, in gold terms.
Why Gold Has Soared Since 2000 – and Especially Since 2020
When measured against paper currencies, gold has had some long slumbers. The dollar out-performed gold for most of the 1980s, but that was a time of strong market growth, a strong dollar and strong American global leadership. This winning streak continued for most of the 1990s – but then came Y2k and 9-11.
In looking back to the dawn of this century, the first thing to address is our national myopia. We survived Y2k and the “dot com” bomb in 2000, so our leaders figured it would be smooth sailing from Year 1 on, but the 9-11 crisis caused two-decades of seemingly paranoid and endless “wars against terror,” including high-security regulations at home, but before the 9-11 attack, we enjoyed a budget surplus winning streak.
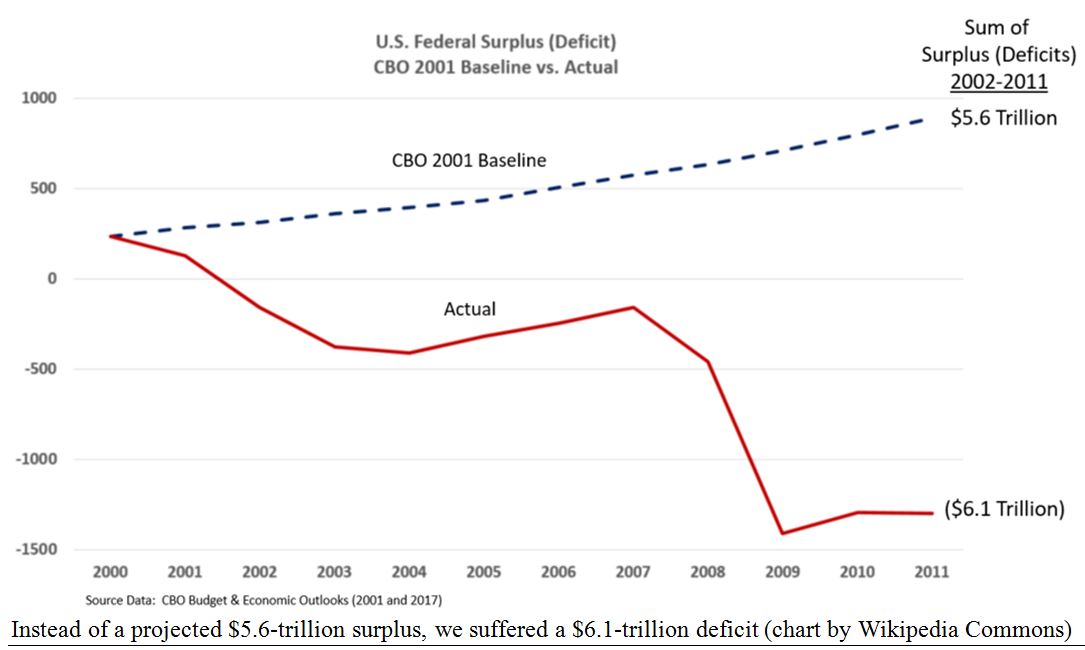
For four-consecutive fiscal years, 1998-2001, we ran a federal budget surplus, with both Parties joining forces to share the credit – President Clinton and his Republican-controlled Congress. Then, in 2001, the non-partisan Congressional Budget Office (CBO) predicted (in January) this winning streak would go on forever and we would pay off the entire national debt within a decade, by 2011. Specifically, the CBO’s early 2001 report projected a cumulative surplus of $5.6-trillion for the decade from 2001 to 2011.
Instead, deficits in that 10-year period reached $6.1-trillion, a negative swing of $11.7-trillion. They failed to anticipate those three Black Swans flying into the World Trade Center and Pentagon, and the bloated costs of Bush’s “War on Terror” after September 11, 2001, resulting in 20-year wars in Afghanistan and Iraq, then a real estate bubble, followed by bloated TARP bailouts to save big banks. From the CBO’s document, here is their guess, and miss:
Graphs are for illustrative and discussion purposes only. Please read important disclosures at the end of this commentary.
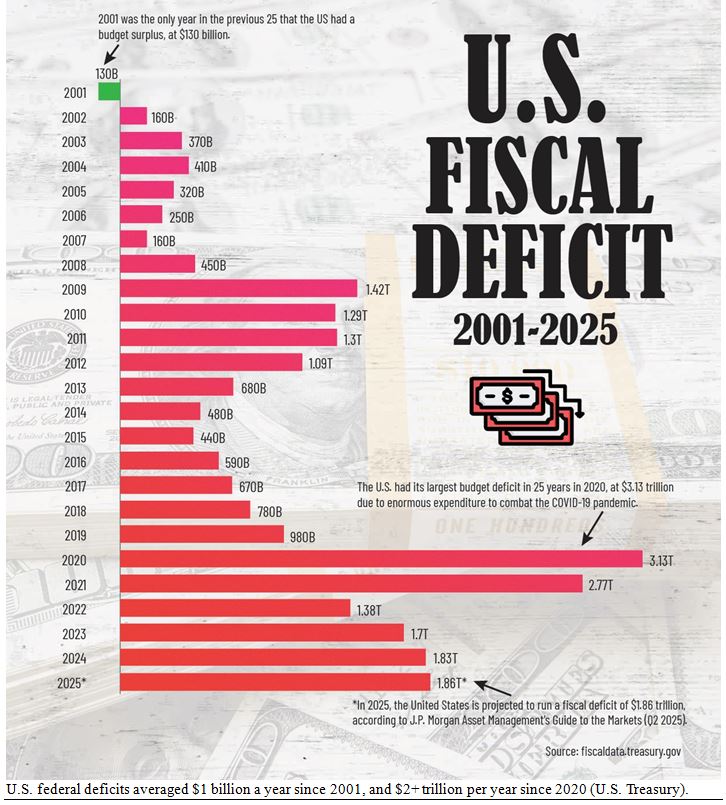
All that is pretty much ancient history by now, but the endless wars, the Fed’s panicky reaction to 2008 (with zero-interest rates for the following eight-years – effectively, the entire 8-year Obama presidency) led to massive deficits from the end of that crisis until today, especially in the post-COVID years.
These massive debts clearly demonstrate the major cause of gold’s 18-fold rise since 2001. I posted this chart in January, but I want to post it again as a single-shot graphic on why gold has soared since 2000:
Graphs are for illustrative and discussion purposes only. Please read important disclosures at the end of this commentary.
That’s why I start my own gold history charts in 2000, when our world was turned upside-down and huge deficits returned with a vengeance. Here is my own chart of gold vs. stocks, from our weekly gold letter:
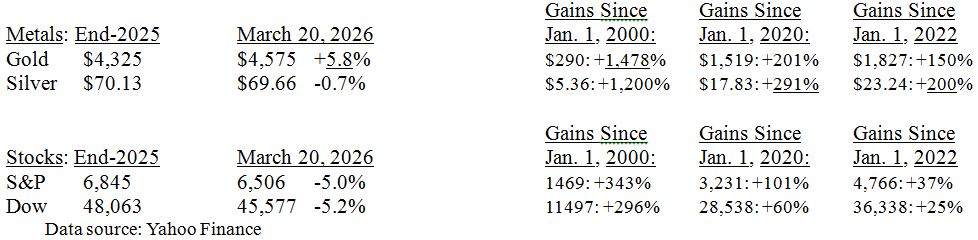
Gold is the clear winner so far this year, and since Y2k, out-gaining the S&P 500 by 4-to-1, +1,478% vs. +343%, while silver is a more recent winner, since 2020 (3-fold over stocks) or 2022 (a 5-fold edge).
I realize I am cherry-picking some of these dates, but I have a lot of other dates I could use to show gold’s superior gains, and the anti-gold crowd keep hawking charts starting in either 1980 or 2011. I just wish other chart-makers would also admit they choose their starting dates and ending dates to prove their case.
Navellier & Associates; do not own Berkshire Hathaway (BRK/A), in managed accounts. Gary Alexander does personally own Berkshire Hathaway (BRK/A).
All content above represents the opinion of Gary Alexander of Navellier & Associates, Inc.
Also In This Issue
A Look Ahead by Louis Navellier
Fed Chairman Powell’s Tough Talk Shakes the Markets
Income Mail by Bryan Perry
Short-Term Inflation is Taking a Toll
Growth Mail by Gary Alexander
With Wars and High Oil Prices, Why is Gold Lower?
Global Mail by Ivan Martchev
A “Force Majeure” in LNG Has Been Triggered
Sector Spotlight by Jason Bodner
Follow the Flows, Then Follow Through
View Full Archive
Read Past Issues Here
About The Author

Gary Alexander
SENIOR EDITOR
Gary Alexander has been Senior Writer at Navellier since 2009. He edits Navellier’s weekly Marketmail and writes a weekly Growth Mail column, in which he uses market history to support the case for growth stocks. For the previous 20-years before joining Navellier, he was Senior Executive Editor at InvestorPlace Media (formerly Phillips Publishing), where he worked with several leading investment analysts, including Louis Navellier (since 1997), helping launch Louis Navellier’s Blue Chip Growth and Global Growth newsletters.
Prior to that, Gary edited Wealth Magazine and Gold Newsletter and wrote various investment research reports for Jefferson Financial in New Orleans in the 1980s. He began his financial newsletter career with KCI Communications in 1980, where he served as consulting editor for Personal Finance newsletter while serving as general manager of KCI’s Alexandria House book division. Before that, he covered the economics beat for news magazines. All content of “Growth Mail” represents the opinion of Gary Alexander
Important Disclosures:
Although information in these reports has been obtained from and is based upon sources that Navellier believes to be reliable, Navellier does not guarantee its accuracy and it may be incomplete or condensed. All opinions and estimates constitute Navellier’s judgment as of the date the report was created and are subject to change without notice. These reports are for informational purposes only and are not a solicitation for the purchase or sale of a security. Any decision to purchase securities mentioned in these reports must take into account existing public information on such securities or any registered prospectus.To the extent permitted by law, neither Navellier & Associates, Inc., nor any of its affiliates, agents, or service providers assumes any liability or responsibility nor owes any duty of care for any consequences of any person acting or refraining to act in reliance on the information contained in this communication or for any decision based on it.
Past performance is no indication of future results. Investment in securities involves significant risk and has the potential for partial or complete loss of funds invested. It should not be assumed that any securities recommendations made by Navellier. in the future will be profitable or equal the performance of securities made in this report. Dividend payments are not guaranteed. The amount of a dividend payment, if any, can vary over time and issuers may reduce dividends paid on securities in the event of a recession or adverse event affecting a specific industry or issuer.
None of the stock information, data, and company information presented herein constitutes a recommendation by Navellier or a solicitation to buy or sell any securities. Any specific securities identified and described do not represent all of the securities purchased, sold, or recommended for advisory clients. The holdings identified do not represent all of the securities purchased, sold, or recommended for advisory clients and the reader should not assume that investments in the securities identified and discussed were or will be profitable.
Information presented is general information that does not take into account your individual circumstances, financial situation, or needs, nor does it present a personalized recommendation to you. Individual stocks presented may not be suitable for every investor. Investment in securities involves significant risk and has the potential for partial or complete loss of funds invested. Investment in fixed income securities has the potential for the investment return and principal value of an investment to fluctuate so that an investor’s holdings, when redeemed, may be worth less than their original cost.
One cannot invest directly in an index. Index is unmanaged and index performance does not reflect deduction of fees, expenses, or taxes. Presentation of Index data does not reflect a belief by Navellier that any stock index constitutes an investment alternative to any Navellier equity strategy or is necessarily comparable to such strategies. Among the most important differences between the Indices and Navellier strategies are that the Navellier equity strategies may (1) incur material management fees, (2) concentrate its investments in relatively few stocks, industries, or sectors, (3) have significantly greater trading activity and related costs, and (4) be significantly more or less volatile than the Indices.
ETF Risk: We may invest in exchange traded funds (“ETFs”) and some of our investment strategies are generally fully invested in ETFs. Like traditional mutual funds, ETFs charge asset-based fees, but they generally do not charge initial sales charges or redemption fees and investors typically pay only customary brokerage fees to buy and sell ETF shares. The fees and costs charged by ETFs held in client accounts will not be deducted from the compensation the client pays Navellier. ETF prices can fluctuate up or down, and a client account could lose money investing in an ETF if the prices of the securities owned by the ETF go down. ETFs are subject to additional risks:
- ETF shares may trade above or below their net asset value;
- An active trading market for an ETF’s shares may not develop or be maintained;
- The value of an ETF may be more volatile than the underlying portfolio of securities the ETF is designed to track;
- The cost of owning shares of the ETF may exceed those a client would incur by directly investing in the underlying securities; and
- Trading of an ETF’s shares may be halted if the listing exchange’s officials deem it appropriate, the shares are delisted from the exchange, or the activation of market-wide “circuit breakers” (which are tied to large decreases in stock prices) halts stock trading generally.
Grader Disclosures: Investment in equity strategies involves substantial risk and has the potential for partial or complete loss of funds invested. The sample portfolio and any accompanying charts are for informational purposes only and are not to be construed as a solicitation to buy or sell any financial instrument and should not be relied upon as the sole factor in an investment making decision. As a matter of normal and important disclosures to you, as a potential investor, please consider the following: The performance presented is not based on any actual securities trading, portfolio, or accounts, and the reported performance of the A, B, C, D, and F portfolios (collectively the “model portfolios”) should be considered mere “paper” or pro forma performance results based on Navellier’s research.
Investors evaluating any of Navellier & Associates, Inc.’s, (or its affiliates’) Investment Products must not use any information presented here, including the performance figures of the model portfolios, in their evaluation of any Navellier Investment Products. Navellier Investment Products include the firm’s mutual funds and managed accounts. The model portfolios, charts, and other information presented do not represent actual funded trades and are not actual funded portfolios. There are material differences between Navellier Investment Products’ portfolios and the model portfolios, research, and performance figures presented here. The model portfolios and the research results (1) may contain stocks or ETFs that are illiquid and difficult to trade; (2) may contain stock or ETF holdings materially different from actual funded Navellier Investment Product portfolios; (3) include the reinvestment of all dividends and other earnings, estimated trading costs, commissions, or management fees; and, (4) may not reflect prices obtained in an actual funded Navellier Investment Product portfolio. For these and other reasons, the reported performances of model portfolios do not reflect the performance results of Navellier’s actually funded and traded Investment Products. In most cases, Navellier’s Investment Products have materially lower performance results than the performances of the model portfolios presented.
This report contains statements that are, or may be considered to be, forward-looking statements. All statements that are not historical facts, including statements about our beliefs or expectations, are “forward-looking statements” within the meaning of The U.S. Private Securities Litigation Reform Act of 1995. These statements may be identified by such forward-looking terminology as “expect,” “estimate,” “plan,” “intend,” “believe,” “anticipate,” “may,” “will,” “should,” “could,” “continue,” “project,” or similar statements or variations of such terms. Our forward-looking statements are based on a series of expectations, assumptions, and projections, are not guarantees of future results or performance, and involve substantial risks and uncertainty as described in Form ADV Part 2A of our filing with the Securities and Exchange Commission (SEC), which is available at www.adviserinfo.sec.gov or by requesting a copy by emailing info@navellier.com. All of our forward-looking statements are as of the date of this report only. We can give no assurance that such expectations or forward-looking statements will prove to be correct. Actual results may differ materially. You are urged to carefully consider all such factors.
FEDERAL TAX ADVICE DISCLAIMER: As required by U.S. Treasury Regulations, you are informed that, to the extent this presentation includes any federal tax advice, the presentation is not written by Navellier to be used, and cannot be used, for the purpose of avoiding federal tax penalties. Navellier does not advise on any income tax requirements or issues. Use of any information presented by Navellier is for general information only and does not represent tax advice either express or implied. You are encouraged to seek professional tax advice for income tax questions and assistance.
IMPORTANT NEWSLETTER DISCLOSURE:The hypothetical performance results for investment newsletters that are authored or edited by Louis Navellier, including Louis Navellier’s Growth Investor, Louis Navellier’s Breakthrough Stocks, Louis Navellier’s Accelerated Profits, and Louis Navellier’s Platinum Club, are not based on any actual securities trading, portfolio, or accounts, and the newsletters’ reported hypothetical performances should be considered mere “paper” or proforma hypothetical performance results and are not actual performance of real world trades. Navellier & Associates, Inc. does not have any relation to or affiliation with the owner of these newsletters. There are material differences between Navellier Investment Products’ portfolios and the InvestorPlace Media, LLC newsletter portfolios authored by Louis Navellier. The InvestorPlace Media, LLC newsletters contain hypothetical performance that do not include transaction costs, advisory fees, or other fees a client might incur if actual investments and trades were being made by an investor. As a result, newsletter performance should not be used to evaluate Navellier Investment services which are separate and different from the newsletters. The owner of the newsletters is InvestorPlace Media, LLC and any questions concerning the newsletters, including any newsletter advertising or hypothetical Newsletter performance claims, (which are calculated solely by Investor Place Media and not Navellier) should be referred to InvestorPlace Media, LLC at (800) 718-8289.
Please note that Navellier & Associates and the Navellier Private Client Group are managed completely independent of the newsletters owned and published by InvestorPlace Media, LLC and written and edited by Louis Navellier, and investment performance of the newsletters should in no way be considered indicative of potential future investment performance for any Navellier & Associates separately managed account portfolio. Potential investors should consult with their financial advisor before investing in any Navellier Investment Product.
Navellier claims compliance with Global Investment Performance Standards (GIPS). To receive a complete list and descriptions of Navellier’s composites and/or a presentation that adheres to the GIPS standards, please contact Navellier or click here. It should not be assumed that any securities recommendations made by Navellier & Associates, Inc. in the future will be profitable or equal the performance of securities made in this report.
FactSet Disclosure: Navellier does not independently calculate the statistical information included in the attached report. The calculation and the information are provided by FactSet, a company not related to Navellier. Although information contained in the report has been obtained from FactSet and is based on sources Navellier believes to be reliable, Navellier does not guarantee its accuracy, and it may be incomplete or condensed. The report and the related FactSet sourced information are provided on an “as is” basis. The user assumes the entire risk of any use made of this information. Investors should consider the report as only a single factor in making their investment decision. The report is for informational purposes only and is not intended as an offer or solicitation for the purchase or sale of a security. FactSet sourced information is the exclusive property of FactSet. Without prior written permission of FactSet, this information may not be reproduced, disseminated or used to create any financial products. All indices are unmanaged and performance of the indices include reinvestment of dividends and interest income, unless otherwise noted, are not illustrative of any particular investment and an investment cannot be made in any index. Past performance is no guarantee of future results.