by Jason Bodner
March 3, 2026
Cleopatra lived closer in time to the moon landing (2000-years later) than to the building of the Great Pyramid (2500-years earlier). Perspective changes everything…. especially in the markets.
Over the past 35-years, the S&P 500 has risen roughly 1,850%, but the path was not smooth. During that rise, we endured the dot-com collapse, 9-11, Enron, the Great Financial Crisis and a global pandemic.
I have been a professional investor for over 25-years now. I started on-the-job training just before 9-11. Any illusion of calm soon disappeared. After that, markets shut-down for a week. Fear was everywhere.
That was just my first three-months on the job, in 2001. Since then, I watched Lehman fail and liquidity evaporate. I have seen funds implode and lived through COVID, when entire industries simply stopped.
Here is the truth: When I wake up to red-screens and my favorite stocks are bleeding, it still does not feel good. The only way I manage fear is by setting emotion aside and returning to the data, so let’s do that.
First, Check the Diagnostics
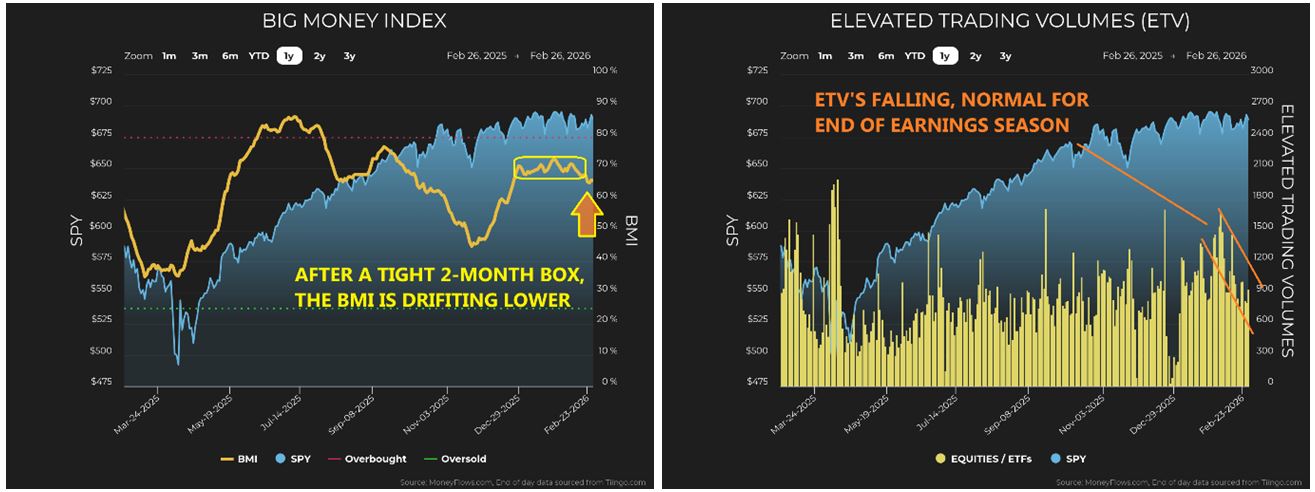
The S&P 500 has been moving side-ways for months. The Big Money Index (BMI), which measures institutional buying and selling, has drifted modestly lower since December. Currently it is sitting at 65%. (The 35-year average is 62%). Historically, readings in the 60s are healthy. During that massive 1,850% rise, the BMI spent plenty of time above 60, so a drop to 65 is not a warning sign of a bear-market.
Another important detail: The BMI softened, along with a decline in heavy-volume. Selling pressure is not accelerating. I worry when prices and flows fall together on rising volume, but this isn’t happening.
Graphs are for illustrative and discussion purposes only. Please read important disclosures at the end of this commentary.
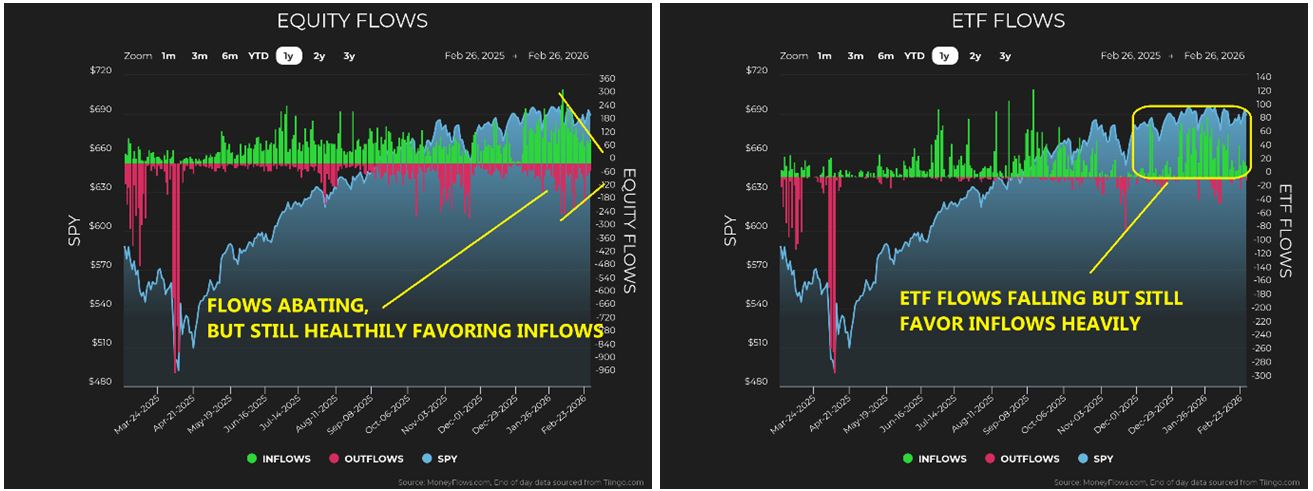
Equity flows cooled but inflows still out-number outflows. ETF inflows continue to exceed outflows.
The market is not euphoric, nor is it broken, but it does seem tired.
Graphs are for illustrative and discussion purposes only. Please read important disclosures at the end of this commentary.
Market Rotation
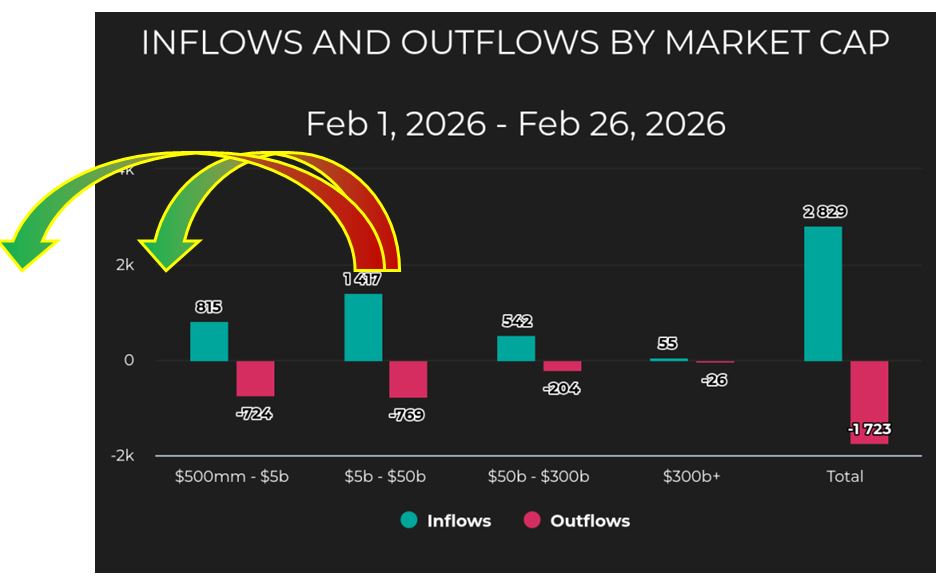
February saw a large rotation. Capital is switching from large-cap into smaller companies. The strongest inflows are in stocks sized $5 to $50-billion, plus the smaller stocks, as investors are discovering value.
Graphs are for illustrative and discussion purposes only. Please read important disclosures at the end of this commentary.
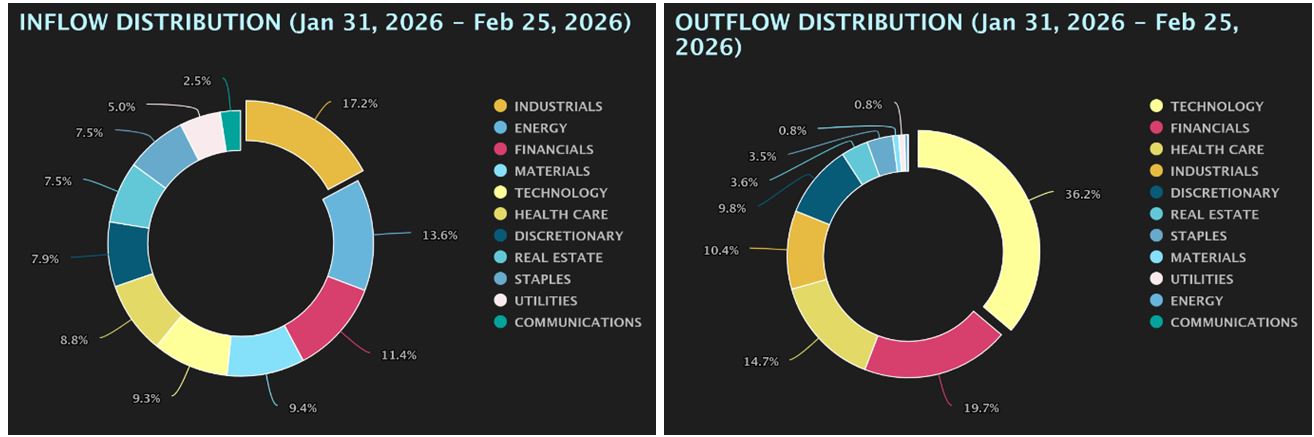
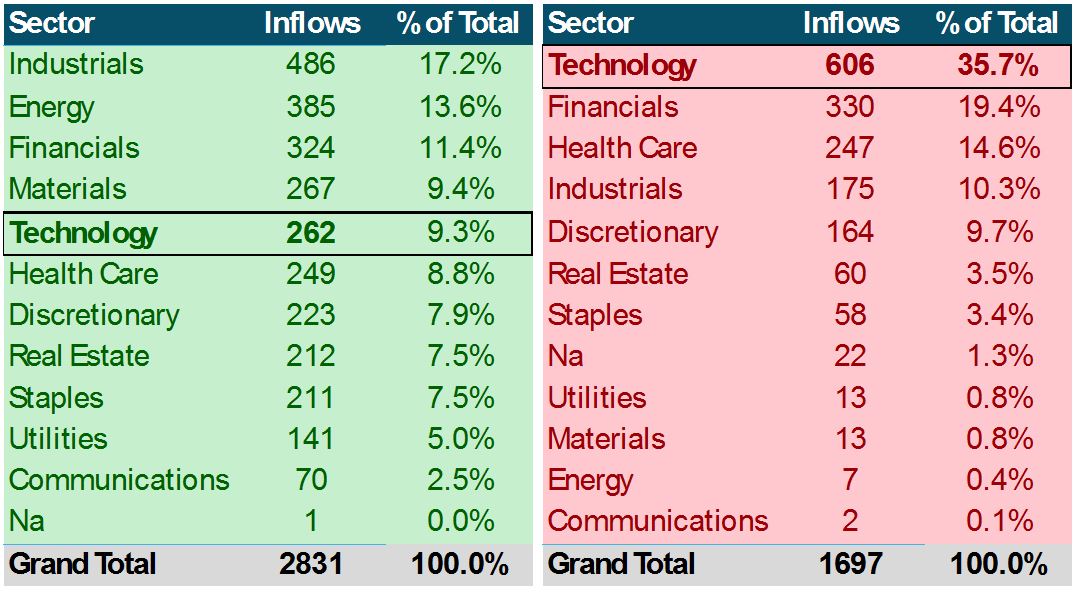
Sector flows confirm this. Technology accounts for roughly 36% of total outflows since early February. That capital has rotated, mostly into Industrials, Energy, Financials, Materials, and Utilities.
Graphs are for illustrative and discussion purposes only. Please read important disclosures at the end of this commentary.
Graphs are for illustrative and discussion purposes only. Please read important disclosures at the end of this commentary.
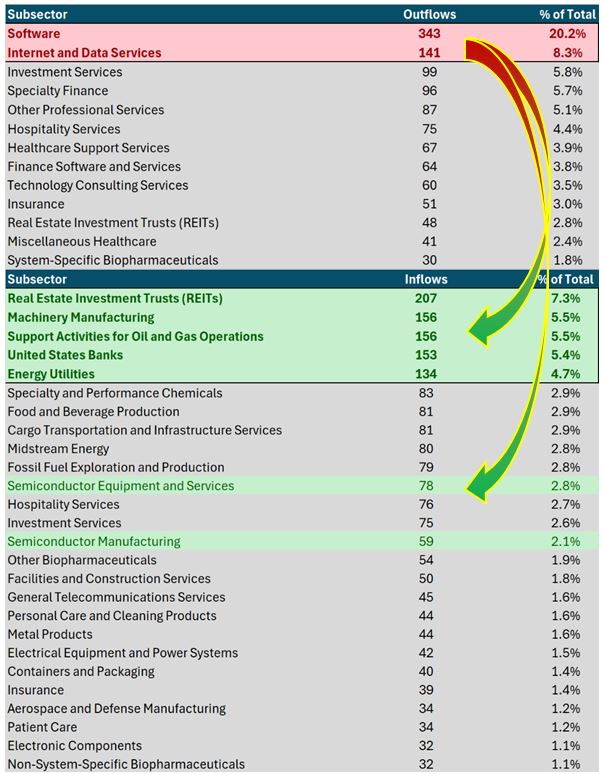
But this is not a simple “technology is dead” story. The truth is more nuanced. Nearly 30% of all outflows come from two sub-sectors: Software and Internet companies, where the selling has been sharp. It began with liquidation of profitable trades to fund margin calls in more speculative corners, especially crypto-currency. It has since been amplified by a narrative that artificial intelligence will cannibalize traditional software models.
At the same time, capital has poured into Semiconductors, another technology sub-sector.
Graphs are for illustrative and discussion purposes only. Please read important disclosures at the end of this commentary.
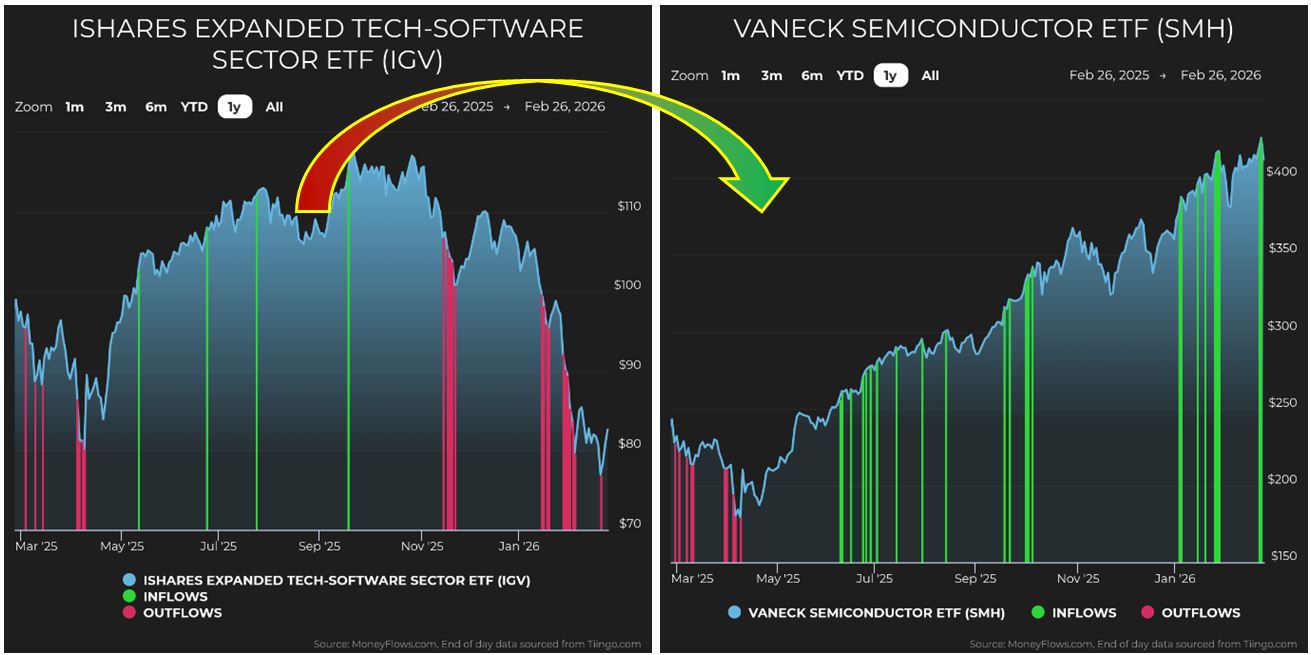
This divergence is striking. Software (IGV) has struggled. Semiconductors (SMH) have held firm.
Graphs are for illustrative and discussion purposes only. Please read important disclosures at the end of this commentary.
Investors are not abandoning technology. They are allocating within it.
Why? Because the tail-winds in chips are tangible.
Memory demand is exploding, as DRAM, NAND-Gate integrated circuits and related components sit at the core of the AI infrastructure. Micron’s leadership tells us tight-supply conditions could persist through and beyond 2026 as AI demand continues to out-strip capacity. The company has outlined plans to invest roughly $200-billion over time in new U.S. manufacturing to address this shortage.
When capital flees one corner of technology and rushes into another, it does not mean a collapse. It is repricing.
Outside of technology, inflows have clustered in REITs, Machinery, Oil and Gas, Banks, and Utilities. Small-cap and mid-cap value has absorbed much of the capital exiting software.
That behavior is consistent with a maturing cycle, not a market rolling over.
What Comes Next?
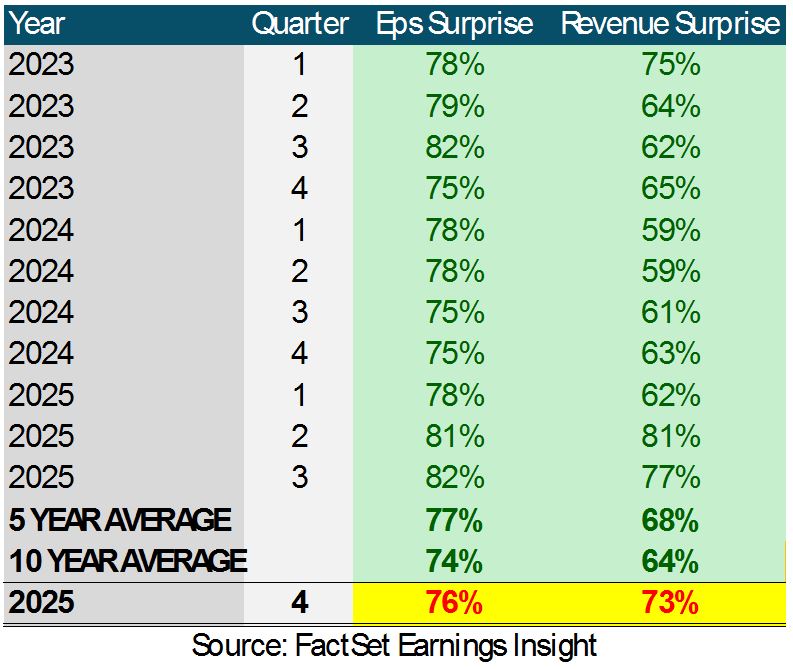
Earnings season is winding-down, and roughly three-quarters of S&P 500 companies have beaten earnings and revenue expectations, so the fundamental back-drop is not deteriorating.
Graphs are for illustrative and discussion purposes only. Please read important disclosures at the end of this commentary.
If liquidity dynamics change and earnings sag, trading liquidity thins. In a side-ways, fatigued market, thin liquidity can create sharp air-pockets. Algorithms can press short-term weakness if bids are light, widening spreads before covering. The result feels disorderly even if the broader structure remains intact.
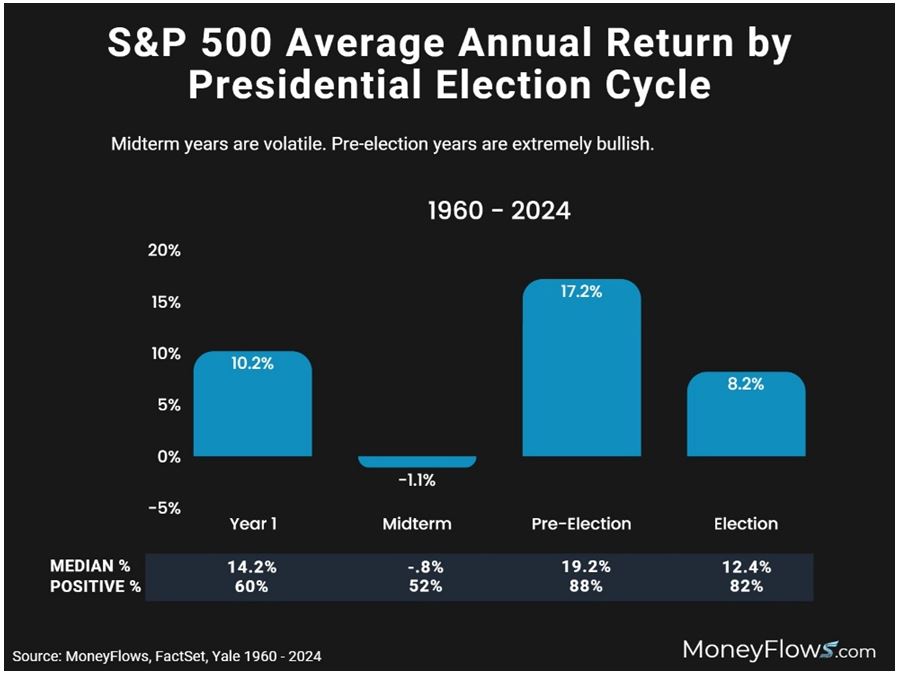
Add in the historic dangers of a mid-term election year. Since 1960, mid-term years have been the weakest of the four-year presidential cycle on average. It is the only year in the four-year political cycle which produced historically negative average returns. Markets dislike uncertainty, and elections can magnify it.
Graphs are for illustrative and discussion purposes only. Please read important disclosures at the end of this commentary.
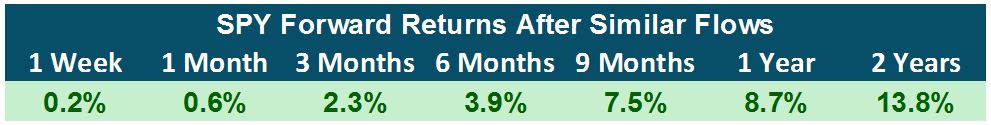
Looking at similar historical setups since 1990, when the Big Money Index sits above 60 but indexes drift side-ways, forward returns have tended to be muted in the near-term compared to 35-year averages.
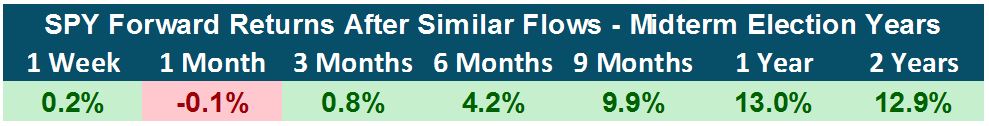
Layer in the mid-term effect and the pattern sharpens: Wall Street hates uncertainty. The news declares Trump possibly losing his base and Democrats chances of winning increasing. This breeds uncertainty, in-turn breeding volatility. This predicts choppy action early, stronger performance once political uncertainty resolves. 2022 was different because the market was already under heavy pressure, so it was absent from this study, however it would clearly drag down returns if it were in:
Graphs are for illustrative and discussion purposes only. Please read important disclosures at the end of this commentary.
The Immediate (vs. Long-Term) Future
Here is how I see the immediate future:
- Inflows still outnumber outflows, though momentum has cooled as earnings season ends.
- Capital is rotating out of Software into Semiconductors and value-oriented small and mid-cap stocks.
- Liquidity may thin in the coming months, increasing volatility.
- Midterm uncertainty likely keeps markets choppy until clarity returns.
This does not resemble 2008. It resembles a market digesting past gains and shifting leadership.
After 25-years, I have seen few markets actually break when they just “feel uncomfortable.” They break when the data deteriorates broadly. That is not what the flows are telling us today.
Volatility is part of business. It shakes confidence and tests conviction. It also creates opportunity for those who stay disciplined while others react.
“The stock market is a device for transferring money from the impatient to the patient.” – Warren Buffett.
All content above represents the opinion of Jason Bodner of Navellier & Associates, Inc.
Also In This Issue
A Look Ahead by Louis Navellier
The U.S. Remains the World’s Primary Economic Oasis
Income Mail by Bryan Perry
High Yield Investments Benefit from This Market Reset
Growth Mail by Gary Alexander
The Seeds of Growth Were Planted 250-Years Ago…
Global Mail by Ivan Martchev
The Iran War Begins, But Where Will It End?
Sector Spotlight by Jason Bodner
A Long-Term Perspective Makes Investing Success Likelier
View Full Archive
Read Past Issues Here

Jason Bodner
MARKETMAIL EDITOR FOR SECTOR SPOTLIGHT
Jason Bodner writes Sector Spotlight in the weekly Marketmail publication and has authored several white papers for the company. He is also Co-Founder of Macro Analytics for Professionals which produces proprietary equity accumulation and distribution research for its clients. Previously, Mr. Bodner served as Director of European Equity Derivatives for Cantor Fitzgerald Europe in London, then moved to the role of Head of Equity Derivatives North America for the same company in New York. He also served as S.V.P. Equity Derivatives for Jefferies, LLC. He received a B.S. in business administration in 1996, with honors, from Skidmore College as a member of the Periclean Honors Society. All content of “Sector Spotlight” represents the opinion of Jason Bodner
Important Disclosures:
Jason Bodner is a co-founder and co-owner of Mapsignals. Mr. Bodner is an independent contractor who is occasionally hired by Navellier & Associates to write an article and or provide opinions for possible use in articles that appear in Navellier & Associates weekly Market Mail. Mr. Bodner is not employed or affiliated with Louis Navellier, Navellier & Associates, Inc., or any other Navellier owned entity. The opinions and statements made here are those of Mr. Bodner and not necessarily those of any other persons or entities. This is not an endorsement, or solicitation or testimonial or investment advice regarding the BMI Index or any statements or recommendations or analysis in the article or the BMI Index or Mapsignals or its products or strategies.
Although information in these reports has been obtained from and is based upon sources that Navellier believes to be reliable, Navellier does not guarantee its accuracy and it may be incomplete or condensed. All opinions and estimates constitute Navellier’s judgment as of the date the report was created and are subject to change without notice. These reports are for informational purposes only and are not a solicitation for the purchase or sale of a security. Any decision to purchase securities mentioned in these reports must take into account existing public information on such securities or any registered prospectus.To the extent permitted by law, neither Navellier & Associates, Inc., nor any of its affiliates, agents, or service providers assumes any liability or responsibility nor owes any duty of care for any consequences of any person acting or refraining to act in reliance on the information contained in this communication or for any decision based on it.
Past performance is no indication of future results. Investment in securities involves significant risk and has the potential for partial or complete loss of funds invested. It should not be assumed that any securities recommendations made by Navellier. in the future will be profitable or equal the performance of securities made in this report. Dividend payments are not guaranteed. The amount of a dividend payment, if any, can vary over time and issuers may reduce dividends paid on securities in the event of a recession or adverse event affecting a specific industry or issuer.
None of the stock information, data, and company information presented herein constitutes a recommendation by Navellier or a solicitation to buy or sell any securities. Any specific securities identified and described do not represent all of the securities purchased, sold, or recommended for advisory clients. The holdings identified do not represent all of the securities purchased, sold, or recommended for advisory clients and the reader should not assume that investments in the securities identified and discussed were or will be profitable.
Information presented is general information that does not take into account your individual circumstances, financial situation, or needs, nor does it present a personalized recommendation to you. Individual stocks presented may not be suitable for every investor. Investment in securities involves significant risk and has the potential for partial or complete loss of funds invested. Investment in fixed income securities has the potential for the investment return and principal value of an investment to fluctuate so that an investor’s holdings, when redeemed, may be worth less than their original cost.
One cannot invest directly in an index. Index is unmanaged and index performance does not reflect deduction of fees, expenses, or taxes. Presentation of Index data does not reflect a belief by Navellier that any stock index constitutes an investment alternative to any Navellier equity strategy or is necessarily comparable to such strategies. Among the most important differences between the Indices and Navellier strategies are that the Navellier equity strategies may (1) incur material management fees, (2) concentrate its investments in relatively few stocks, industries, or sectors, (3) have significantly greater trading activity and related costs, and (4) be significantly more or less volatile than the Indices.
ETF Risk: We may invest in exchange traded funds (“ETFs”) and some of our investment strategies are generally fully invested in ETFs. Like traditional mutual funds, ETFs charge asset-based fees, but they generally do not charge initial sales charges or redemption fees and investors typically pay only customary brokerage fees to buy and sell ETF shares. The fees and costs charged by ETFs held in client accounts will not be deducted from the compensation the client pays Navellier. ETF prices can fluctuate up or down, and a client account could lose money investing in an ETF if the prices of the securities owned by the ETF go down. ETFs are subject to additional risks:
- ETF shares may trade above or below their net asset value;
- An active trading market for an ETF’s shares may not develop or be maintained;
- The value of an ETF may be more volatile than the underlying portfolio of securities the ETF is designed to track;
- The cost of owning shares of the ETF may exceed those a client would incur by directly investing in the underlying securities and;
- Trading of an ETF’s shares may be halted if the listing exchange’s officials deem it appropriate, the shares are delisted from the exchange, or the activation of market-wide “circuit breakers” (which are tied to large decreases in stock prices) halts stock trading generally.
Grader Disclosures: Investment in equity strategies involves substantial risk and has the potential for partial or complete loss of funds invested. The sample portfolio and any accompanying charts are for informational purposes only and are not to be construed as a solicitation to buy or sell any financial instrument and should not be relied upon as the sole factor in an investment making decision. As a matter of normal and important disclosures to you, as a potential investor, please consider the following: The performance presented is not based on any actual securities trading, portfolio, or accounts, and the reported performance of the A, B, C, D, and F portfolios (collectively the “model portfolios”) should be considered mere “paper” or pro forma performance results based on Navellier’s research.
Investors evaluating any of Navellier & Associates, Inc.’s, (or its affiliates’) Investment Products must not use any information presented here, including the performance figures of the model portfolios, in their evaluation of any Navellier Investment Products. Navellier Investment Products include the firm’s mutual funds and managed accounts. The model portfolios, charts, and other information presented do not represent actual funded trades and are not actual funded portfolios. There are material differences between Navellier Investment Products’ portfolios and the model portfolios, research, and performance figures presented here. The model portfolios and the research results (1) may contain stocks or ETFs that are illiquid and difficult to trade; (2) may contain stock or ETF holdings materially different from actual funded Navellier Investment Product portfolios; (3) include the reinvestment of all dividends and other earnings, estimated trading costs, commissions, or management fees; and, (4) may not reflect prices obtained in an actual funded Navellier Investment Product portfolio. For these and other reasons, the reported performances of model portfolios do not reflect the performance results of Navellier’s actually funded and traded Investment Products. In most cases, Navellier’s Investment Products have materially lower performance results than the performances of the model portfolios presented.
This report contains statements that are, or may be considered to be, forward-looking statements. All statements that are not historical facts, including statements about our beliefs or expectations, are “forward-looking statements” within the meaning of The U.S. Private Securities Litigation Reform Act of 1995. These statements may be identified by such forward-looking terminology as “expect,” “estimate,” “plan,” “intend,” “believe,” “anticipate,” “may,” “will,” “should,” “could,” “continue,” “project,” or similar statements or variations of such terms. Our forward-looking statements are based on a series of expectations, assumptions, and projections, are not guarantees of future results or performance, and involve substantial risks and uncertainty as described in Form ADV Part 2A of our filing with the Securities and Exchange Commission (SEC), which is available at www.adviserinfo.sec.gov or by requesting a copy by emailing info@navellier.com. All of our forward-looking statements are as of the date of this report only. We can give no assurance that such expectations or forward-looking statements will prove to be correct. Actual results may differ materially. You are urged to carefully consider all such factors.
FEDERAL TAX ADVICE DISCLAIMER: As required by U.S. Treasury Regulations, you are informed that, to the extent this presentation includes any federal tax advice, the presentation is not written by Navellier to be used, and cannot be used, for the purpose of avoiding federal tax penalties. Navellier does not advise on any income tax requirements or issues. Use of any information presented by Navellier is for general information only and does not represent tax advice either express or implied. You are encouraged to seek professional tax advice for income tax questions and assistance.
IMPORTANT NEWSLETTER DISCLOSURE:The hypothetical performance results for investment newsletters that are authored or edited by Louis Navellier, including Louis Navellier’s Growth Investor, Louis Navellier’s Breakthrough Stocks, Louis Navellier’s Accelerated Profits, and Louis Navellier’s Platinum Club, are not based on any actual securities trading, portfolio, or accounts, and the newsletters’ reported hypothetical performances should be considered mere “paper” or proforma hypothetical performance results and are not actual performance of real world trades. Navellier & Associates, Inc. does not have any relation to or affiliation with the owner of these newsletters. There are material differences between Navellier Investment Products’ portfolios and the InvestorPlace Media, LLC newsletter portfolios authored by Louis Navellier. The InvestorPlace Media, LLC newsletters contain hypothetical performance that do not include transaction costs, advisory fees, or other fees a client might incur if actual investments and trades were being made by an investor. As a result, newsletter performance should not be used to evaluate Navellier Investment services which are separate and different from the newsletters. The owner of the newsletters is InvestorPlace Media, LLC and any questions concerning the newsletters, including any newsletter advertising or hypothetical Newsletter performance claims, (which are calculated solely by Investor Place Media and not Navellier) should be referred to InvestorPlace Media, LLC at (800) 718-8289.
Please note that Navellier & Associates and the Navellier Private Client Group are managed completely independent of the newsletters owned and published by InvestorPlace Media, LLC and written and edited by Louis Navellier, and investment performance of the newsletters should in no way be considered indicative of potential future investment performance for any Navellier & Associates separately managed account portfolio. Potential investors should consult with their financial advisor before investing in any Navellier Investment Product.
Navellier claims compliance with Global Investment Performance Standards (GIPS). To receive a complete list and descriptions of Navellier’s composites and/or a presentation that adheres to the GIPS standards, please contact Navellier or click here. It should not be assumed that any securities recommendations made by Navellier & Associates, Inc. in the future will be profitable or equal the performance of securities made in this report.
FactSet Disclosure: Navellier does not independently calculate the statistical information included in the attached report. The calculation and the information are provided by FactSet, a company not related to Navellier. Although information contained in the report has been obtained from FactSet and is based on sources Navellier believes to be reliable, Navellier does not guarantee its accuracy, and it may be incomplete or condensed. The report and the related FactSet sourced information are provided on an “as is” basis. The user assumes the entire risk of any use made of this information. Investors should consider the report as only a single factor in making their investment decision. The report is for informational purposes only and is not intended as an offer or solicitation for the purchase or sale of a security. FactSet sourced information is the exclusive property of FactSet. Without prior written permission of FactSet, this information may not be reproduced, disseminated or used to create any financial products. All indices are unmanaged and performance of the indices include reinvestment of dividends and interest income, unless otherwise noted, are not illustrative of any particular investment and an investment cannot be made in any index. Past performance is no guarantee of future results.