by Jason Bodner
February 10, 2026
For most of its existence, the universe was dark. After the Big Bang, matter existed without stars or clear structure. Gravity slowly pulled particles together until conditions finally allowed light to form. Nothing dramatic marked the transition. It happened quietly, driven by accumulation rather than by big changes.
Markets tend to work the same way.
The most important shifts rarely announce themselves. They develop beneath the surface, visible first in positioning and capital movement, not reflected in price or narrative. Last week offered a clear example.
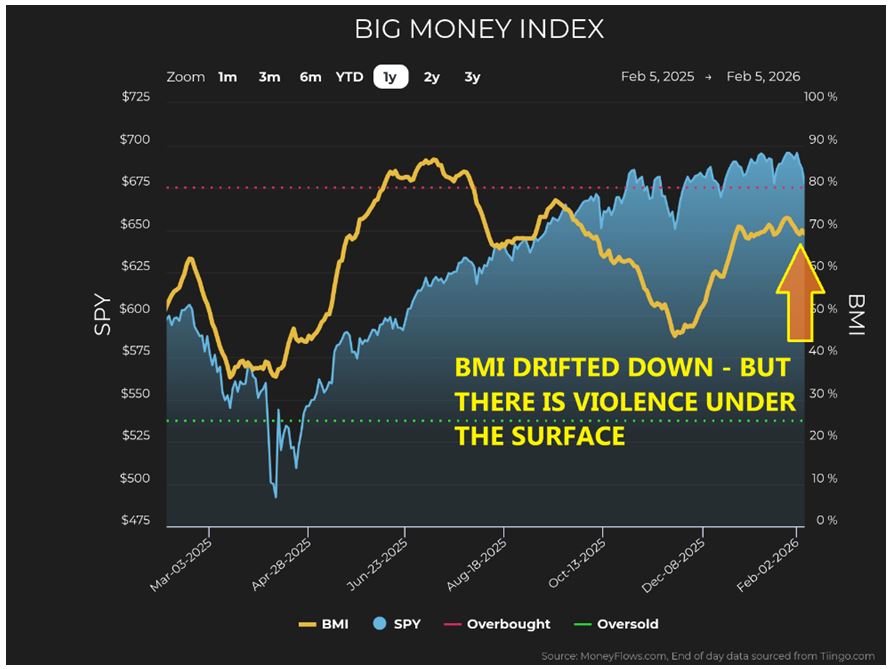
Let’s start at the top. The Big Money Index (BMI) dropped from 72.9 on January 27th to 69.2 last Friday.
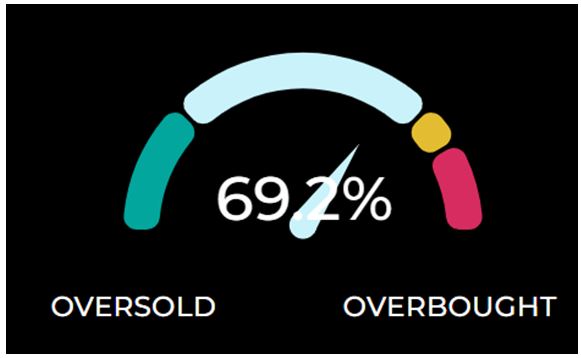
The slowness of the decline reflects a calm drift, yet I see some violent rotation underneath the surface.
Graphs are for illustrative and discussion purposes only. Please read important disclosures at the end of this commentary.
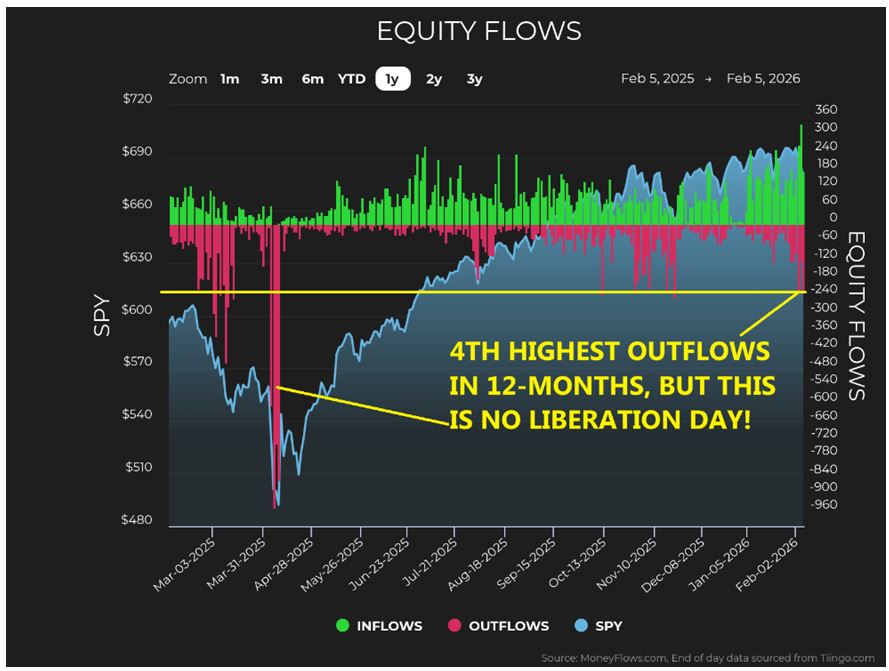
Equity outflows have accelerated. We are seeing the most intense equity outflows since November, and the fourth strongest outflow period of the past 12-months. On its own, this suggests some caution.
Graphs are for illustrative and discussion purposes only. Please read important disclosures at the end of this commentary.
What makes this different is what is happening alongside those outflows. In the past six-trading sessions, there were 1,206 inflow signals versus 926-outflows. While selling pressure is elevated, capital is clearly being reallocated rather than fleeing risk. This is not a flight to cash; it is a clear rotation.
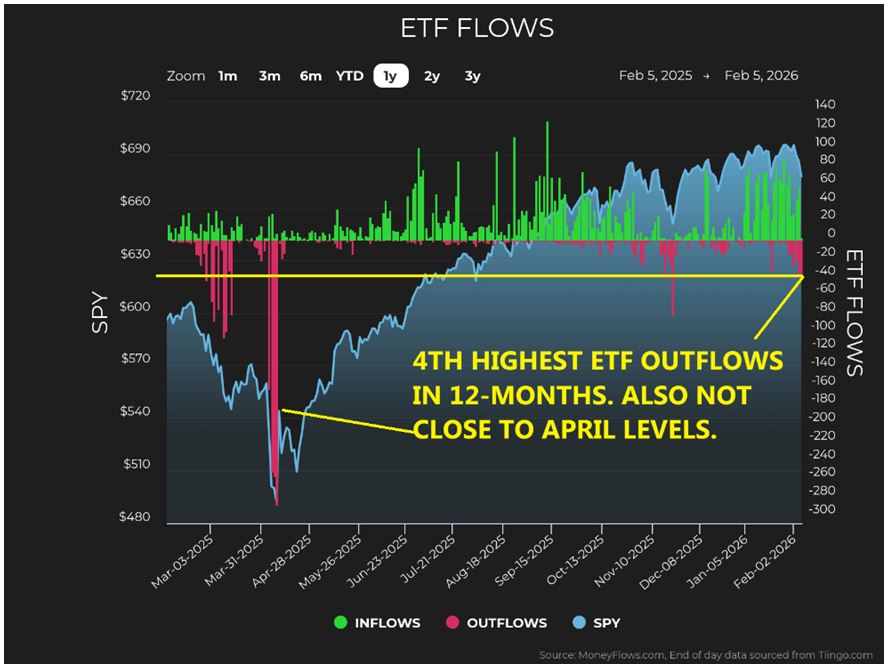
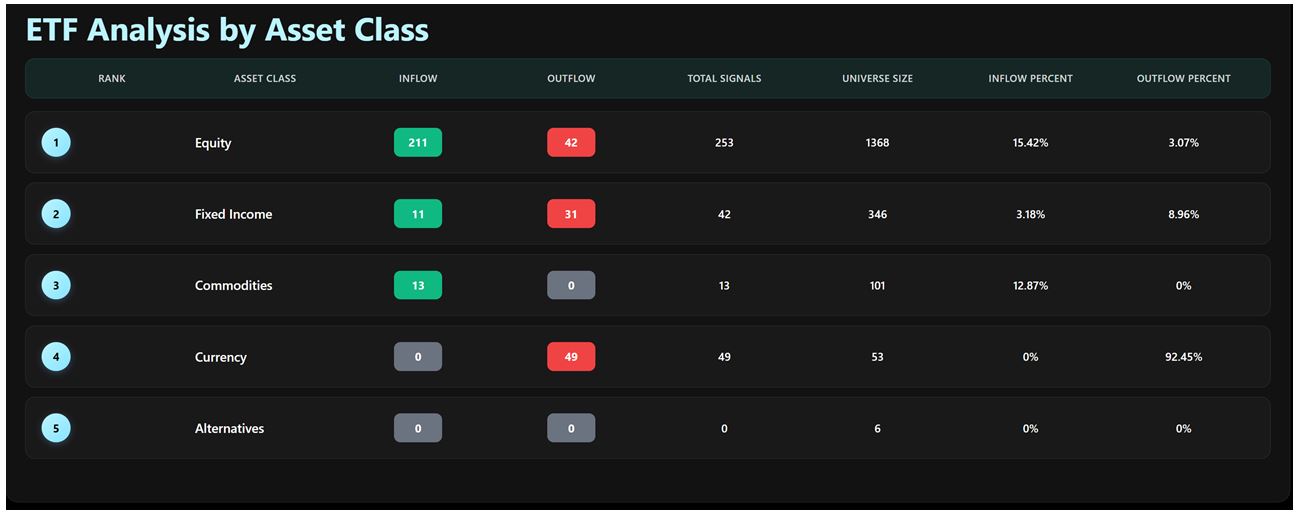
ETF data reinforces the point. This is the fourth instance this year of elevated ETF outflows, but unlike prior episodes, it is occurring with heavy inflows, as investors are repositioning, not de-risking wholesale.
Graphs are for illustrative and discussion purposes only. Please read important disclosures at the end of this commentary.
Trading activity supports this interpretation. Elevated Trading Volumes (unusually large trades) are nearly three-times their 20-year average: Recent readings average 1,480 vs a long-term average of 526.
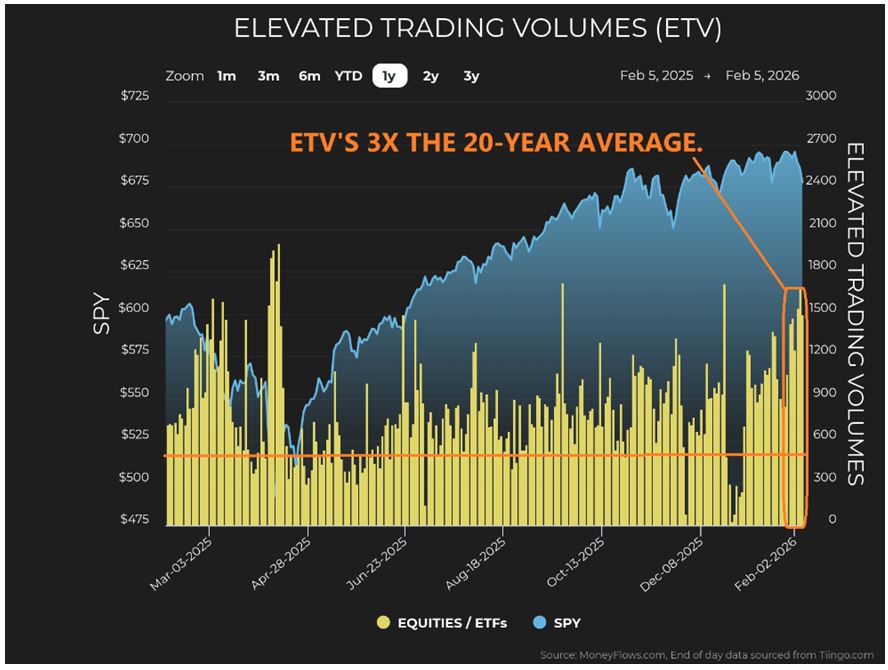
Graphs are for illustrative and discussion purposes only. Please read important disclosures at the end of this commentary.
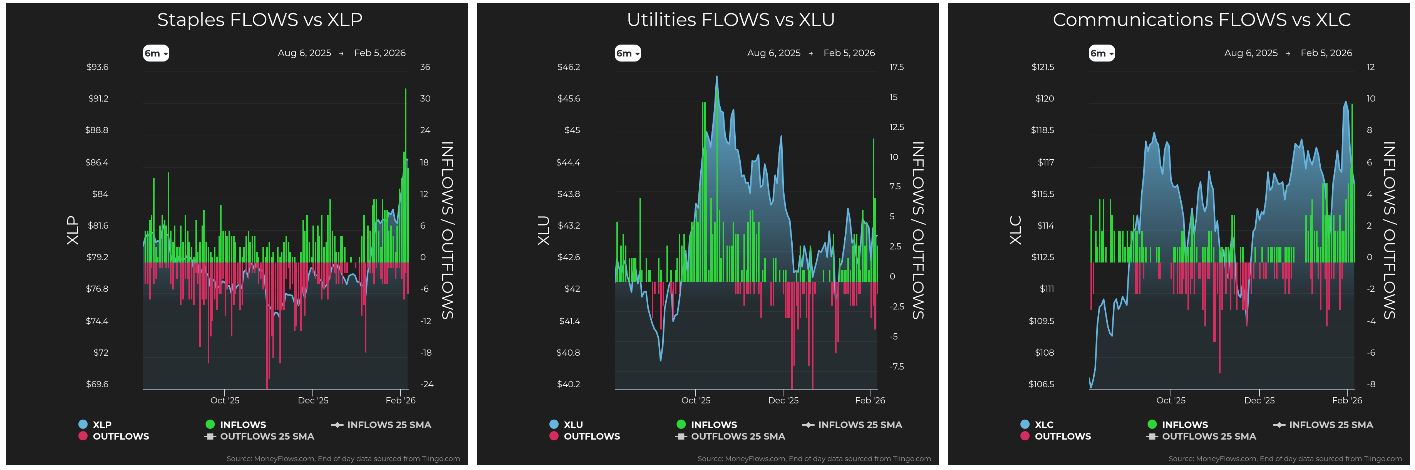
At the sector level, leadership shifted. Defensive groups such as Consumer Staples and Utilities have risen in the rankings, while growth-oriented sectors like Consumer Discretionary and Technology have moved lower. Such rotation is consistent with capital redistributing within equities, not abandoning them.
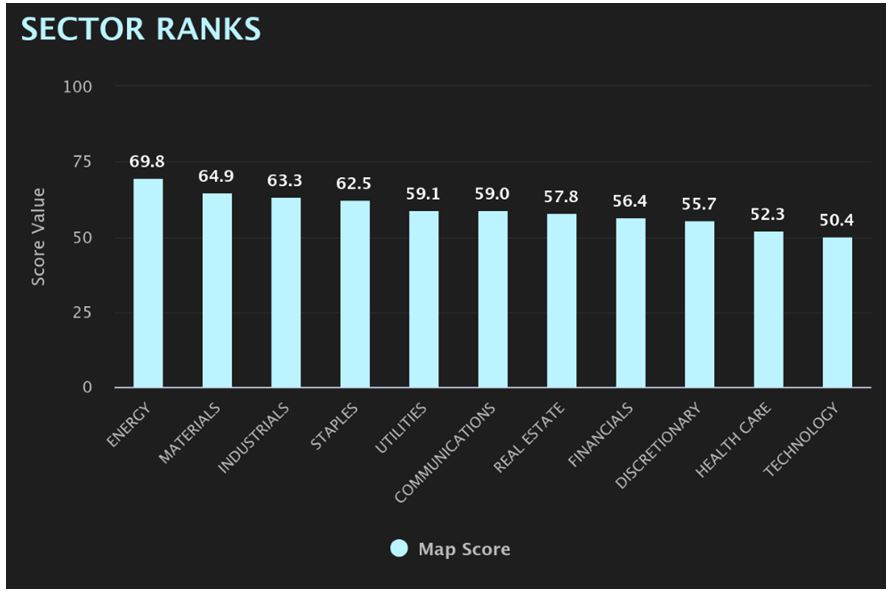
Graphs are for illustrative and discussion purposes only. Please read important disclosures at the end of this commentary.
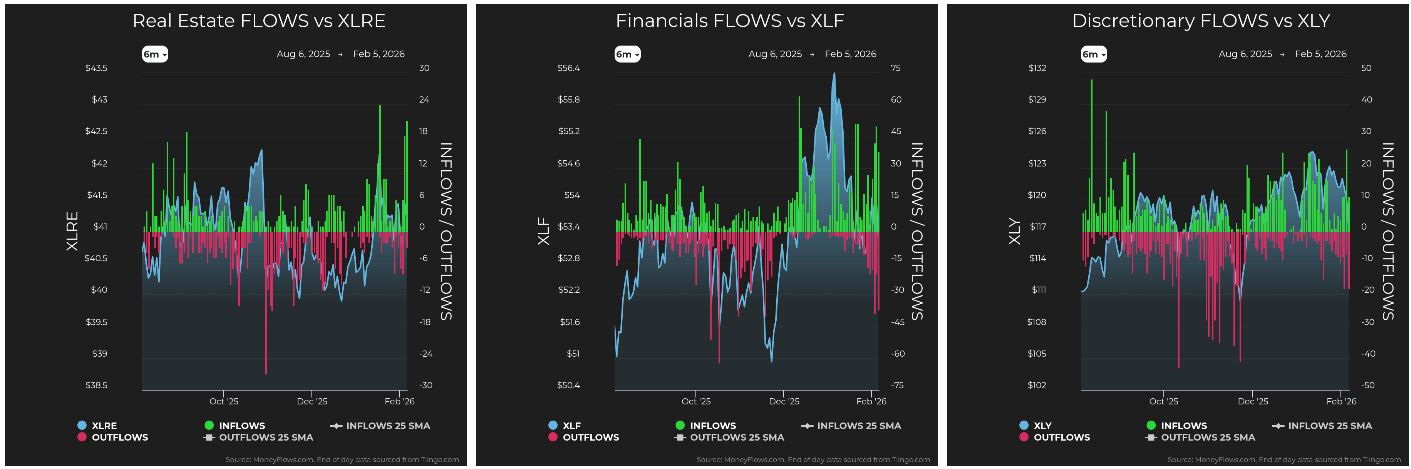
Graphs are for illustrative and discussion purposes only. Please read important disclosures at the end of this commentary.
Taken together, the top-level data paints a clear picture. Volatility has increased. Outflows have risen, but inflows remain active and engaged. Money is moving, not leaving the market.
We’re Seeing Rotation, Not Retreat
Markets look unsettled. Crypto-currency was roasted. Technology felt the burn. Some capital moved into dividend yield and large-caps. While this behavior may look defensive, the money flows suggest something else.
Graphs are for illustrative and discussion purposes only. Please read important disclosures at the end of this commentary.
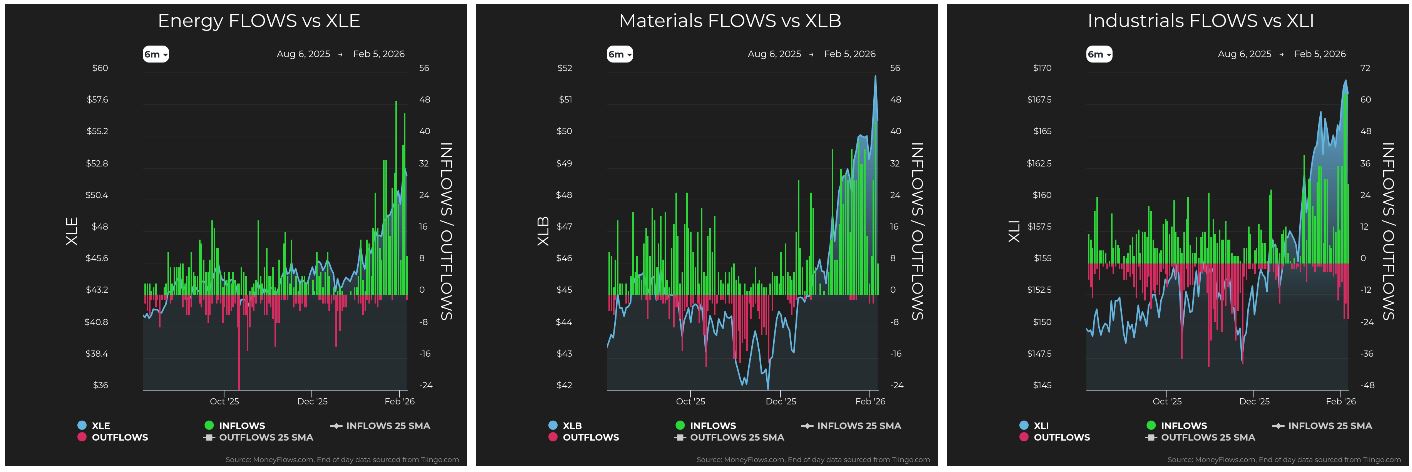
Capital rotated aggressively into small-caps and cyclical sectors. Energy, Industrials, Financials, and Materials all saw strong inflows. Small-cap and mid-cap indices significantly out-performed large-cap benchmarks. This does not align with broad risk aversion. It aligns with leadership change.
This is where flows add more clarity than prices alone. Different market participants operate on different timelines. Some are forced sellers, responding to margin calls. Others are allocators repositioning capital for what comes next. When those actions occur simultaneously, the market sends mixed signals.
If you watch price alone, you may struggle to explain it, but money flows make it visible.
Episodes like this are often amplified, and sometimes initiated, by systematic and high-frequency trading. Algorithms respond to price, volatility, and liquidity. When volatility rises, these systems react instantly, often accelerating moves which would otherwise unfold more gradually. In crowded areas like technology and crypto-currency, where amplification can be significant. This matters because it explains why moves can feel sudden and exaggerated without reflecting a true shift in long-term fundamentals.
Retail investors tend to act last. Historically, individual investors are not the first to sell technology stocks during corrections. They respond after price damage becomes obvious and narratives turn decisively negative. We’re not there yet. Most of the activity so far has been institutional and algorithmic.
To understand the source of the volatility, start with crypto-currency. Over the past several sessions, ETF outflows across Bitcoin and Ethereum products were broad and uniform. This was not selective selling. It was mechanical. When flows behave this way, leverage is usually the driver.
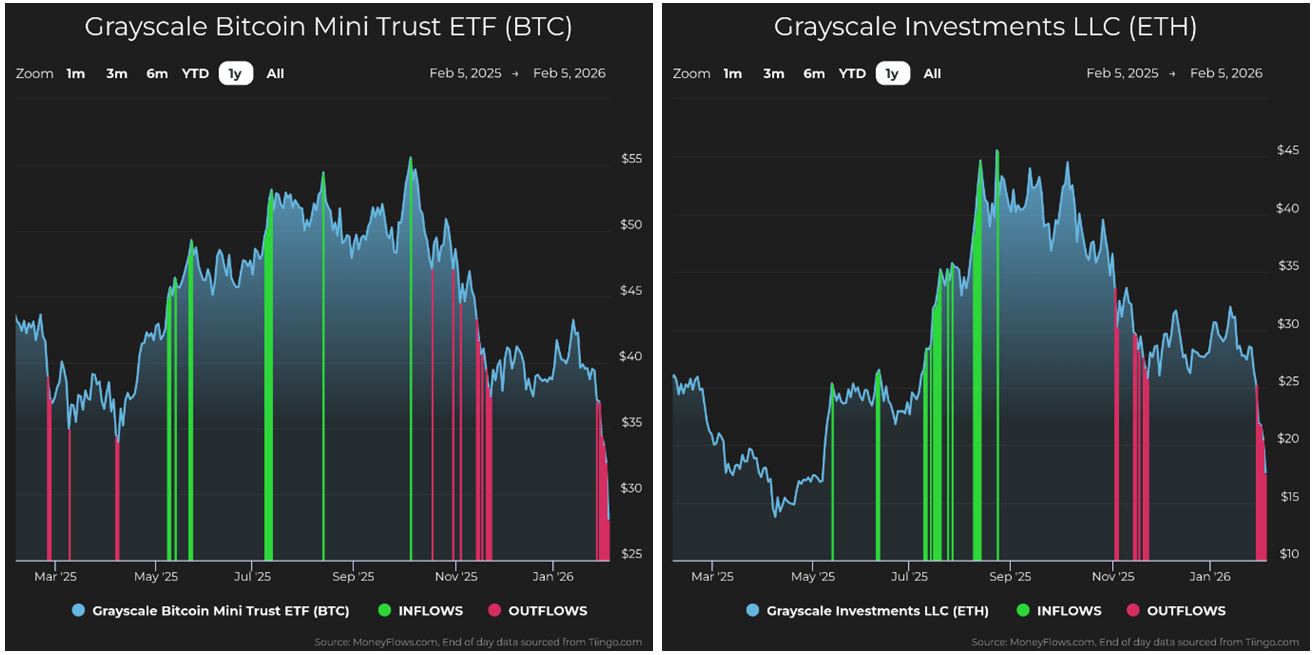
Graphs are for illustrative and discussion purposes only. Please read important disclosures at the end of this commentary.
Crypto-currency remains one of the most leveraged parts of the market. Leverage works until volatility rises. When prices move sharply, brokers reduce risk. Margin requirements tighten. Positions are cut. Because crypto-currency margin is less standardized than equity margin, deleveraging can happen quickly and unevenly.
We see deleveraging as well in silver. After a meteoric rise, a sudden violent collapse:
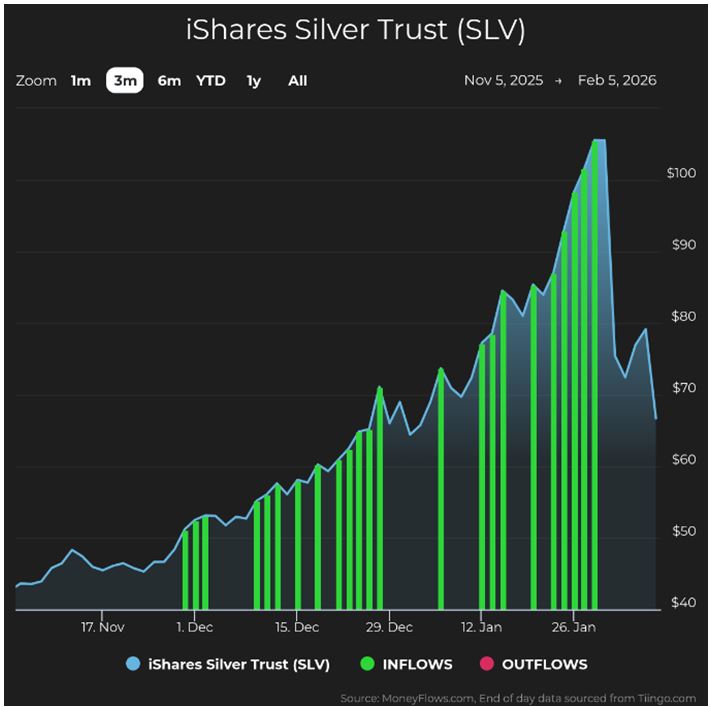
Graphs are for illustrative and discussion purposes only. Please read important disclosures at the end of this commentary.
When leverage unwinds, investors sell what they can. Embedded gains become liquidity, which is how pressure originating in crypto-currency spills into other areas, even when fundamentals are unchanged.
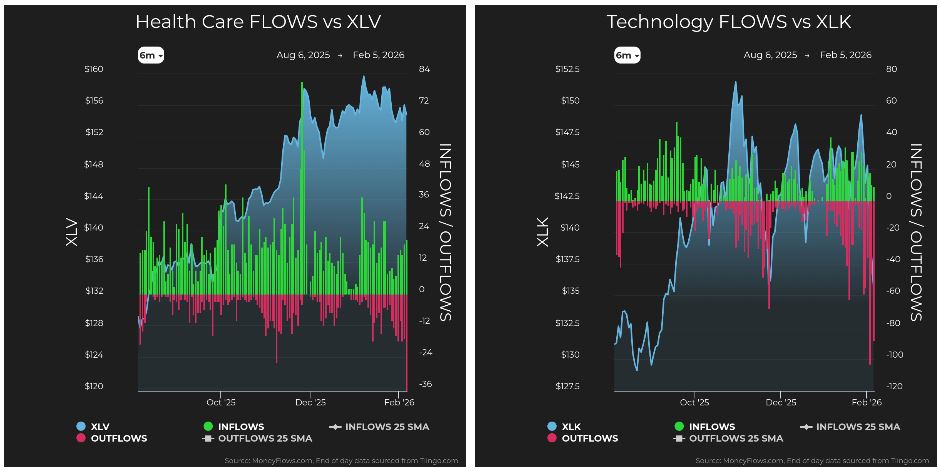
Why Technology Felt the Impact
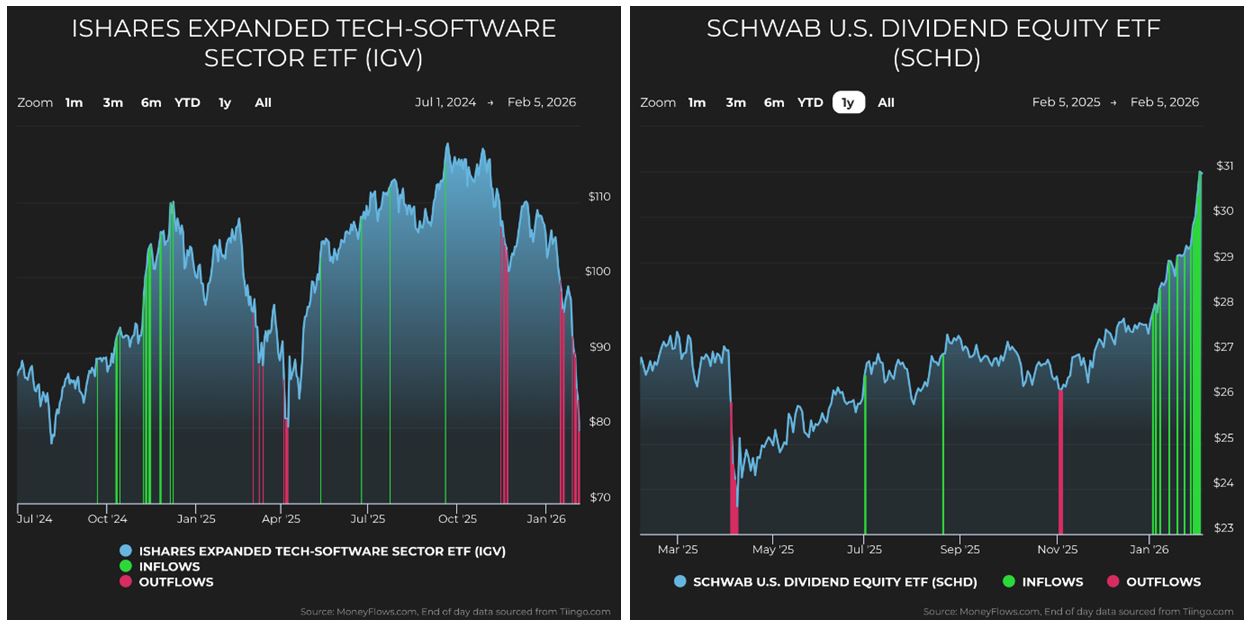
Technology absorbed much of the recent pressure. Technology is liquid and heavily owned. Imbedded profits are often the first source of capital during forced selling. Software stocks, in particular, were hit hard, not because earnings deteriorated, but because positioning was crowded and gains were available.
Graphs are for illustrative and discussion purposes only. Please read important disclosures at the end of this commentary.
At the same time, some capital rotated into dividend yield and large-caps. On its own, such behavior looks defensive. In context, it looks temporary. A holding pattern while leverage is reduced.
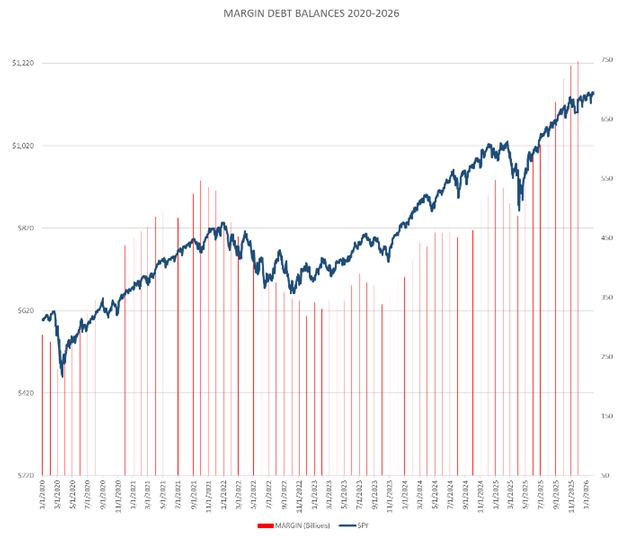
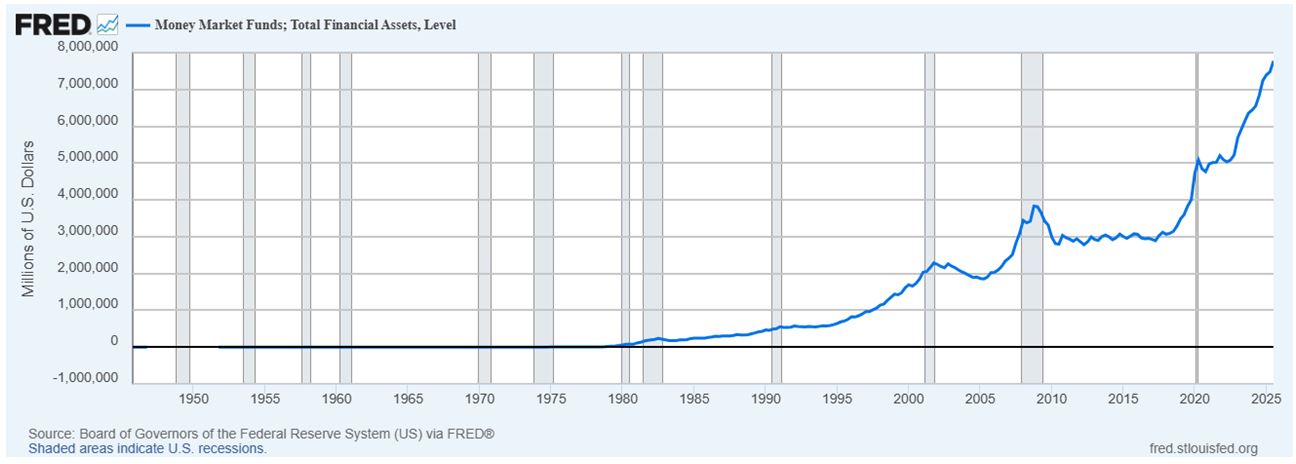
The broader backdrop reinforces this interpretation. Margin debt is at the highest level in history charted below. At the same time, cash balances are also at record highs. This combination produces sharp, fast moves. Leverage magnifies volatility. Cash limits how far dislocations tend to travel.
Graphs are for illustrative and discussion purposes only. Please read important disclosures at the end of this commentary.
We have seen this pattern before. A brief air-pocket forms as leverage is reduced. Volatility rises. Narratives follow price. Capital then reallocates and leadership shifts. This is rotation, not liquidation. The distinction matters because rotation redistributes capital. Liquidation removes it.
What Money Flows Are Saying Now
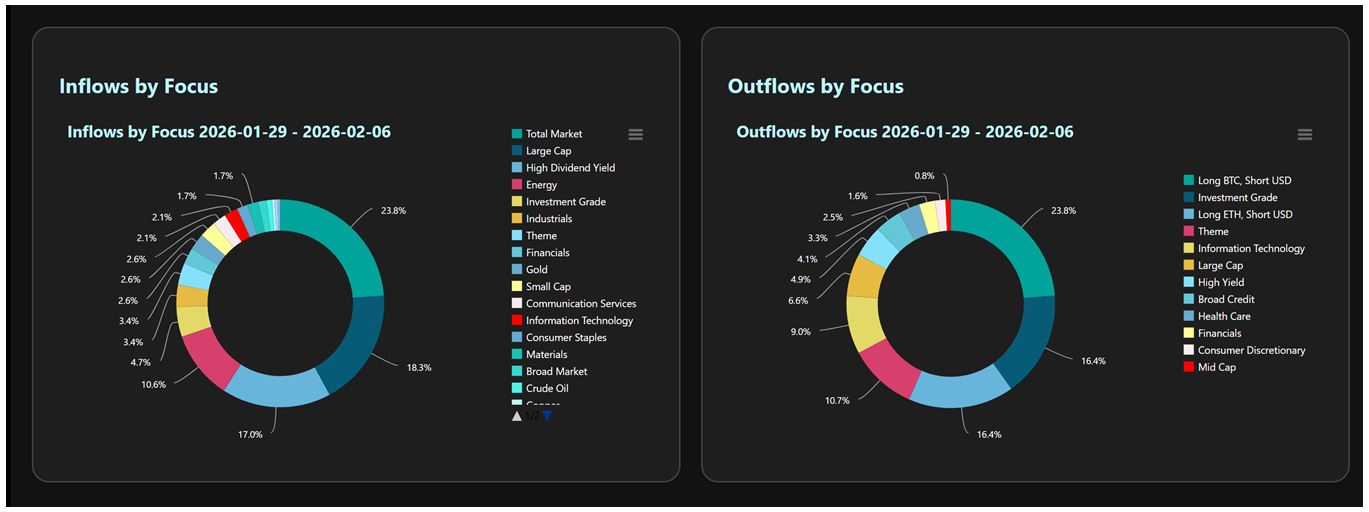
To summarize, the money flow data supports the rotation view. While outflows spiked, we also just had one of the largest inflow days in over a year. Hundreds of stocks saw institutional accumulation. When segmented by market capitalization, small-cap and mid-caps dominated. Sector data showed heavy buying in cyclicals while technology absorbed nearly half of total outflows.
ETF flows told the same story. Capital moved away from leveraged crypto-currency exposure and crowded technology products toward small-caps and cyclical assets. When multiple datasets align, it is worth paying attention.
Graphs are for illustrative and discussion purposes only. Please read important disclosures at the end of this commentary.
Near term, small-caps and cyclicals are attracting capital. Energy, Industrials, Financials, and Materials are the rising sectors. Longer term, nothing about this rotation undermines the structural case for technology. Periods of forced selling often create opportunities rather than deterioration.
I am selectively adding high-quality software names with multi-year horizons, reflecting my views about forced positioning says more than headlines. I am also watching crypto-currency as a dislocated asset. When the leverage unwinds, prices tend to overshoot. Risk and reward rebalance before sentiment does.
The broader takeaway matters more than any individual allocation.
Markets are complex systems shaped by leverage, liquidity, and behavior. Expecting clean stories leads to late decisions. Watching capital move provides clarity when price alone does not.
As Seneca wrote, “Luck is what happens when preparation meets opportunity.”
All content above represents the opinion of Jason Bodner of Navellier & Associates, Inc.
Also In This Issue
A Look Ahead by Louis Navellier
Why I Think Gold Will Reach $10,000 by the End of 2029
Income Mail by Bryan Perry
We’re Seeing a Perfect Tailwind for Convertible Debt
Growth Mail by Gary Alexander
At Dow 50k, Will We Fear “Big Numbers” Again?
Global Mail by Ivan Martchev
The Iranian Issue Is Far from Resolved
Sector Spotlight by Jason Bodner
Most of the Time, Reasons for Market Moves are Not Obvious
View Full Archive
Read Past Issues Here

Jason Bodner
MARKETMAIL EDITOR FOR SECTOR SPOTLIGHT
Jason Bodner writes Sector Spotlight in the weekly Marketmail publication and has authored several white papers for the company. He is also Co-Founder of Macro Analytics for Professionals which produces proprietary equity accumulation and distribution research for its clients. Previously, Mr. Bodner served as Director of European Equity Derivatives for Cantor Fitzgerald Europe in London, then moved to the role of Head of Equity Derivatives North America for the same company in New York. He also served as S.V.P. Equity Derivatives for Jefferies, LLC. He received a B.S. in business administration in 1996, with honors, from Skidmore College as a member of the Periclean Honors Society. All content of “Sector Spotlight” represents the opinion of Jason Bodner
Important Disclosures:
Jason Bodner is a co-founder and co-owner of Mapsignals. Mr. Bodner is an independent contractor who is occasionally hired by Navellier & Associates to write an article and or provide opinions for possible use in articles that appear in Navellier & Associates weekly Market Mail. Mr. Bodner is not employed or affiliated with Louis Navellier, Navellier & Associates, Inc., or any other Navellier owned entity. The opinions and statements made here are those of Mr. Bodner and not necessarily those of any other persons or entities. This is not an endorsement, or solicitation or testimonial or investment advice regarding the BMI Index or any statements or recommendations or analysis in the article or the BMI Index or Mapsignals or its products or strategies.
Although information in these reports has been obtained from and is based upon sources that Navellier believes to be reliable, Navellier does not guarantee its accuracy and it may be incomplete or condensed. All opinions and estimates constitute Navellier’s judgment as of the date the report was created and are subject to change without notice. These reports are for informational purposes only and are not a solicitation for the purchase or sale of a security. Any decision to purchase securities mentioned in these reports must take into account existing public information on such securities or any registered prospectus.To the extent permitted by law, neither Navellier & Associates, Inc., nor any of its affiliates, agents, or service providers assumes any liability or responsibility nor owes any duty of care for any consequences of any person acting or refraining to act in reliance on the information contained in this communication or for any decision based on it.
Past performance is no indication of future results. Investment in securities involves significant risk and has the potential for partial or complete loss of funds invested. It should not be assumed that any securities recommendations made by Navellier. in the future will be profitable or equal the performance of securities made in this report. Dividend payments are not guaranteed. The amount of a dividend payment, if any, can vary over time and issuers may reduce dividends paid on securities in the event of a recession or adverse event affecting a specific industry or issuer.
None of the stock information, data, and company information presented herein constitutes a recommendation by Navellier or a solicitation to buy or sell any securities. Any specific securities identified and described do not represent all of the securities purchased, sold, or recommended for advisory clients. The holdings identified do not represent all of the securities purchased, sold, or recommended for advisory clients and the reader should not assume that investments in the securities identified and discussed were or will be profitable.
Information presented is general information that does not take into account your individual circumstances, financial situation, or needs, nor does it present a personalized recommendation to you. Individual stocks presented may not be suitable for every investor. Investment in securities involves significant risk and has the potential for partial or complete loss of funds invested. Investment in fixed income securities has the potential for the investment return and principal value of an investment to fluctuate so that an investor’s holdings, when redeemed, may be worth less than their original cost.
One cannot invest directly in an index. Index is unmanaged and index performance does not reflect deduction of fees, expenses, or taxes. Presentation of Index data does not reflect a belief by Navellier that any stock index constitutes an investment alternative to any Navellier equity strategy or is necessarily comparable to such strategies. Among the most important differences between the Indices and Navellier strategies are that the Navellier equity strategies may (1) incur material management fees, (2) concentrate its investments in relatively few stocks, industries, or sectors, (3) have significantly greater trading activity and related costs, and (4) be significantly more or less volatile than the Indices.
ETF Risk: We may invest in exchange traded funds (“ETFs”) and some of our investment strategies are generally fully invested in ETFs. Like traditional mutual funds, ETFs charge asset-based fees, but they generally do not charge initial sales charges or redemption fees and investors typically pay only customary brokerage fees to buy and sell ETF shares. The fees and costs charged by ETFs held in client accounts will not be deducted from the compensation the client pays Navellier. ETF prices can fluctuate up or down, and a client account could lose money investing in an ETF if the prices of the securities owned by the ETF go down. ETFs are subject to additional risks:
- ETF shares may trade above or below their net asset value;
- An active trading market for an ETF’s shares may not develop or be maintained;
- The value of an ETF may be more volatile than the underlying portfolio of securities the ETF is designed to track;
- The cost of owning shares of the ETF may exceed those a client would incur by directly investing in the underlying securities and;
- Trading of an ETF’s shares may be halted if the listing exchange’s officials deem it appropriate, the shares are delisted from the exchange, or the activation of market-wide “circuit breakers” (which are tied to large decreases in stock prices) halts stock trading generally.
Grader Disclosures: Investment in equity strategies involves substantial risk and has the potential for partial or complete loss of funds invested. The sample portfolio and any accompanying charts are for informational purposes only and are not to be construed as a solicitation to buy or sell any financial instrument and should not be relied upon as the sole factor in an investment making decision. As a matter of normal and important disclosures to you, as a potential investor, please consider the following: The performance presented is not based on any actual securities trading, portfolio, or accounts, and the reported performance of the A, B, C, D, and F portfolios (collectively the “model portfolios”) should be considered mere “paper” or pro forma performance results based on Navellier’s research.
Investors evaluating any of Navellier & Associates, Inc.’s, (or its affiliates’) Investment Products must not use any information presented here, including the performance figures of the model portfolios, in their evaluation of any Navellier Investment Products. Navellier Investment Products include the firm’s mutual funds and managed accounts. The model portfolios, charts, and other information presented do not represent actual funded trades and are not actual funded portfolios. There are material differences between Navellier Investment Products’ portfolios and the model portfolios, research, and performance figures presented here. The model portfolios and the research results (1) may contain stocks or ETFs that are illiquid and difficult to trade; (2) may contain stock or ETF holdings materially different from actual funded Navellier Investment Product portfolios; (3) include the reinvestment of all dividends and other earnings, estimated trading costs, commissions, or management fees; and, (4) may not reflect prices obtained in an actual funded Navellier Investment Product portfolio. For these and other reasons, the reported performances of model portfolios do not reflect the performance results of Navellier’s actually funded and traded Investment Products. In most cases, Navellier’s Investment Products have materially lower performance results than the performances of the model portfolios presented.
This report contains statements that are, or may be considered to be, forward-looking statements. All statements that are not historical facts, including statements about our beliefs or expectations, are “forward-looking statements” within the meaning of The U.S. Private Securities Litigation Reform Act of 1995. These statements may be identified by such forward-looking terminology as “expect,” “estimate,” “plan,” “intend,” “believe,” “anticipate,” “may,” “will,” “should,” “could,” “continue,” “project,” or similar statements or variations of such terms. Our forward-looking statements are based on a series of expectations, assumptions, and projections, are not guarantees of future results or performance, and involve substantial risks and uncertainty as described in Form ADV Part 2A of our filing with the Securities and Exchange Commission (SEC), which is available at www.adviserinfo.sec.gov or by requesting a copy by emailing info@navellier.com. All of our forward-looking statements are as of the date of this report only. We can give no assurance that such expectations or forward-looking statements will prove to be correct. Actual results may differ materially. You are urged to carefully consider all such factors.
FEDERAL TAX ADVICE DISCLAIMER: As required by U.S. Treasury Regulations, you are informed that, to the extent this presentation includes any federal tax advice, the presentation is not written by Navellier to be used, and cannot be used, for the purpose of avoiding federal tax penalties. Navellier does not advise on any income tax requirements or issues. Use of any information presented by Navellier is for general information only and does not represent tax advice either express or implied. You are encouraged to seek professional tax advice for income tax questions and assistance.
IMPORTANT NEWSLETTER DISCLOSURE:The hypothetical performance results for investment newsletters that are authored or edited by Louis Navellier, including Louis Navellier’s Growth Investor, Louis Navellier’s Breakthrough Stocks, Louis Navellier’s Accelerated Profits, and Louis Navellier’s Platinum Club, are not based on any actual securities trading, portfolio, or accounts, and the newsletters’ reported hypothetical performances should be considered mere “paper” or proforma hypothetical performance results and are not actual performance of real world trades. Navellier & Associates, Inc. does not have any relation to or affiliation with the owner of these newsletters. There are material differences between Navellier Investment Products’ portfolios and the InvestorPlace Media, LLC newsletter portfolios authored by Louis Navellier. The InvestorPlace Media, LLC newsletters contain hypothetical performance that do not include transaction costs, advisory fees, or other fees a client might incur if actual investments and trades were being made by an investor. As a result, newsletter performance should not be used to evaluate Navellier Investment services which are separate and different from the newsletters. The owner of the newsletters is InvestorPlace Media, LLC and any questions concerning the newsletters, including any newsletter advertising or hypothetical Newsletter performance claims, (which are calculated solely by Investor Place Media and not Navellier) should be referred to InvestorPlace Media, LLC at (800) 718-8289.
Please note that Navellier & Associates and the Navellier Private Client Group are managed completely independent of the newsletters owned and published by InvestorPlace Media, LLC and written and edited by Louis Navellier, and investment performance of the newsletters should in no way be considered indicative of potential future investment performance for any Navellier & Associates separately managed account portfolio. Potential investors should consult with their financial advisor before investing in any Navellier Investment Product.
Navellier claims compliance with Global Investment Performance Standards (GIPS). To receive a complete list and descriptions of Navellier’s composites and/or a presentation that adheres to the GIPS standards, please contact Navellier or click here. It should not be assumed that any securities recommendations made by Navellier & Associates, Inc. in the future will be profitable or equal the performance of securities made in this report.
FactSet Disclosure: Navellier does not independently calculate the statistical information included in the attached report. The calculation and the information are provided by FactSet, a company not related to Navellier. Although information contained in the report has been obtained from FactSet and is based on sources Navellier believes to be reliable, Navellier does not guarantee its accuracy, and it may be incomplete or condensed. The report and the related FactSet sourced information are provided on an “as is” basis. The user assumes the entire risk of any use made of this information. Investors should consider the report as only a single factor in making their investment decision. The report is for informational purposes only and is not intended as an offer or solicitation for the purchase or sale of a security. FactSet sourced information is the exclusive property of FactSet. Without prior written permission of FactSet, this information may not be reproduced, disseminated or used to create any financial products. All indices are unmanaged and performance of the indices include reinvestment of dividends and interest income, unless otherwise noted, are not illustrative of any particular investment and an investment cannot be made in any index. Past performance is no guarantee of future results.