by Ivan Martchev
February 3, 2026
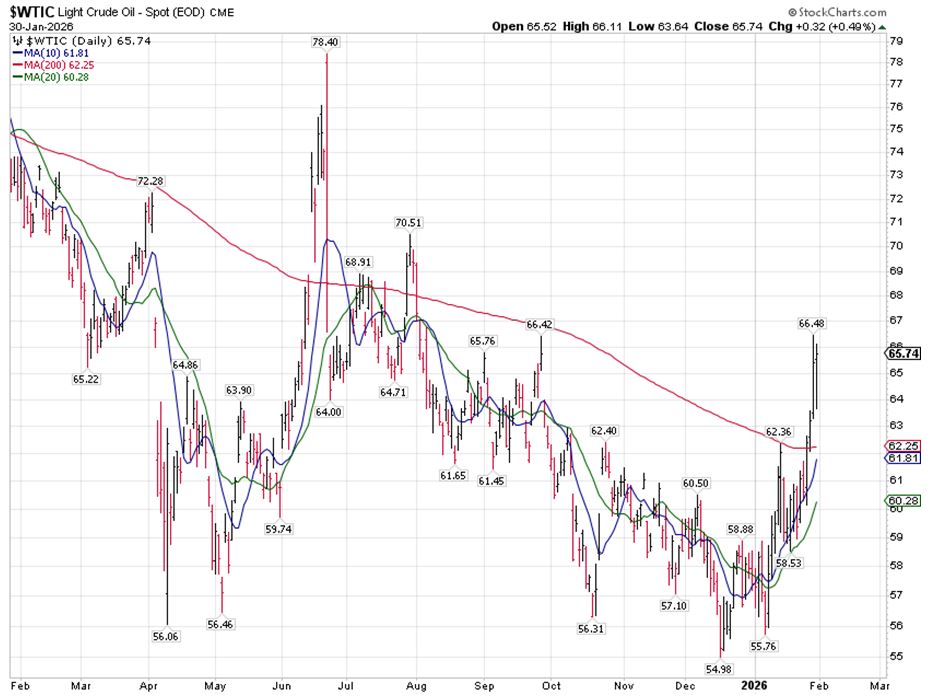
The stock market is concerned about war in Iran – and this concern is not limited to stocks. Crude oil, the most important global commodity, rose 7.65% last week, capping a move of over 10% in two-weeks.
The cause for this concern is obvious in this map. About 20% of global oil supply passes through the Strait on a daily basis, which is quite meaningful. The Strait of Hormuz is the global choke-point in any military conflict with Iran, and the Iranians surely have a strategy to utilize this geographical leverage.

Graphs are for illustrative and discussion purposes only. Please read important disclosures at the end of this commentary.
I am sure the Trump administration has some type of Venezuela-like strategy for regime change, which arguably was very cleverly executed with the ouster of Maduro, but the Iranians are likely to put up a much bigger fight, or so it seems. To be honest, I am not sure how one executes a regime change strategy without U.S. boots on the ground. The Venezuelans are playing along, as they have no other good option, but any heavy bombardment of Iran is unlikely to generate any meaningful kind of cooperation there.
Graphs are for illustrative and discussion purposes only. Please read important disclosures at the end of this commentary.
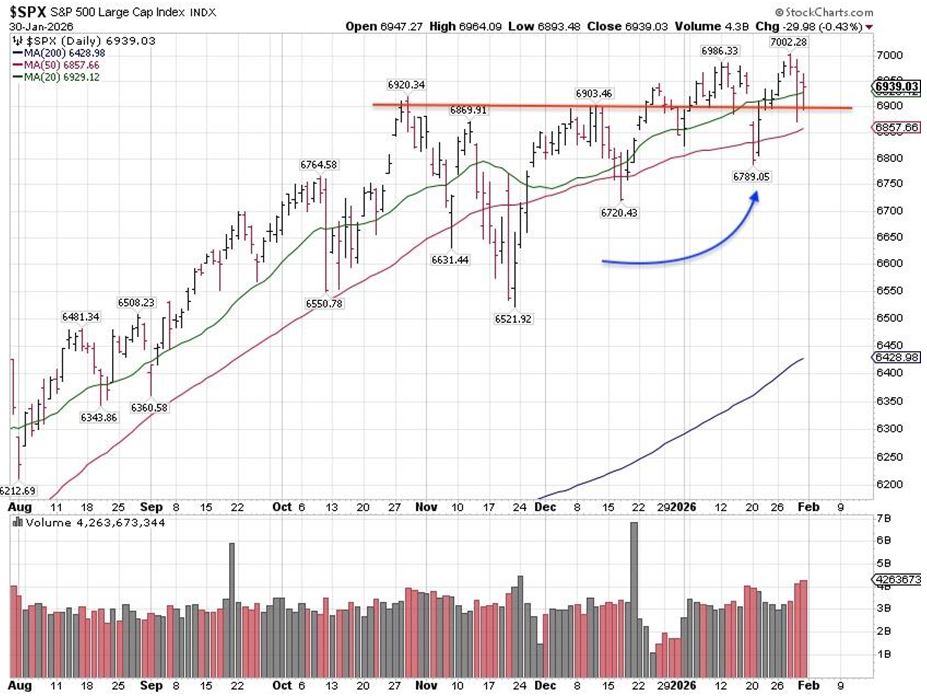
Crude oil made it to $78.40 in June last year, when Iran and Israel had their conflict, in which the U.S. intervened. If not quickly executed, an Iranian regime change scenario lingering too long would cause oil to go a lot higher. The price depends on whether or not the Strait of Hormuz is used as a global choke-hold, which I suspect it would be. Such considerations have been the reason why the first peak above 7000 of the S&P 500 last week was met with selling into strength from Wednesday through Friday.
Graphs are for illustrative and discussion purposes only. Please read important disclosures at the end of this commentary.
The S&P 500 trading above 6,900 so far has been used as an opportunity to unload positions, so right now this big consolidation process (since October) is starting to look more and more like selling into strength.
Mind you, a bigger correction is contingent on an Iranian confrontation getting drawn out and the oil price spiking, which has not happened yet, and I have no way of knowing whether it will happen. If it were not for Iran, the market would be appreciating, as earnings are rising and the economy is in good shape.
A likely scenario is an Iranian confrontation fueling a deeper correction, similar to the Tariff Tantrum last year, and we may see a huge rally afterward, because of good earnings and good economic performance, similar to what happened last year. How far can a bigger correction go during an Iranian confrontation?
One answer will emerge from the price of oil.
A good indicator of a bigger correction has started would be if in February the S&P 500 trades below the January low of just under 6800. A good target for a correction in an Iranian confrontation is the 200-day moving average near 6400. Those are hypothetical and likely won’t happen without Iran getting into the picture. But why would the Navy move an aircraft carrier into firing-range if no one intends to use it?
Precious Metals May Have Reached a Climactic Top
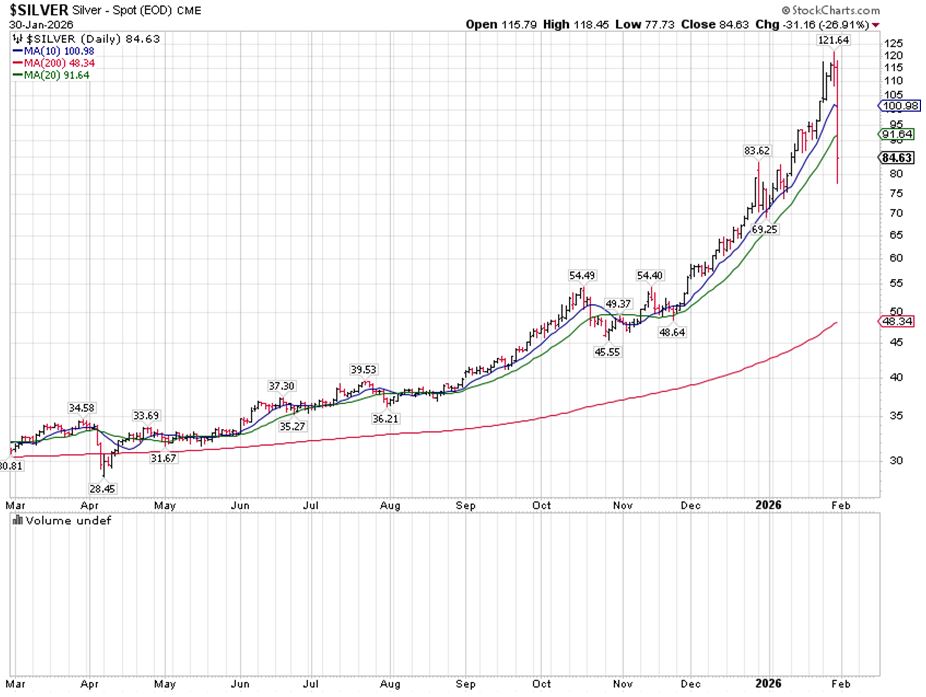
I think we hit an intermediate-term top in precious metals. We are likely to see a 3 to 6-month consolidation range with the swing quite big (low to high). Silver bullion, which typically lags gold and then goes parabolic in the latter stages of a bull move, is likely headed to $50, where it was as of last November.
Gold and silver are commodities, not operating companies. Sure, they can have shortages and explosive moves, like silver quadrupling in a year – if one was brave enough to sell silver in the $115-region, which few did – and then they tend to revert to the mean. Last week is what reversion to the mean looks like.
Graphs are for illustrative and discussion purposes only. Please read important disclosures at the end of this commentary.
Because of this huge move in two-trading days, I would expect some kind of rebound. Silver is likely to make a lower high and trend lower, below $77.73. This is not a long-term bearish forecast but a realistic view of what intermediate-term corrections-consolidation periods in precious metals look like.
Of the four major precious metals – gold, silver platinum and palladium – only gold is truly precious. The others are primarily industrial, with their precious metal role a secondary consideration. Silver is smallest by value and, as such, is prone to dramatic moves in either direction as it is easier to move, which makes it the proverbial double-edged sword for the bulls. Right now, they are experiencing the bearish edge.
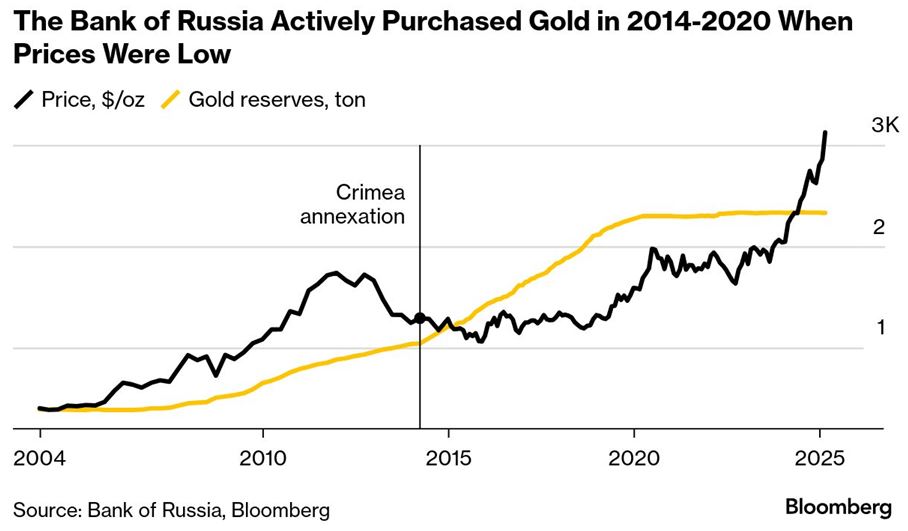
In a perverse way, the Ukraine war lit a fire under the gold price as sanctions immobilized a huge chunk of Russian central bank assets. Other central banks seeing the move clearly concluded holding gold bullion was “safer” and followed the Bank of Russia putting a floor under the price of gold bullion.
Both platinum and palladium have also shown bull markets but no parabolic moves. I think the crux of any bearish activity will be concentrated on the silver market simply because it quadrupled in a year. A simple mean reversion to the rising 200-day moving average means silver retreating to $50.
The 200-day moving average on gold bullion is at 3,775 and rising, so the downside in gold-bullion will not be as large as it will be with silver, as gold is a much larger and more liquid market.
In a perverse way, the Ukraine war lit a fire under the gold price as sanctions immobilized a huge chunk of Russian central bank assets. Other central banks seeing the move clearly concluded holding gold bullion was “safer” and followed the Bank of Russia putting a floor under the price of gold bullion.
Graphs are for illustrative and discussion purposes only. Please read important disclosures at the end of this commentary.
The most recent long-term chart I can find shows gold as of early 2025 crossing over $3,000. Last week’s climactic high was a tad over $5,600. Clearly the Russians decided to play their cards close to the vest and doubled their reserves while gold prices were still in the mid $1,000s.
This has to be one of the more brilliant central bank trades so far this century.
Because gold has global central bank support, I do not believe gold bullion will decline below $4,000 on this correction, which is normal if you study corrections in gold bullion over the years.
Silver, though, is another matter. There simply isn’t any central bank support there.
All content above represents the opinion of Ivan Martchev of Navellier & Associates, Inc.
Also In This Issue
A Look Ahead by Louis Navellier
Is Inflation Returning – or is Deflation a Greater Threat?
Income Mail by Bryan Perry
Kevin Hassett’s Base Case for an Economic Supply Shock
Growth Mail by Gary Alexander
What’s Behind the Surge (then Collapse) in Gold and Silver?
Global Mail by Ivan Martchev
The Stock Market is Worried about Iran
Sector Spotlight by Jason Bodner
What A Stock Market Rotation Looks Like
View Full Archive
Read Past Issues Here

Ivan Martchev
INVESTMENT STRATEGIST
Ivan Martchev is an investment strategist with Navellier. Previously, Ivan served as editorial director at InvestorPlace Media. Ivan was editor of Louis Rukeyser’s Mutual Funds and associate editor of Personal Finance. Ivan is also co-author of The Silk Road to Riches (Financial Times Press). The book provided analysis of geopolitical issues and investment strategy in natural resources and emerging markets with an emphasis on Asia. The book also correctly predicted the collapse in the U.S. real estate market, the rise of precious metals, and the resulting increased investor interest in emerging markets. Ivan’s commentaries have been published by MSNBC, The Motley Fool, MarketWatch, and others. All content of “Global Mail” represents the opinion of Ivan Martchev
Important Disclosures:
Although information in these reports has been obtained from and is based upon sources that Navellier believes to be reliable, Navellier does not guarantee its accuracy and it may be incomplete or condensed. All opinions and estimates constitute Navellier’s judgment as of the date the report was created and are subject to change without notice. These reports are for informational purposes only and are not a solicitation for the purchase or sale of a security. Any decision to purchase securities mentioned in these reports must take into account existing public information on such securities or any registered prospectus.To the extent permitted by law, neither Navellier & Associates, Inc., nor any of its affiliates, agents, or service providers assumes any liability or responsibility nor owes any duty of care for any consequences of any person acting or refraining to act in reliance on the information contained in this communication or for any decision based on it.
Past performance is no indication of future results. Investment in securities involves significant risk and has the potential for partial or complete loss of funds invested. It should not be assumed that any securities recommendations made by Navellier. in the future will be profitable or equal the performance of securities made in this report. Dividend payments are not guaranteed. The amount of a dividend payment, if any, can vary over time and issuers may reduce dividends paid on securities in the event of a recession or adverse event affecting a specific industry or issuer.
None of the stock information, data, and company information presented herein constitutes a recommendation by Navellier or a solicitation to buy or sell any securities. Any specific securities identified and described do not represent all of the securities purchased, sold, or recommended for advisory clients. The holdings identified do not represent all of the securities purchased, sold, or recommended for advisory clients and the reader should not assume that investments in the securities identified and discussed were or will be profitable.
Information presented is general information that does not take into account your individual circumstances, financial situation, or needs, nor does it present a personalized recommendation to you. Individual stocks presented may not be suitable for every investor. Investment in securities involves significant risk and has the potential for partial or complete loss of funds invested. Investment in fixed income securities has the potential for the investment return and principal value of an investment to fluctuate so that an investor’s holdings, when redeemed, may be worth less than their original cost.
One cannot invest directly in an index. Index is unmanaged and index performance does not reflect deduction of fees, expenses, or taxes. Presentation of Index data does not reflect a belief by Navellier that any stock index constitutes an investment alternative to any Navellier equity strategy or is necessarily comparable to such strategies. Among the most important differences between the Indices and Navellier strategies are that the Navellier equity strategies may (1) incur material management fees, (2) concentrate its investments in relatively few stocks, industries, or sectors, (3) have significantly greater trading activity and related costs, and (4) be significantly more or less volatile than the Indices.
ETF Risk: We may invest in exchange traded funds (“ETFs”) and some of our investment strategies are generally fully invested in ETFs. Like traditional mutual funds, ETFs charge asset-based fees, but they generally do not charge initial sales charges or redemption fees and investors typically pay only customary brokerage fees to buy and sell ETF shares. The fees and costs charged by ETFs held in client accounts will not be deducted from the compensation the client pays Navellier. ETF prices can fluctuate up or down, and a client account could lose money investing in an ETF if the prices of the securities owned by the ETF go down. ETFs are subject to additional risks:
- ETF shares may trade above or below their net asset value;
- An active trading market for an ETF’s shares may not develop or be maintained;
- The value of an ETF may be more volatile than the underlying portfolio of securities the ETF is designed to track;
- The cost of owning shares of the ETF may exceed those a client would incur by directly investing in the underlying securities; and
- Trading of an ETF’s shares may be halted if the listing exchange’s officials deem it appropriate, the shares are delisted from the exchange, or the activation of market-wide “circuit breakers” (which are tied to large decreases in stock prices) halts stock trading generally.
Grader Disclosures: Investment in equity strategies involves substantial risk and has the potential for partial or complete loss of funds invested. The sample portfolio and any accompanying charts are for informational purposes only and are not to be construed as a solicitation to buy or sell any financial instrument and should not be relied upon as the sole factor in an investment making decision. As a matter of normal and important disclosures to you, as a potential investor, please consider the following: The performance presented is not based on any actual securities trading, portfolio, or accounts, and the reported performance of the A, B, C, D, and F portfolios (collectively the “model portfolios”) should be considered mere “paper” or pro forma performance results based on Navellier’s research.
Investors evaluating any of Navellier & Associates, Inc.’s, (or its affiliates’) Investment Products must not use any information presented here, including the performance figures of the model portfolios, in their evaluation of any Navellier Investment Products. Navellier Investment Products include the firm’s mutual funds and managed accounts. The model portfolios, charts, and other information presented do not represent actual funded trades and are not actual funded portfolios. There are material differences between Navellier Investment Products’ portfolios and the model portfolios, research, and performance figures presented here. The model portfolios and the research results (1) may contain stocks or ETFs that are illiquid and difficult to trade; (2) may contain stock or ETF holdings materially different from actual funded Navellier Investment Product portfolios; (3) include the reinvestment of all dividends and other earnings, estimated trading costs, commissions, or management fees; and, (4) may not reflect prices obtained in an actual funded Navellier Investment Product portfolio. For these and other reasons, the reported performances of model portfolios do not reflect the performance results of Navellier’s actually funded and traded Investment Products. In most cases, Navellier’s Investment Products have materially lower performance results than the performances of the model portfolios presented.
This report contains statements that are, or may be considered to be, forward-looking statements. All statements that are not historical facts, including statements about our beliefs or expectations, are “forward-looking statements” within the meaning of The U.S. Private Securities Litigation Reform Act of 1995. These statements may be identified by such forward-looking terminology as “expect,” “estimate,” “plan,” “intend,” “believe,” “anticipate,” “may,” “will,” “should,” “could,” “continue,” “project,” or similar statements or variations of such terms. Our forward-looking statements are based on a series of expectations, assumptions, and projections, are not guarantees of future results or performance, and involve substantial risks and uncertainty as described in Form ADV Part 2A of our filing with the Securities and Exchange Commission (SEC), which is available at www.adviserinfo.sec.gov or by requesting a copy by emailing info@navellier.com. All of our forward-looking statements are as of the date of this report only. We can give no assurance that such expectations or forward-looking statements will prove to be correct. Actual results may differ materially. You are urged to carefully consider all such factors.
FEDERAL TAX ADVICE DISCLAIMER: As required by U.S. Treasury Regulations, you are informed that, to the extent this presentation includes any federal tax advice, the presentation is not written by Navellier to be used, and cannot be used, for the purpose of avoiding federal tax penalties. Navellier does not advise on any income tax requirements or issues. Use of any information presented by Navellier is for general information only and does not represent tax advice either express or implied. You are encouraged to seek professional tax advice for income tax questions and assistance.
IMPORTANT NEWSLETTER DISCLOSURE:The hypothetical performance results for investment newsletters that are authored or edited by Louis Navellier, including Louis Navellier’s Growth Investor, Louis Navellier’s Breakthrough Stocks, Louis Navellier’s Accelerated Profits, and Louis Navellier’s Platinum Club, are not based on any actual securities trading, portfolio, or accounts, and the newsletters’ reported hypothetical performances should be considered mere “paper” or proforma hypothetical performance results and are not actual performance of real world trades. Navellier & Associates, Inc. does not have any relation to or affiliation with the owner of these newsletters. There are material differences between Navellier Investment Products’ portfolios and the InvestorPlace Media, LLC newsletter portfolios authored by Louis Navellier. The InvestorPlace Media, LLC newsletters contain hypothetical performance that do not include transaction costs, advisory fees, or other fees a client might incur if actual investments and trades were being made by an investor. As a result, newsletter performance should not be used to evaluate Navellier Investment services which are separate and different from the newsletters. The owner of the newsletters is InvestorPlace Media, LLC and any questions concerning the newsletters, including any newsletter advertising or hypothetical Newsletter performance claims, (which are calculated solely by Investor Place Media and not Navellier) should be referred to InvestorPlace Media, LLC at (800) 718-8289.
Please note that Navellier & Associates and the Navellier Private Client Group are managed completely independent of the newsletters owned and published by InvestorPlace Media, LLC and written and edited by Louis Navellier, and investment performance of the newsletters should in no way be considered indicative of potential future investment performance for any Navellier & Associates separately managed account portfolio. Potential investors should consult with their financial advisor before investing in any Navellier Investment Product.
Navellier claims compliance with Global Investment Performance Standards (GIPS). To receive a complete list and descriptions of Navellier’s composites and/or a presentation that adheres to the GIPS standards, please contact Navellier or click here. It should not be assumed that any securities recommendations made by Navellier & Associates, Inc. in the future will be profitable or equal the performance of securities made in this report.
FactSet Disclosure: Navellier does not independently calculate the statistical information included in the attached report. The calculation and the information are provided by FactSet, a company not related to Navellier. Although information contained in the report has been obtained from FactSet and is based on sources Navellier believes to be reliable, Navellier does not guarantee its accuracy, and it may be incomplete or condensed. The report and the related FactSet sourced information are provided on an “as is” basis. The user assumes the entire risk of any use made of this information. Investors should consider the report as only a single factor in making their investment decision. The report is for informational purposes only and is not intended as an offer or solicitation for the purchase or sale of a security. FactSet sourced information is the exclusive property of FactSet. Without prior written permission of FactSet, this information may not be reproduced, disseminated or used to create any financial products. All indices are unmanaged and performance of the indices include reinvestment of dividends and interest income, unless otherwise noted, are not illustrative of any particular investment and an investment cannot be made in any index. Past performance is no guarantee of future results.