by Jason Bodner
January 27, 2026
Pilots flying through dense cloud covers find their vision becomes unreliable. The horizon disappears, depth perception collapses, and instinct can betray even experienced aviators. In those moments, survival depends on instruments. The gauges don’t care what the sky looks like. They simply report realities.
Markets spend a lot of time in clouds this thick. Last week delivered another head fake – centered in Greenland and Davos. After Monday’s holiday, equities sold-off sharply on Tuesday. President Trump’s comments about Greenland as a potential acquisition unsettled most markets, almost immediately. The narrative turned fast and loud. “Sell America.” Risk was rising while certainty vanished. Fear flourished.
Less than 24-hours later, however, the narrative reversed, as Trump softened his tone in talks with global leaders in Davos, dismissing any military involvement and delaying tariffs, and then floated a framework for a future deal on Greenland. Suddenly the market exhaled. The story became a call to “Buy America.”
It’s hard to keep up with these news reversals, so maybe we should quit trying to decipher the volatile changes in headlines each day. Trying to invest by reacting to news is chaotic, stressful, and deeply inefficient. Headlines jerk our emotions, whip capital around, and waste our time glued to screens.
TV addiction is fantastic for the news business, but it’s not so great for building wealth through stocks.
The problem is not information itself. It is the priority we give it. If you strip away the headlines, the stock market is not a story-telling engine. It is a marketplace. Buyers and sellers meet every day. Capital flows in and out. Over time, those movements reveal who is in control and where true conviction exists.
Capital flows are the market’s boiler room. Prices alone can mislead. Viewed through money flows, the market looks less like a highlight reel and more like an MRI. Prices reflect trends, and flows explain why.
These distinctions matter, especially during weeks like the one just past. Headlines focused on Greenland, but the data did not care about Greenland. If you overlaid headlines on the charts, the correlation would be far weaker than most people expect. Markets did not sell because of rhetoric, nor did they buy because of reassurance. They moved because capital continued doing what it had already been doing.
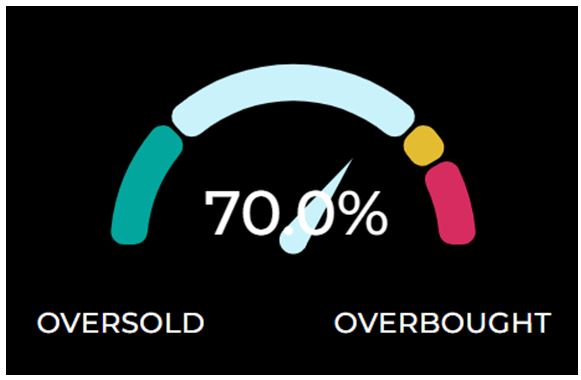
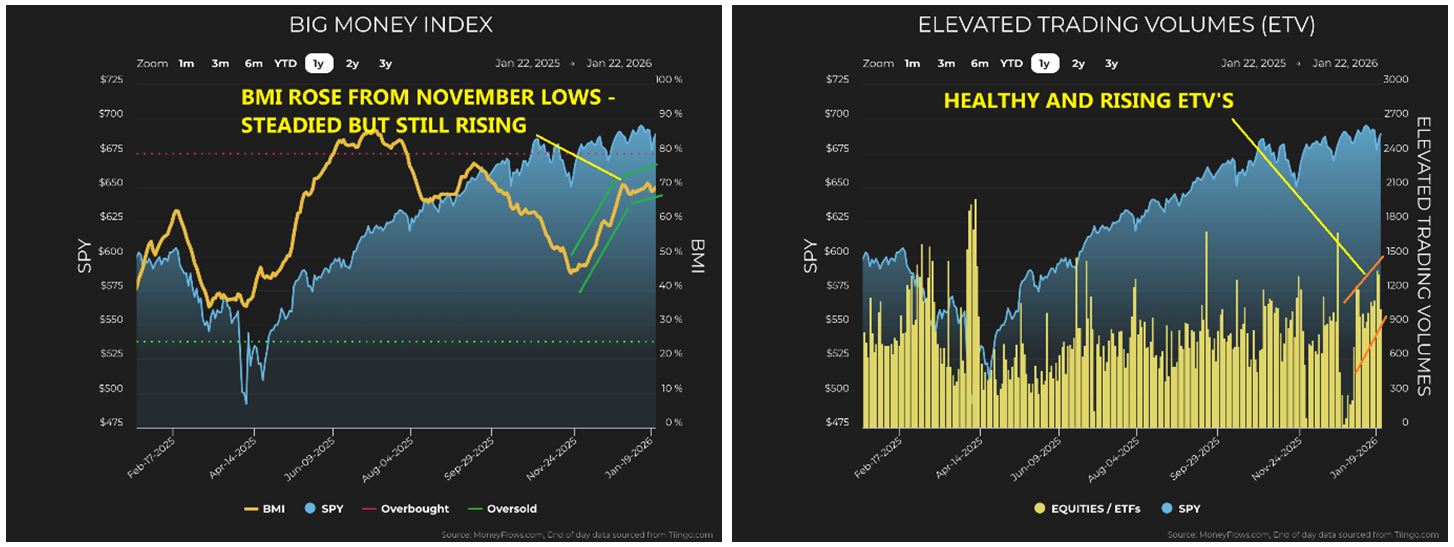
Let’s start with the Big Money Index (BMI). After deleveraging in November, markets found a footing. Once prices stabilized, inflows quietly took control. The BMI climbed steadily into year end, paused briefly and then moved back toward the 70-level. This is not a sign of fear. It is a sign of accumulation.
Graphs are for illustrative and discussion purposes only. Please read important disclosures at the end of this commentary.
This matters because the BMI is not measuring opinions. It is measuring behavior. Large institutions do not chase the headlines. They allocate capital based on mandate, probability, and opportunity. When the BMI rises, it reflects sustained buying pressure across thousands of stocks.
ETF activity reinforces this message. Volumes remain healthy and trends remain constructive. A rising market paired with a rising BMI and solid participation is historically a supportive back-drop for equities. This combination does not align with panic or instability. It aligns with confidence.
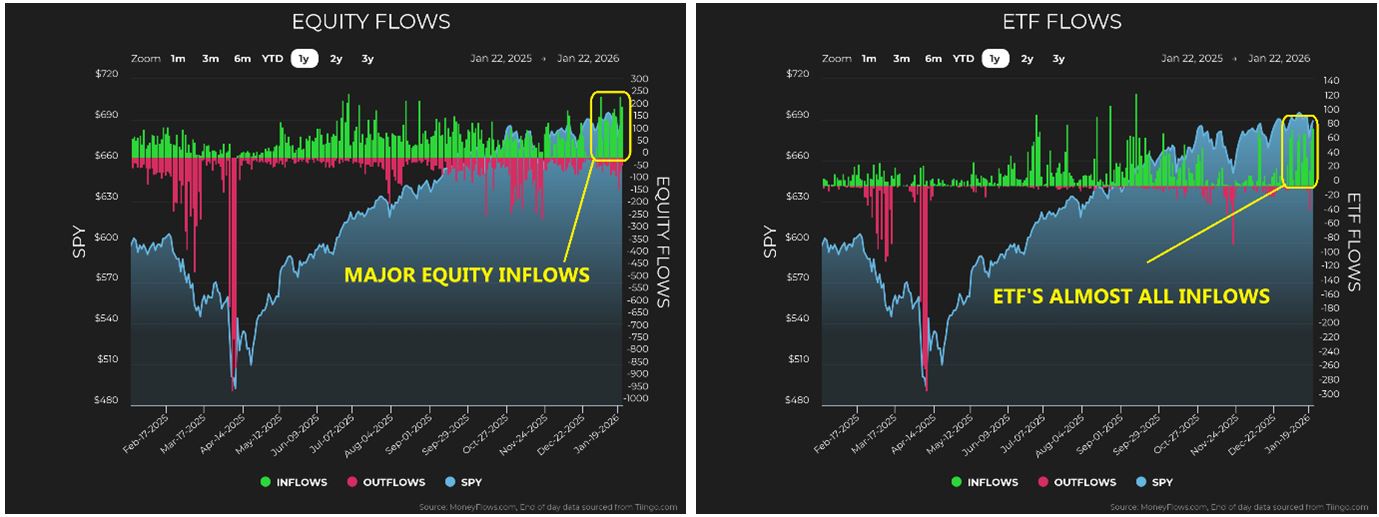
Zooming out to equity and ETF flows makes the picture even clearer. Inflows are decisively outpacing outflows. During the shortened, headline heavy week of January 20 through January 23, inflows exceeded outflows by roughly two to one. This is not what fear looks like. It is what commitment looks like.
Graphs are for illustrative and discussion purposes only. Please read important disclosures at the end of this commentary.
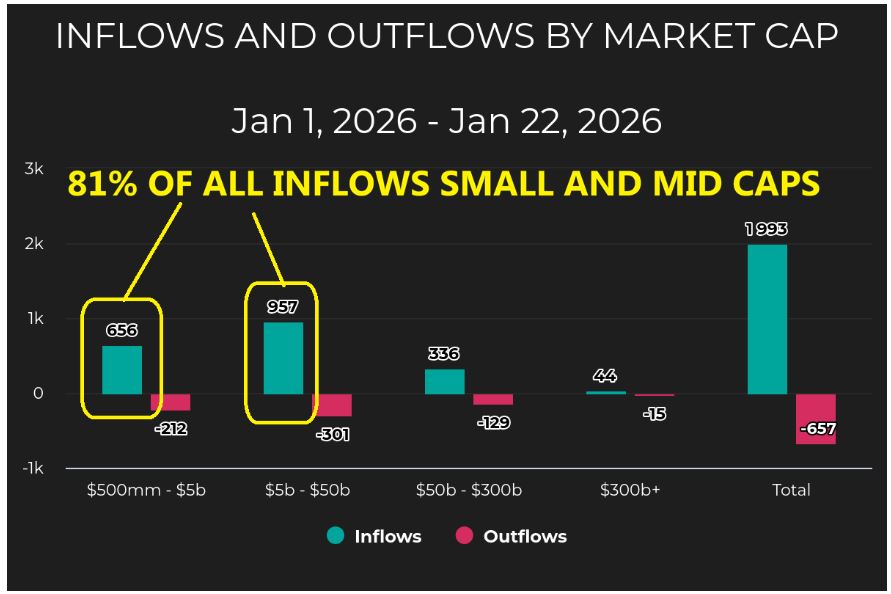
Breaking flows down by market capitalization (stock valuation) adds another important layer. Since January 1, inflows outweigh outflows by nearly three-to-one, with a noticeable tilt toward small-cap and mid-sized companies. This kind of rotation does not happen in fragile markets. It happens when investors are willing to look beyond crowded leadership and search for new opportunity.
Graphs are for illustrative and discussion purposes only. Please read important disclosures at the end of this commentary.
This is a familiar pattern. Early year strength often shows up first outside of mega-cap leadership. It reflects risk tolerance, not risk aversion. Once again, headlines suggest turbulence. Capital suggests calm.
Sector leadership requires context in January. Part of my process includes a year-to-date performance list, which resets every January 1. Sector rankings can shift quickly early in the year. Some view this fact as a flaw. Others see the benefit. It removes the ability to hide and surfaces leadership immediately.
![]()
Graphs are for illustrative and discussion purposes only. Please read important disclosures at the end of this commentary.
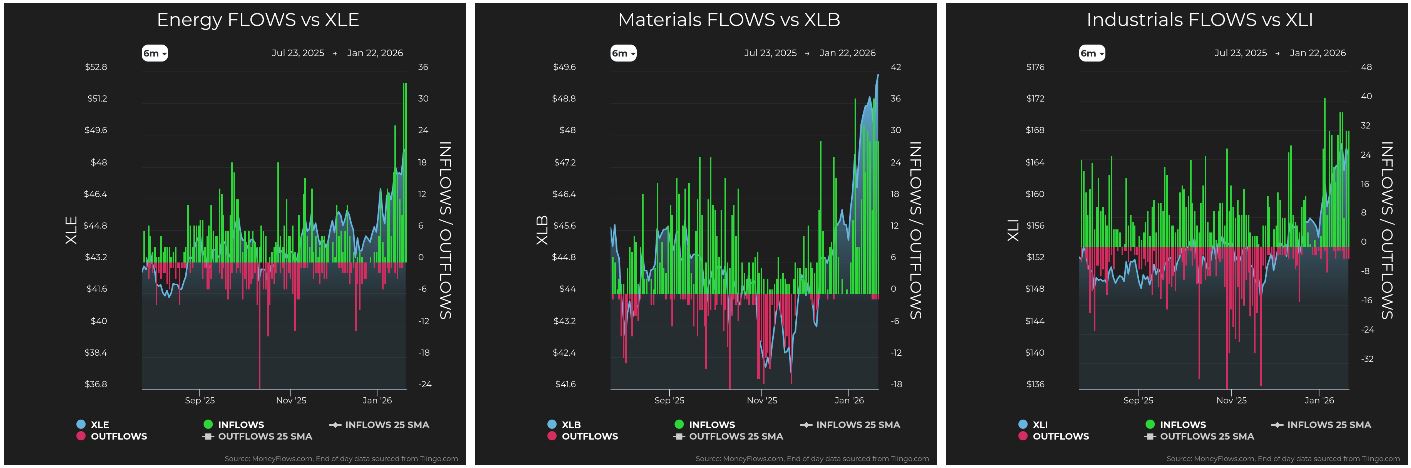
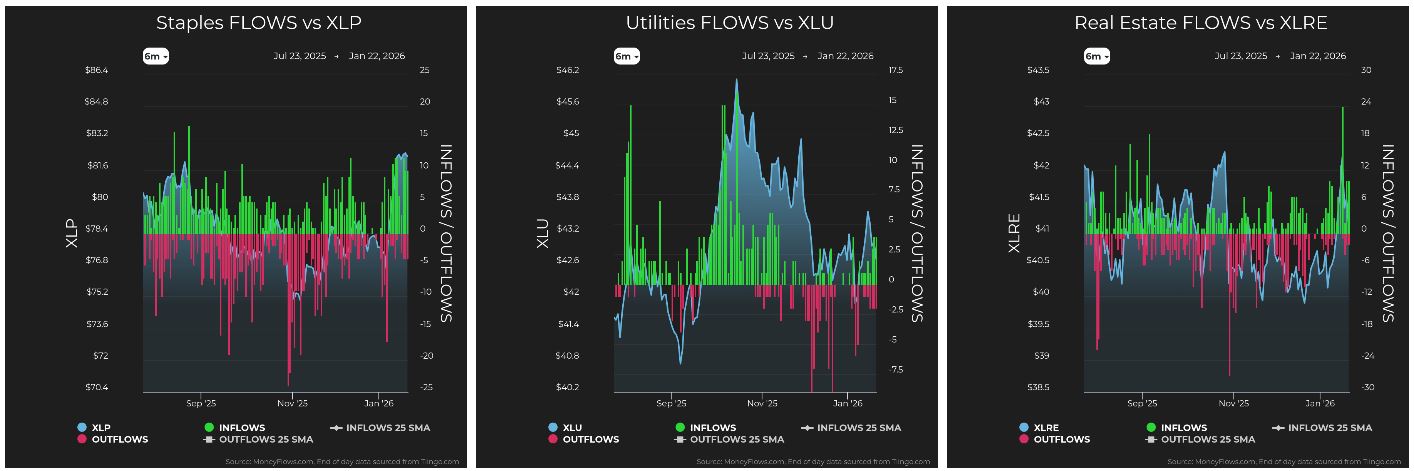
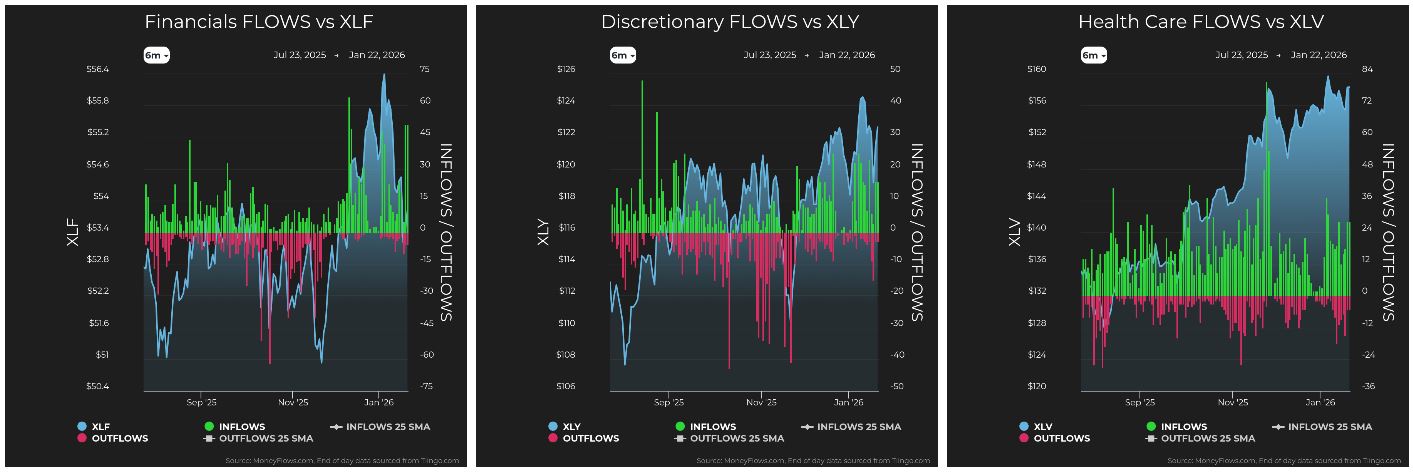
So far in 2026, Energy, Materials, and Industrials have taken the lead, which is interesting. What matters more is the breadth underneath. Inflows are not isolated. Energy, Materials, Industrials, Staples, Real Estate, Financials, Discretionary, and Health Care have all attracted meaningful capital.
Graphs are for illustrative and discussion purposes only. Please read important disclosures at the end of this commentary.
Broad participation is the hallmark of durable markets. Strong advances are not built on one stock, one-sector or one-story. They are built when capital spreads out and finds opportunity across many sectors.
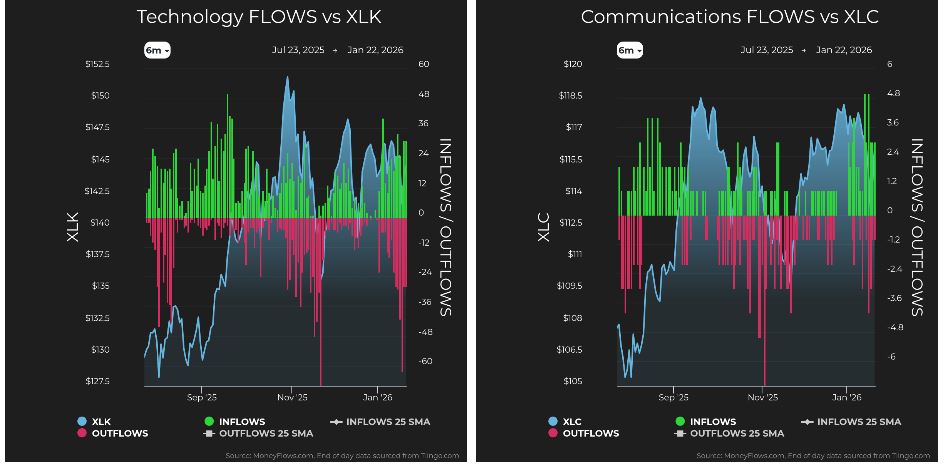
Technology adds a wrinkle. While parts of technology have performed well, the sector as a whole has been choppy since October. Mega-cap leadership lost momentum, which feels uncomfortable, especially for portfolios heavily weighted in large-cap and mega-cap technology. But discomfort is often where rotation begins.
Market money doesn’t disappear… It just moves from one sector to another. When leadership narrows, capital often looks elsewhere. Small and mid-sized companies benefit. Breadth improves.
These are not necessarily signs of weakness – just signs of transition – and this is why I return to the same framework here, again and again. The daily news is for entertainment, but data is for investing. Anchoring decisions to flows instead of feelings, make markets less emotional and far more navigable.
Flying through clouds without instruments is dangerous. Investing through headlines is no different.
As Chester I. Barnard said, “Where you stand determines what you see.”
All content above represents the opinion of Jason Bodner of Navellier & Associates, Inc.
Also In This Issue
A Look Ahead by Louis Navellier
President Trump Takes on Davos…and the World
Income Mail by Bryan Perry
An Opportunity to Own SpaceX Pre-IPO
Growth Mail by Gary Alexander
Black Swans May Shock Us, But the Market Ignores Them
Global Mail by Ivan Martchev
Unintended Consequences (and Fed Chair Announcement) Alert
Sector Spotlight by Jason Bodner
How to See Clearly While Flying Through Dense Market Fog
View Full Archive
Read Past Issues Here

Jason Bodner
MARKETMAIL EDITOR FOR SECTOR SPOTLIGHT
Jason Bodner writes Sector Spotlight in the weekly Marketmail publication and has authored several white papers for the company. He is also Co-Founder of Macro Analytics for Professionals which produces proprietary equity accumulation and distribution research for its clients. Previously, Mr. Bodner served as Director of European Equity Derivatives for Cantor Fitzgerald Europe in London, then moved to the role of Head of Equity Derivatives North America for the same company in New York. He also served as S.V.P. Equity Derivatives for Jefferies, LLC. He received a B.S. in business administration in 1996, with honors, from Skidmore College as a member of the Periclean Honors Society. All content of “Sector Spotlight” represents the opinion of Jason Bodner
Important Disclosures:
Jason Bodner is a co-founder and co-owner of Mapsignals. Mr. Bodner is an independent contractor who is occasionally hired by Navellier & Associates to write an article and or provide opinions for possible use in articles that appear in Navellier & Associates weekly Market Mail. Mr. Bodner is not employed or affiliated with Louis Navellier, Navellier & Associates, Inc., or any other Navellier owned entity. The opinions and statements made here are those of Mr. Bodner and not necessarily those of any other persons or entities. This is not an endorsement, or solicitation or testimonial or investment advice regarding the BMI Index or any statements or recommendations or analysis in the article or the BMI Index or Mapsignals or its products or strategies.
Although information in these reports has been obtained from and is based upon sources that Navellier believes to be reliable, Navellier does not guarantee its accuracy and it may be incomplete or condensed. All opinions and estimates constitute Navellier’s judgment as of the date the report was created and are subject to change without notice. These reports are for informational purposes only and are not a solicitation for the purchase or sale of a security. Any decision to purchase securities mentioned in these reports must take into account existing public information on such securities or any registered prospectus.To the extent permitted by law, neither Navellier & Associates, Inc., nor any of its affiliates, agents, or service providers assumes any liability or responsibility nor owes any duty of care for any consequences of any person acting or refraining to act in reliance on the information contained in this communication or for any decision based on it.
Past performance is no indication of future results. Investment in securities involves significant risk and has the potential for partial or complete loss of funds invested. It should not be assumed that any securities recommendations made by Navellier. in the future will be profitable or equal the performance of securities made in this report. Dividend payments are not guaranteed. The amount of a dividend payment, if any, can vary over time and issuers may reduce dividends paid on securities in the event of a recession or adverse event affecting a specific industry or issuer.
None of the stock information, data, and company information presented herein constitutes a recommendation by Navellier or a solicitation to buy or sell any securities. Any specific securities identified and described do not represent all of the securities purchased, sold, or recommended for advisory clients. The holdings identified do not represent all of the securities purchased, sold, or recommended for advisory clients and the reader should not assume that investments in the securities identified and discussed were or will be profitable.
Information presented is general information that does not take into account your individual circumstances, financial situation, or needs, nor does it present a personalized recommendation to you. Individual stocks presented may not be suitable for every investor. Investment in securities involves significant risk and has the potential for partial or complete loss of funds invested. Investment in fixed income securities has the potential for the investment return and principal value of an investment to fluctuate so that an investor’s holdings, when redeemed, may be worth less than their original cost.
One cannot invest directly in an index. Index is unmanaged and index performance does not reflect deduction of fees, expenses, or taxes. Presentation of Index data does not reflect a belief by Navellier that any stock index constitutes an investment alternative to any Navellier equity strategy or is necessarily comparable to such strategies. Among the most important differences between the Indices and Navellier strategies are that the Navellier equity strategies may (1) incur material management fees, (2) concentrate its investments in relatively few stocks, industries, or sectors, (3) have significantly greater trading activity and related costs, and (4) be significantly more or less volatile than the Indices.
ETF Risk: We may invest in exchange traded funds (“ETFs”) and some of our investment strategies are generally fully invested in ETFs. Like traditional mutual funds, ETFs charge asset-based fees, but they generally do not charge initial sales charges or redemption fees and investors typically pay only customary brokerage fees to buy and sell ETF shares. The fees and costs charged by ETFs held in client accounts will not be deducted from the compensation the client pays Navellier. ETF prices can fluctuate up or down, and a client account could lose money investing in an ETF if the prices of the securities owned by the ETF go down. ETFs are subject to additional risks:
- ETF shares may trade above or below their net asset value;
- An active trading market for an ETF’s shares may not develop or be maintained;
- The value of an ETF may be more volatile than the underlying portfolio of securities the ETF is designed to track;
- The cost of owning shares of the ETF may exceed those a client would incur by directly investing in the underlying securities and;
- Trading of an ETF’s shares may be halted if the listing exchange’s officials deem it appropriate, the shares are delisted from the exchange, or the activation of market-wide “circuit breakers” (which are tied to large decreases in stock prices) halts stock trading generally.
Grader Disclosures: Investment in equity strategies involves substantial risk and has the potential for partial or complete loss of funds invested. The sample portfolio and any accompanying charts are for informational purposes only and are not to be construed as a solicitation to buy or sell any financial instrument and should not be relied upon as the sole factor in an investment making decision. As a matter of normal and important disclosures to you, as a potential investor, please consider the following: The performance presented is not based on any actual securities trading, portfolio, or accounts, and the reported performance of the A, B, C, D, and F portfolios (collectively the “model portfolios”) should be considered mere “paper” or pro forma performance results based on Navellier’s research.
Investors evaluating any of Navellier & Associates, Inc.’s, (or its affiliates’) Investment Products must not use any information presented here, including the performance figures of the model portfolios, in their evaluation of any Navellier Investment Products. Navellier Investment Products include the firm’s mutual funds and managed accounts. The model portfolios, charts, and other information presented do not represent actual funded trades and are not actual funded portfolios. There are material differences between Navellier Investment Products’ portfolios and the model portfolios, research, and performance figures presented here. The model portfolios and the research results (1) may contain stocks or ETFs that are illiquid and difficult to trade; (2) may contain stock or ETF holdings materially different from actual funded Navellier Investment Product portfolios; (3) include the reinvestment of all dividends and other earnings, estimated trading costs, commissions, or management fees; and, (4) may not reflect prices obtained in an actual funded Navellier Investment Product portfolio. For these and other reasons, the reported performances of model portfolios do not reflect the performance results of Navellier’s actually funded and traded Investment Products. In most cases, Navellier’s Investment Products have materially lower performance results than the performances of the model portfolios presented.
This report contains statements that are, or may be considered to be, forward-looking statements. All statements that are not historical facts, including statements about our beliefs or expectations, are “forward-looking statements” within the meaning of The U.S. Private Securities Litigation Reform Act of 1995. These statements may be identified by such forward-looking terminology as “expect,” “estimate,” “plan,” “intend,” “believe,” “anticipate,” “may,” “will,” “should,” “could,” “continue,” “project,” or similar statements or variations of such terms. Our forward-looking statements are based on a series of expectations, assumptions, and projections, are not guarantees of future results or performance, and involve substantial risks and uncertainty as described in Form ADV Part 2A of our filing with the Securities and Exchange Commission (SEC), which is available at www.adviserinfo.sec.gov or by requesting a copy by emailing info@navellier.com. All of our forward-looking statements are as of the date of this report only. We can give no assurance that such expectations or forward-looking statements will prove to be correct. Actual results may differ materially. You are urged to carefully consider all such factors.
FEDERAL TAX ADVICE DISCLAIMER: As required by U.S. Treasury Regulations, you are informed that, to the extent this presentation includes any federal tax advice, the presentation is not written by Navellier to be used, and cannot be used, for the purpose of avoiding federal tax penalties. Navellier does not advise on any income tax requirements or issues. Use of any information presented by Navellier is for general information only and does not represent tax advice either express or implied. You are encouraged to seek professional tax advice for income tax questions and assistance.
IMPORTANT NEWSLETTER DISCLOSURE:The hypothetical performance results for investment newsletters that are authored or edited by Louis Navellier, including Louis Navellier’s Growth Investor, Louis Navellier’s Breakthrough Stocks, Louis Navellier’s Accelerated Profits, and Louis Navellier’s Platinum Club, are not based on any actual securities trading, portfolio, or accounts, and the newsletters’ reported hypothetical performances should be considered mere “paper” or proforma hypothetical performance results and are not actual performance of real world trades. Navellier & Associates, Inc. does not have any relation to or affiliation with the owner of these newsletters. There are material differences between Navellier Investment Products’ portfolios and the InvestorPlace Media, LLC newsletter portfolios authored by Louis Navellier. The InvestorPlace Media, LLC newsletters contain hypothetical performance that do not include transaction costs, advisory fees, or other fees a client might incur if actual investments and trades were being made by an investor. As a result, newsletter performance should not be used to evaluate Navellier Investment services which are separate and different from the newsletters. The owner of the newsletters is InvestorPlace Media, LLC and any questions concerning the newsletters, including any newsletter advertising or hypothetical Newsletter performance claims, (which are calculated solely by Investor Place Media and not Navellier) should be referred to InvestorPlace Media, LLC at (800) 718-8289.
Please note that Navellier & Associates and the Navellier Private Client Group are managed completely independent of the newsletters owned and published by InvestorPlace Media, LLC and written and edited by Louis Navellier, and investment performance of the newsletters should in no way be considered indicative of potential future investment performance for any Navellier & Associates separately managed account portfolio. Potential investors should consult with their financial advisor before investing in any Navellier Investment Product.
Navellier claims compliance with Global Investment Performance Standards (GIPS). To receive a complete list and descriptions of Navellier’s composites and/or a presentation that adheres to the GIPS standards, please contact Navellier or click here. It should not be assumed that any securities recommendations made by Navellier & Associates, Inc. in the future will be profitable or equal the performance of securities made in this report.
FactSet Disclosure: Navellier does not independently calculate the statistical information included in the attached report. The calculation and the information are provided by FactSet, a company not related to Navellier. Although information contained in the report has been obtained from FactSet and is based on sources Navellier believes to be reliable, Navellier does not guarantee its accuracy, and it may be incomplete or condensed. The report and the related FactSet sourced information are provided on an “as is” basis. The user assumes the entire risk of any use made of this information. Investors should consider the report as only a single factor in making their investment decision. The report is for informational purposes only and is not intended as an offer or solicitation for the purchase or sale of a security. FactSet sourced information is the exclusive property of FactSet. Without prior written permission of FactSet, this information may not be reproduced, disseminated or used to create any financial products. All indices are unmanaged and performance of the indices include reinvestment of dividends and interest income, unless otherwise noted, are not illustrative of any particular investment and an investment cannot be made in any index. Past performance is no guarantee of future results.