by Jason Bodner
January 21, 2026
When you compress a spring, the energy doesn’t vanish. It is stored as potential energy. Then, when you release the spring, its stored energy is transformed into motion. To the untrained eye, nothing seems to happen while the spring is held down, but the energy is all there, waiting to explode when released.
We are now in the second half of January, and the stock market is strong. We have seen a major equity rally to start 2026, but beneath the surface, heavy rotation is underway. Today, I’ll dig into rotation by following capital from the top down, revealing where money is leaving and where it is concentrating.
With the naked eye, this movement is hard to spot, but viewed through money flows, the market looks different, more like an MRI than a price chart. Prices alone show strength, but money flows explain why.
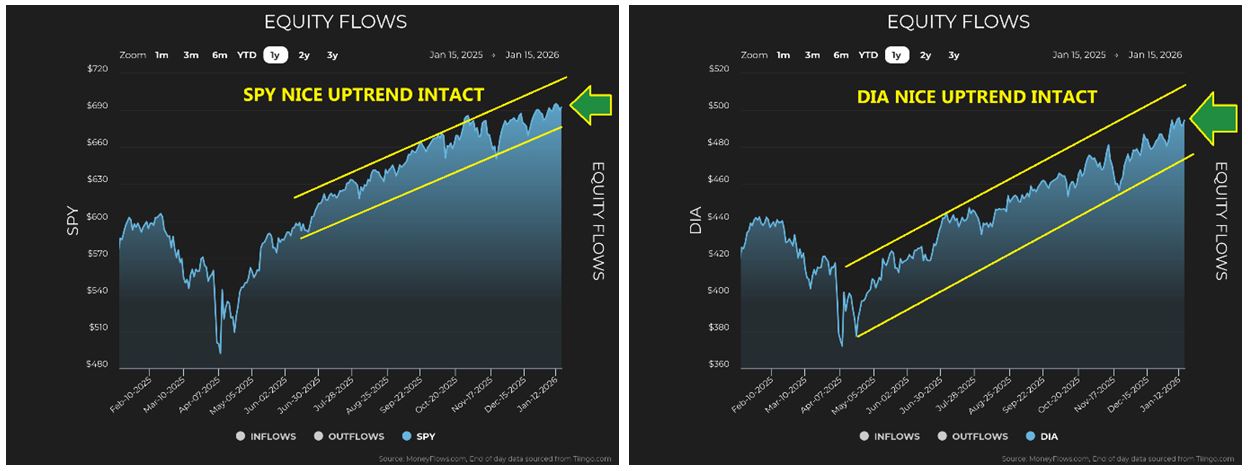
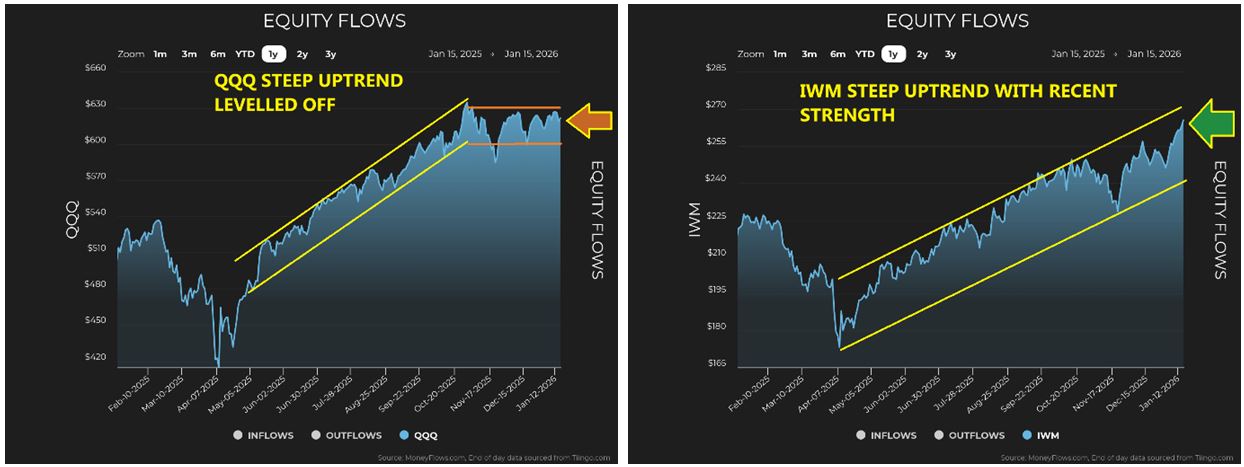
The first two-weeks of 2026 were positive for stocks. SPY and DJIA confirm the rally, but comparing the NASDAQ to small-caps tells a different story. Small-caps have clearly taken the lead, signaling capital is rotating away from crowded leadership and toward new opportunities early in the new-year.
Graphs are for illustrative and discussion purposes only. Please read important disclosures at the end of this commentary.
With semiconductors flying high last week, it may not feel this way, but technology as a whole has stalled since October. Naturally, many of us with big positions in technology feel the pain in our portfolios. The oomph just isn’t there. This can be seen in the disappointing performance of mega-cap technology stocks from their highs.
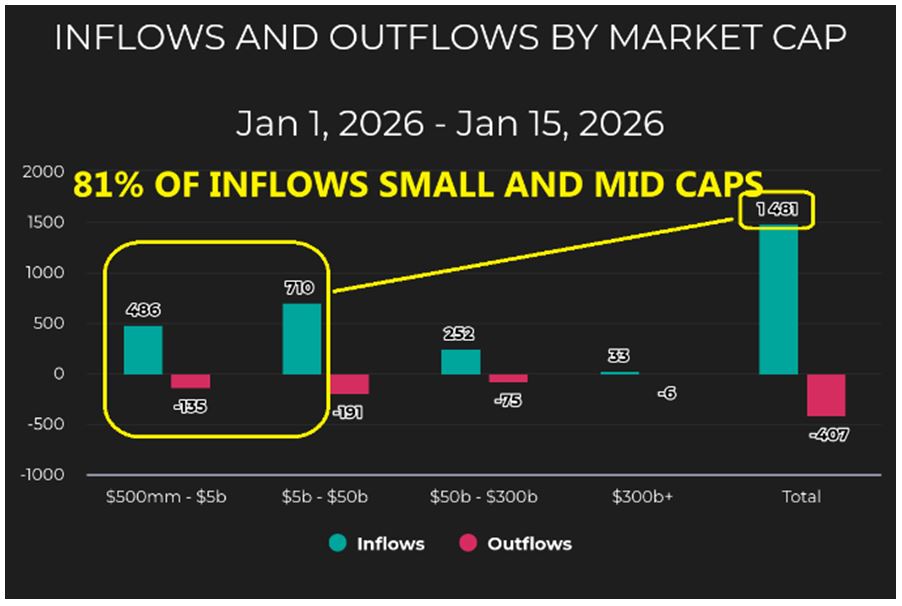
Anyone holding small-cap and mid-caps know where the money has been going, as 81% of all inflows since January 1st were concentrated in companies worth $50-billion and below – the small-cap to mid-cap universe.
Graphs are for illustrative and discussion purposes only. Please read important disclosures at the end of this commentary.
In the words of a friend: “This kind of market makes everyone look good.” And he’s right, with the few exceptions he noted. A rising tide doesn’t always lift all boats. We know mega-cap technology is suffering and we know small-caps are benefiting. Now let’s look again at the flow of capital from the top-down.
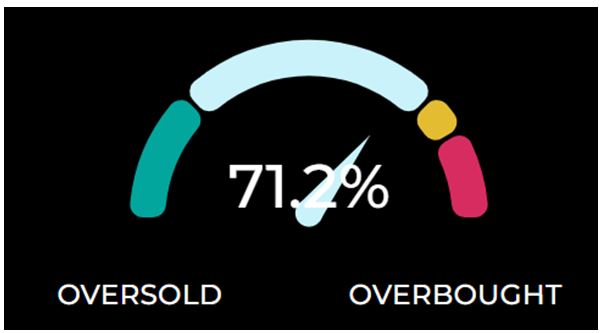
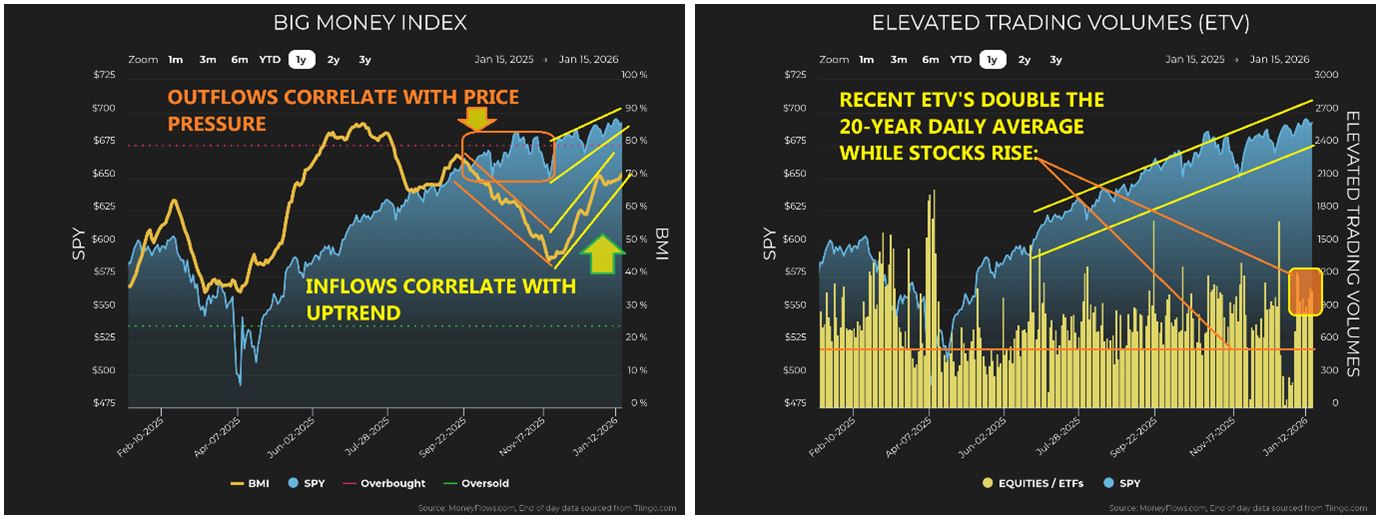
The Big Money Index (BMI) is a great gauge for overall capital flow in the stock market, and it has been steadily rising and currently sits at 71.2%:
Note how the SPY has been rising after a period of choppiness from September through November. In addition, unusually large trade volumes (ETVs) have risen to above average levels, coinciding with an uptrend in SPY. Since January 2005, the average daily ETV count is 511, meaning 511 unusually large trades are seen, on average, per day out of over 5,000-stocks, or about 10%. The average since January 1, 2026 is 1016, nearly double. This coincides with an uptrend and strength in small-cap and mid-cap stocks:
Graphs are for illustrative and discussion purposes only. Please read important disclosures at the end of this commentary.
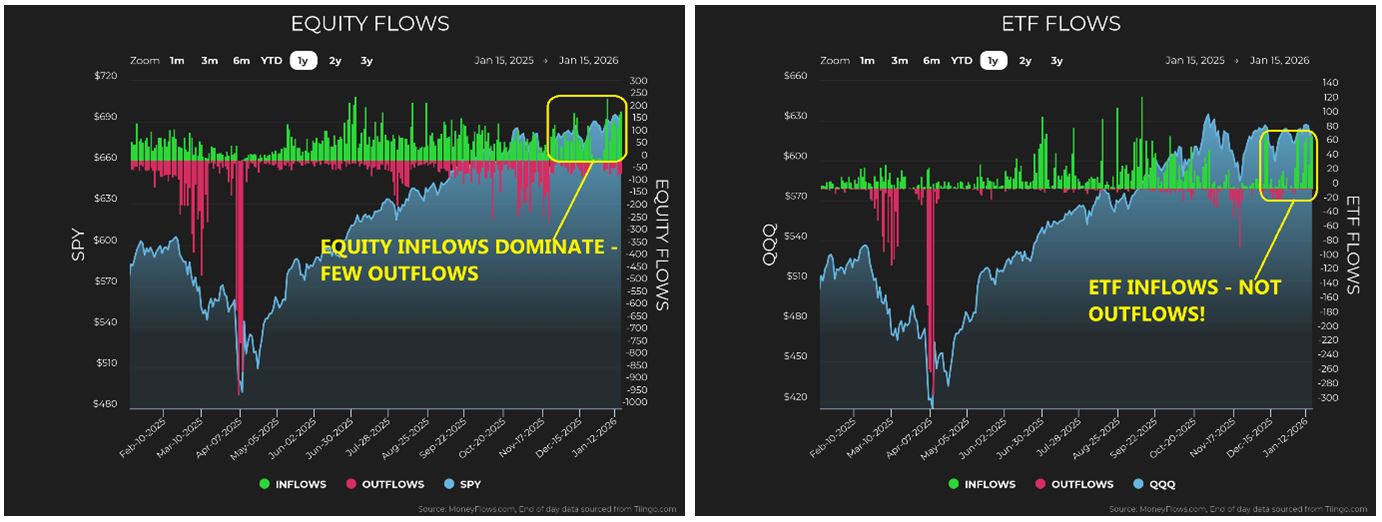
Now let’s look at daily flows. Since November, inflows have dominated and intensified since New Year’s Eve. The same can be observed in ETFs. We are seeing no big outflows and a hefty spike of inflows:
Graphs are for illustrative and discussion purposes only. Please read important disclosures at the end of this commentary.
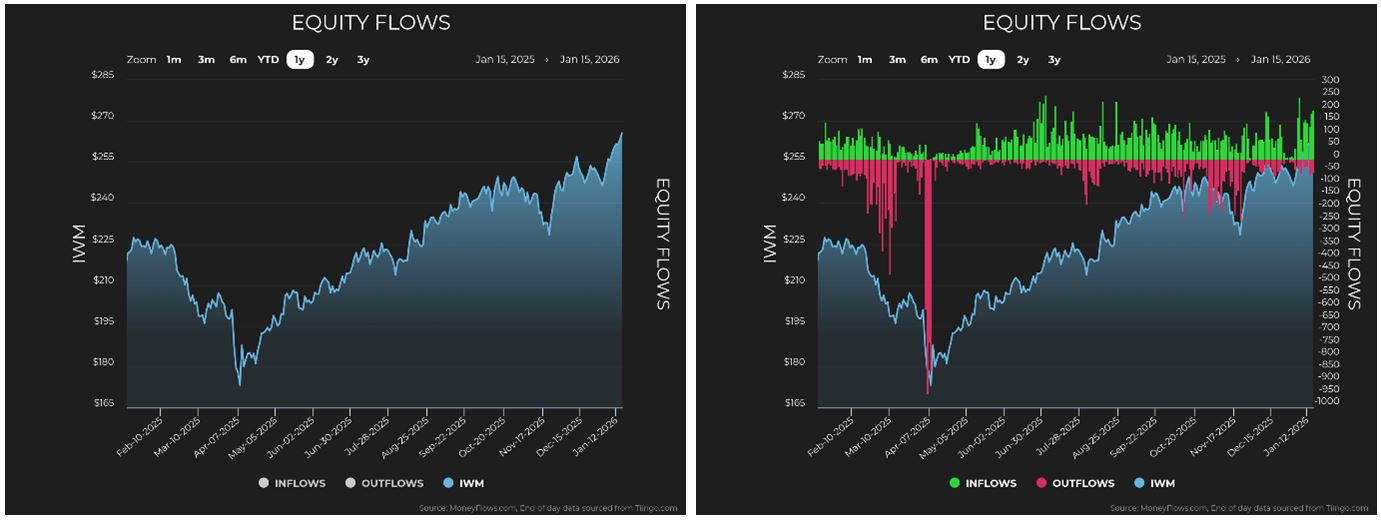
Now let’s look again at a chart of IWM, the Russell 2000 ETF. It is composed of companies worth $50-billion and below. Again, the price chart just shows some juice for the ETF. But when we overlay inflows and outflows, we can see a perfect fit – a very tight correlation between flows and price:
Graphs are for illustrative and discussion purposes only. Please read important disclosures at the end of this commentary.
When there was fear and deleveraging last April and November, outflows drove IWM lower. But during calm seas, inflows drove prices higher… More so than the large-cap heavy SPY and technology-heavy QQQ.
Now, let’s check out the sectors. I should take a moment to tell you about a benefit (or flaw, depending on your view) of my process. To rank sectors and score stocks, there is a component measuring year-to-date performance. This means sector leadership on December 31st may look extremely different from January 15th. (Perhaps it should be rolling 1-year.) But the benefits are, there is no hiding it: we can see the weakest sectors right away and, unfortunately for technology, the sector is now near the bottom of the barrel:
![]()
Graphs are for illustrative and discussion purposes only. Please read important disclosures at the end of this commentary.
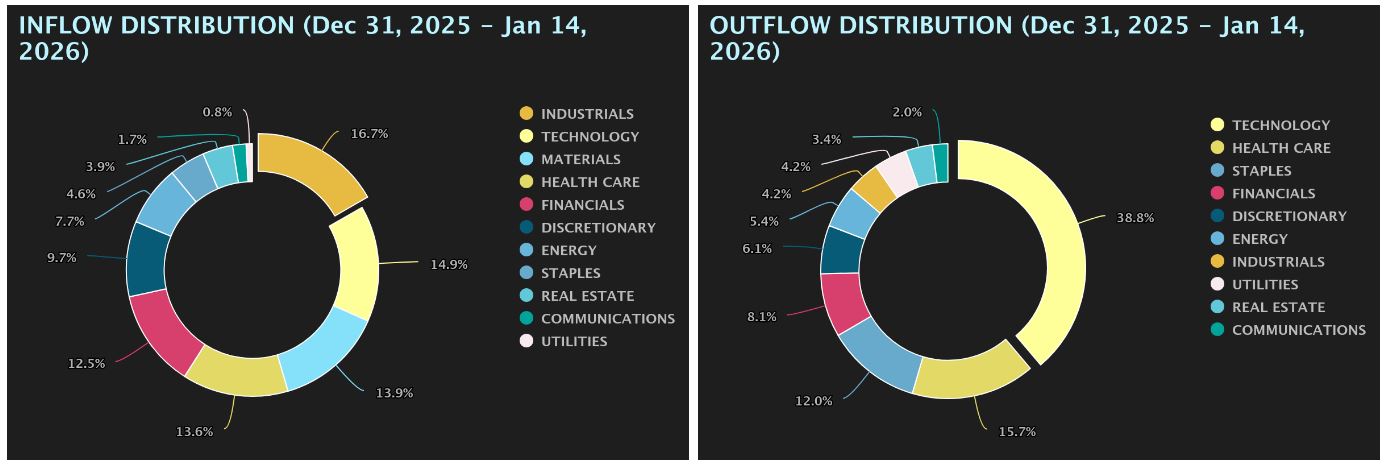
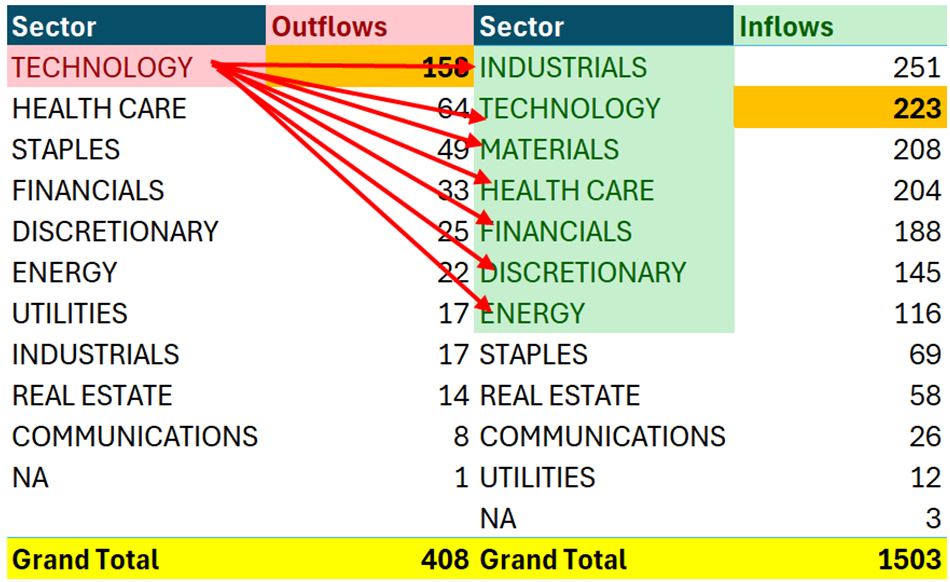
The picture becomes clearer still when looking at how the flows distributed themselves since January 1st. Money flowed into Industrials, Technology, Materials, Health, Financials, and Discretionary stocks account for 81% of inflows in those five-sectors alone. One might think this is good for technology. But when you look at outflows, we can see nearly 40% of all outflows have been in technology stocks. Put another way, the outflows have been low, so far in 2026, but what has been there has been mainly in technology stocks:
Graphs are for illustrative and discussion purposes only. Please read important disclosures at the end of this commentary.
Looking at individual sectors we can see massive pops in Materials, Industrials, Energy, Staples, and Discretionary Index ETFs. Health Care is also strong, but for Technology, the story is different. The sector index has been sloppy since October. This computes with what I told you about mega-cap technology stocks.
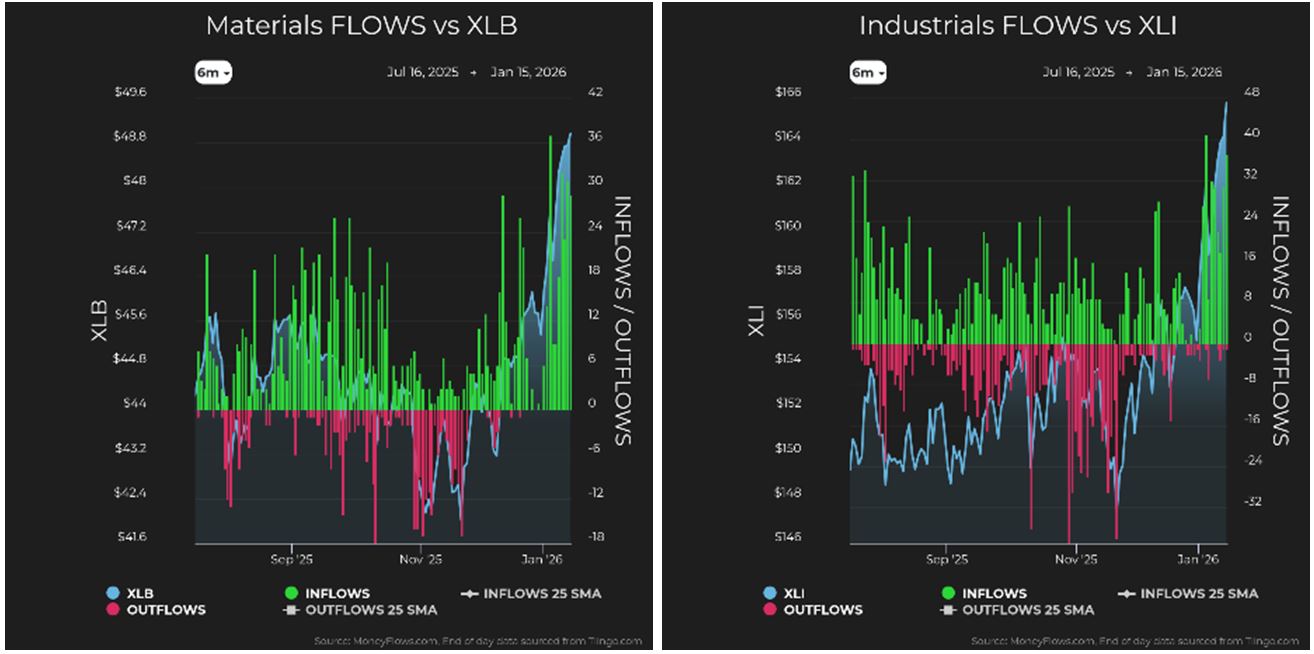
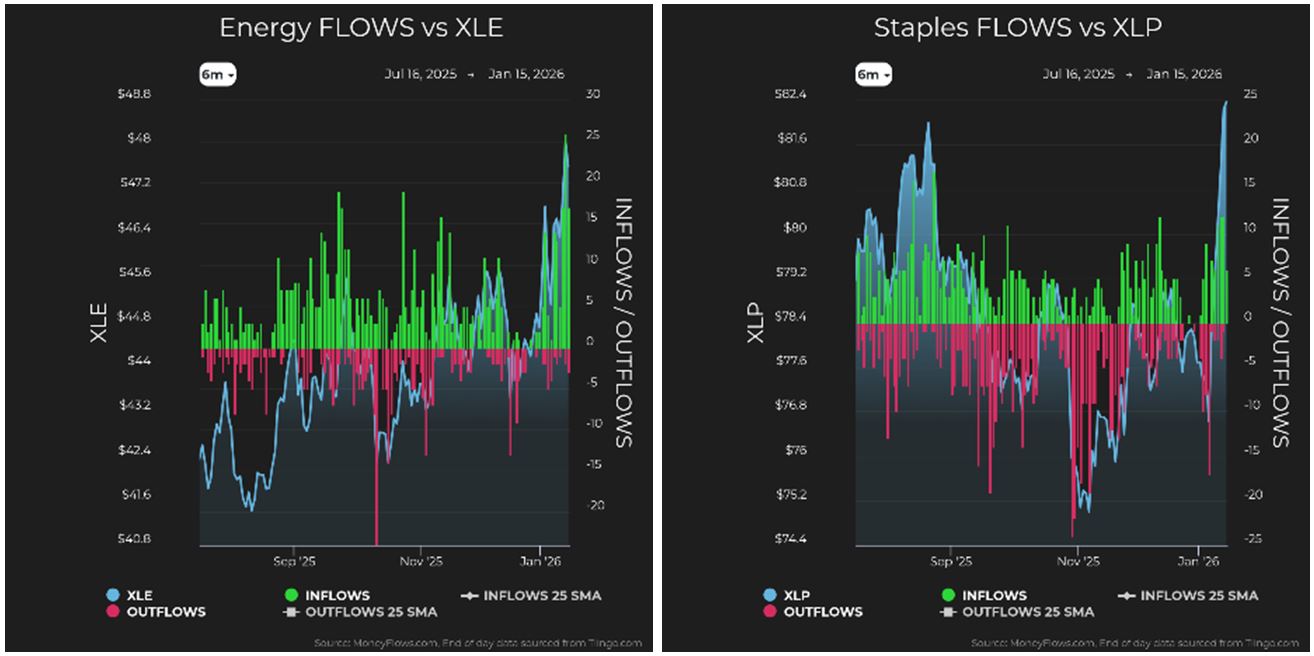
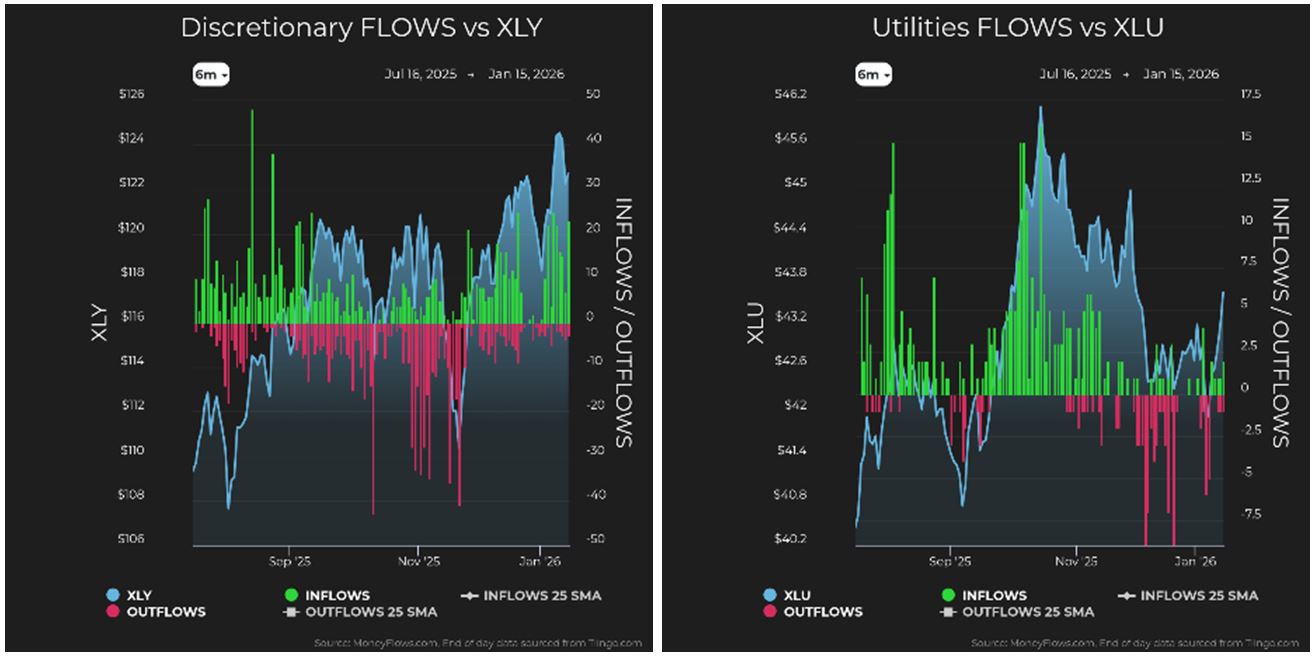
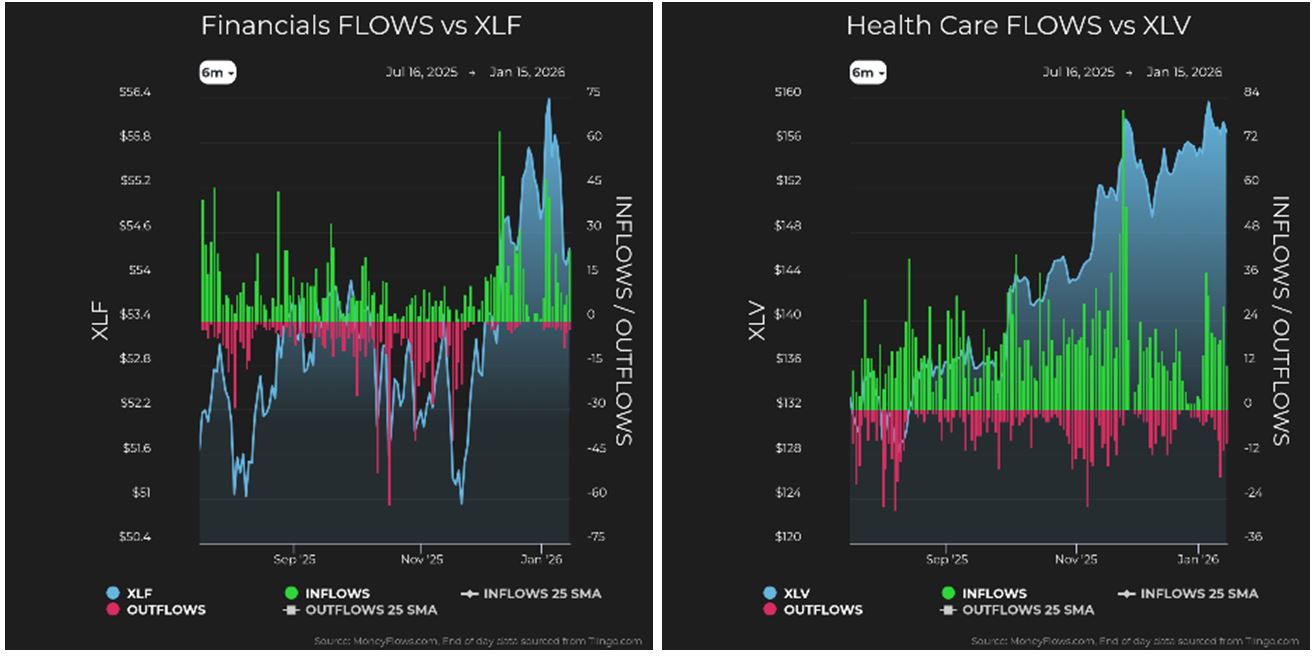
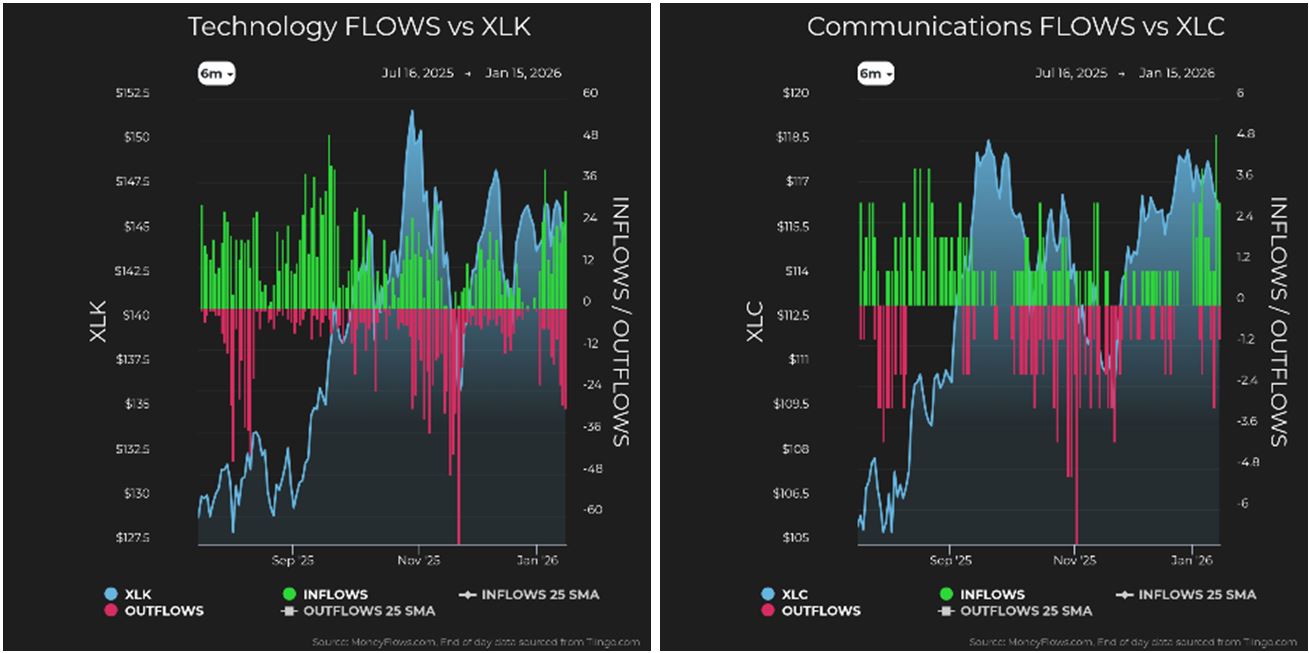
Graphs are for illustrative and discussion purposes only. Please read important disclosures at the end of this commentary.
When we look at the distribution of flows by sector, it plainly looks like money is moving out of technology and into … just about everything else. Now, take what we observed above and we can surmise money is flowing out of mega-cap technology stocks and into the smaller-cap stocks, mainly split amongst seven-sectors.
Graphs are for illustrative and discussion purposes only. Please read important disclosures at the end of this commentary.
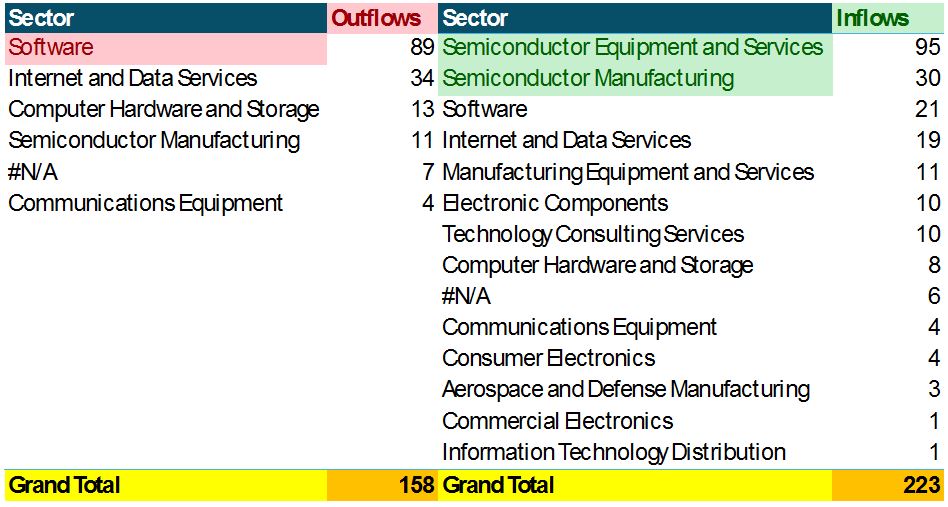
Now we can look at the Technology sector with fresh eyes. We saw 158-outflows and 223-inflows, and we can see where the action happened: Software names seeing outflows and Semiconductors seeing inflows.
Graphs are for illustrative and discussion purposes only. Please read important disclosures at the end of this commentary.
Markets are off to a great start, but most of the fun is in small-cap to mid-cap semiconductors. The news last November said the AI bubble was over… yet here we are with some vital new data among technology stocks.
“Where you stand determines what you see.”- Chester I. Barnard
All content above represents the opinion of Jason Bodner of Navellier & Associates, Inc.
Also In This Issue
A Look Ahead by Louis Navellier
Is Another Regime Change Coming Soon – This Time in Iran?
Income Mail by Bryan Perry
Kevin Warsh Has the “Chops” To Be Our Next Fed Chair
Growth Mail by Gary Alexander
Trump 2.1 Shocks the Pessimistic Pundits
Global Mail by Ivan Martchev
The Great Rotation Continues
Sector Spotlight by Jason Bodner
The Market Surge May Be Signaling a Coming Explosion in Growth
View Full Archive
Read Past Issues Here

Jason Bodner
MARKETMAIL EDITOR FOR SECTOR SPOTLIGHT
Jason Bodner writes Sector Spotlight in the weekly Marketmail publication and has authored several white papers for the company. He is also Co-Founder of Macro Analytics for Professionals which produces proprietary equity accumulation and distribution research for its clients. Previously, Mr. Bodner served as Director of European Equity Derivatives for Cantor Fitzgerald Europe in London, then moved to the role of Head of Equity Derivatives North America for the same company in New York. He also served as S.V.P. Equity Derivatives for Jefferies, LLC. He received a B.S. in business administration in 1996, with honors, from Skidmore College as a member of the Periclean Honors Society. All content of “Sector Spotlight” represents the opinion of Jason Bodner
Important Disclosures:
Jason Bodner is a co-founder and co-owner of Mapsignals. Mr. Bodner is an independent contractor who is occasionally hired by Navellier & Associates to write an article and or provide opinions for possible use in articles that appear in Navellier & Associates weekly Market Mail. Mr. Bodner is not employed or affiliated with Louis Navellier, Navellier & Associates, Inc., or any other Navellier owned entity. The opinions and statements made here are those of Mr. Bodner and not necessarily those of any other persons or entities. This is not an endorsement, or solicitation or testimonial or investment advice regarding the BMI Index or any statements or recommendations or analysis in the article or the BMI Index or Mapsignals or its products or strategies.
Although information in these reports has been obtained from and is based upon sources that Navellier believes to be reliable, Navellier does not guarantee its accuracy and it may be incomplete or condensed. All opinions and estimates constitute Navellier’s judgment as of the date the report was created and are subject to change without notice. These reports are for informational purposes only and are not a solicitation for the purchase or sale of a security. Any decision to purchase securities mentioned in these reports must take into account existing public information on such securities or any registered prospectus.To the extent permitted by law, neither Navellier & Associates, Inc., nor any of its affiliates, agents, or service providers assumes any liability or responsibility nor owes any duty of care for any consequences of any person acting or refraining to act in reliance on the information contained in this communication or for any decision based on it.
Past performance is no indication of future results. Investment in securities involves significant risk and has the potential for partial or complete loss of funds invested. It should not be assumed that any securities recommendations made by Navellier. in the future will be profitable or equal the performance of securities made in this report. Dividend payments are not guaranteed. The amount of a dividend payment, if any, can vary over time and issuers may reduce dividends paid on securities in the event of a recession or adverse event affecting a specific industry or issuer.
None of the stock information, data, and company information presented herein constitutes a recommendation by Navellier or a solicitation to buy or sell any securities. Any specific securities identified and described do not represent all of the securities purchased, sold, or recommended for advisory clients. The holdings identified do not represent all of the securities purchased, sold, or recommended for advisory clients and the reader should not assume that investments in the securities identified and discussed were or will be profitable.
Information presented is general information that does not take into account your individual circumstances, financial situation, or needs, nor does it present a personalized recommendation to you. Individual stocks presented may not be suitable for every investor. Investment in securities involves significant risk and has the potential for partial or complete loss of funds invested. Investment in fixed income securities has the potential for the investment return and principal value of an investment to fluctuate so that an investor’s holdings, when redeemed, may be worth less than their original cost.
One cannot invest directly in an index. Index is unmanaged and index performance does not reflect deduction of fees, expenses, or taxes. Presentation of Index data does not reflect a belief by Navellier that any stock index constitutes an investment alternative to any Navellier equity strategy or is necessarily comparable to such strategies. Among the most important differences between the Indices and Navellier strategies are that the Navellier equity strategies may (1) incur material management fees, (2) concentrate its investments in relatively few stocks, industries, or sectors, (3) have significantly greater trading activity and related costs, and (4) be significantly more or less volatile than the Indices.
ETF Risk: We may invest in exchange traded funds (“ETFs”) and some of our investment strategies are generally fully invested in ETFs. Like traditional mutual funds, ETFs charge asset-based fees, but they generally do not charge initial sales charges or redemption fees and investors typically pay only customary brokerage fees to buy and sell ETF shares. The fees and costs charged by ETFs held in client accounts will not be deducted from the compensation the client pays Navellier. ETF prices can fluctuate up or down, and a client account could lose money investing in an ETF if the prices of the securities owned by the ETF go down. ETFs are subject to additional risks:
- ETF shares may trade above or below their net asset value;
- An active trading market for an ETF’s shares may not develop or be maintained;
- The value of an ETF may be more volatile than the underlying portfolio of securities the ETF is designed to track;
- The cost of owning shares of the ETF may exceed those a client would incur by directly investing in the underlying securities and;
- Trading of an ETF’s shares may be halted if the listing exchange’s officials deem it appropriate, the shares are delisted from the exchange, or the activation of market-wide “circuit breakers” (which are tied to large decreases in stock prices) halts stock trading generally.
Grader Disclosures: Investment in equity strategies involves substantial risk and has the potential for partial or complete loss of funds invested. The sample portfolio and any accompanying charts are for informational purposes only and are not to be construed as a solicitation to buy or sell any financial instrument and should not be relied upon as the sole factor in an investment making decision. As a matter of normal and important disclosures to you, as a potential investor, please consider the following: The performance presented is not based on any actual securities trading, portfolio, or accounts, and the reported performance of the A, B, C, D, and F portfolios (collectively the “model portfolios”) should be considered mere “paper” or pro forma performance results based on Navellier’s research.
Investors evaluating any of Navellier & Associates, Inc.’s, (or its affiliates’) Investment Products must not use any information presented here, including the performance figures of the model portfolios, in their evaluation of any Navellier Investment Products. Navellier Investment Products include the firm’s mutual funds and managed accounts. The model portfolios, charts, and other information presented do not represent actual funded trades and are not actual funded portfolios. There are material differences between Navellier Investment Products’ portfolios and the model portfolios, research, and performance figures presented here. The model portfolios and the research results (1) may contain stocks or ETFs that are illiquid and difficult to trade; (2) may contain stock or ETF holdings materially different from actual funded Navellier Investment Product portfolios; (3) include the reinvestment of all dividends and other earnings, estimated trading costs, commissions, or management fees; and, (4) may not reflect prices obtained in an actual funded Navellier Investment Product portfolio. For these and other reasons, the reported performances of model portfolios do not reflect the performance results of Navellier’s actually funded and traded Investment Products. In most cases, Navellier’s Investment Products have materially lower performance results than the performances of the model portfolios presented.
This report contains statements that are, or may be considered to be, forward-looking statements. All statements that are not historical facts, including statements about our beliefs or expectations, are “forward-looking statements” within the meaning of The U.S. Private Securities Litigation Reform Act of 1995. These statements may be identified by such forward-looking terminology as “expect,” “estimate,” “plan,” “intend,” “believe,” “anticipate,” “may,” “will,” “should,” “could,” “continue,” “project,” or similar statements or variations of such terms. Our forward-looking statements are based on a series of expectations, assumptions, and projections, are not guarantees of future results or performance, and involve substantial risks and uncertainty as described in Form ADV Part 2A of our filing with the Securities and Exchange Commission (SEC), which is available at www.adviserinfo.sec.gov or by requesting a copy by emailing info@navellier.com. All of our forward-looking statements are as of the date of this report only. We can give no assurance that such expectations or forward-looking statements will prove to be correct. Actual results may differ materially. You are urged to carefully consider all such factors.
FEDERAL TAX ADVICE DISCLAIMER: As required by U.S. Treasury Regulations, you are informed that, to the extent this presentation includes any federal tax advice, the presentation is not written by Navellier to be used, and cannot be used, for the purpose of avoiding federal tax penalties. Navellier does not advise on any income tax requirements or issues. Use of any information presented by Navellier is for general information only and does not represent tax advice either express or implied. You are encouraged to seek professional tax advice for income tax questions and assistance.
IMPORTANT NEWSLETTER DISCLOSURE:The hypothetical performance results for investment newsletters that are authored or edited by Louis Navellier, including Louis Navellier’s Growth Investor, Louis Navellier’s Breakthrough Stocks, Louis Navellier’s Accelerated Profits, and Louis Navellier’s Platinum Club, are not based on any actual securities trading, portfolio, or accounts, and the newsletters’ reported hypothetical performances should be considered mere “paper” or proforma hypothetical performance results and are not actual performance of real world trades. Navellier & Associates, Inc. does not have any relation to or affiliation with the owner of these newsletters. There are material differences between Navellier Investment Products’ portfolios and the InvestorPlace Media, LLC newsletter portfolios authored by Louis Navellier. The InvestorPlace Media, LLC newsletters contain hypothetical performance that do not include transaction costs, advisory fees, or other fees a client might incur if actual investments and trades were being made by an investor. As a result, newsletter performance should not be used to evaluate Navellier Investment services which are separate and different from the newsletters. The owner of the newsletters is InvestorPlace Media, LLC and any questions concerning the newsletters, including any newsletter advertising or hypothetical Newsletter performance claims, (which are calculated solely by Investor Place Media and not Navellier) should be referred to InvestorPlace Media, LLC at (800) 718-8289.
Please note that Navellier & Associates and the Navellier Private Client Group are managed completely independent of the newsletters owned and published by InvestorPlace Media, LLC and written and edited by Louis Navellier, and investment performance of the newsletters should in no way be considered indicative of potential future investment performance for any Navellier & Associates separately managed account portfolio. Potential investors should consult with their financial advisor before investing in any Navellier Investment Product.
Navellier claims compliance with Global Investment Performance Standards (GIPS). To receive a complete list and descriptions of Navellier’s composites and/or a presentation that adheres to the GIPS standards, please contact Navellier or click here. It should not be assumed that any securities recommendations made by Navellier & Associates, Inc. in the future will be profitable or equal the performance of securities made in this report.
FactSet Disclosure: Navellier does not independently calculate the statistical information included in the attached report. The calculation and the information are provided by FactSet, a company not related to Navellier. Although information contained in the report has been obtained from FactSet and is based on sources Navellier believes to be reliable, Navellier does not guarantee its accuracy, and it may be incomplete or condensed. The report and the related FactSet sourced information are provided on an “as is” basis. The user assumes the entire risk of any use made of this information. Investors should consider the report as only a single factor in making their investment decision. The report is for informational purposes only and is not intended as an offer or solicitation for the purchase or sale of a security. FactSet sourced information is the exclusive property of FactSet. Without prior written permission of FactSet, this information may not be reproduced, disseminated or used to create any financial products. All indices are unmanaged and performance of the indices include reinvestment of dividends and interest income, unless otherwise noted, are not illustrative of any particular investment and an investment cannot be made in any index. Past performance is no guarantee of future results.