by Jason Bodner
January 13, 2026
My favorite form of “big game hunting” is hunting for the best stocks. As I enter any hunt, I like to look at other big game hunters, in nature. When I say “peak-efficiency hunter,” you might conjure the image of a regal lion, King of the Jungle, unchallenged while tracking prey at will, yet the lion isn’t the best hunter.
It may surprise you to learn dragonflies are the most efficient hunters. They are hyper-efficient due to their exceptional 360° vision. They also see in a broader spectrum of light than humans, like ultra-violet. It’s like they have X-ray vision. Add in their advanced brains, calculating interception paths, and unparalleled flight control with four independent wings. They can hover, fly backward, and perform rapid maneuvers to intercept whatever they want, whenever they want. This yields a 95% success rate.

My goal is not to be the most fearsome stock hunter – like a stalking lion – but to hunt like a dragonfly. With this goal, I believe a focus on data give us the edge. To have 360° vision in markets is something I’ve been working on for years. I try to look at the stock market from all angles – along with some “X-ray” vision. Looking through the lens of money flows allows us to see the whole picture, where money is flowing in and out, when it is flowing and when it is not, and who controls where prices are heading.
Looking at what the other hunters see shows us 2026 is off to a bullish start. Beginning at the top, let’s survey the hunt – where flows are going – and then work our way all the way down to individual stocks.
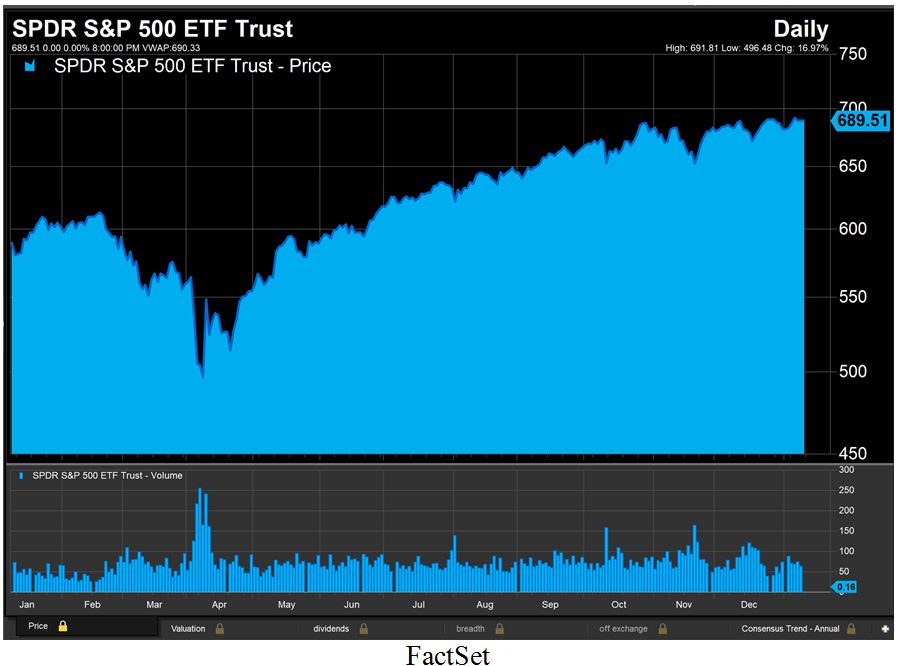
Let’s begin by viewing what a normal investor might see… Here is a standard chart of SPY with volume:
Graphs are for illustrative and discussion purposes only. Please read important disclosures at the end of this commentary.
The price trend is obviously up, and volume seems steady, with the exception of last April’s Liberation Day scare, so let’s put on our dragonfly glasses to survey the 360-degree picture at the dawn of 2026.
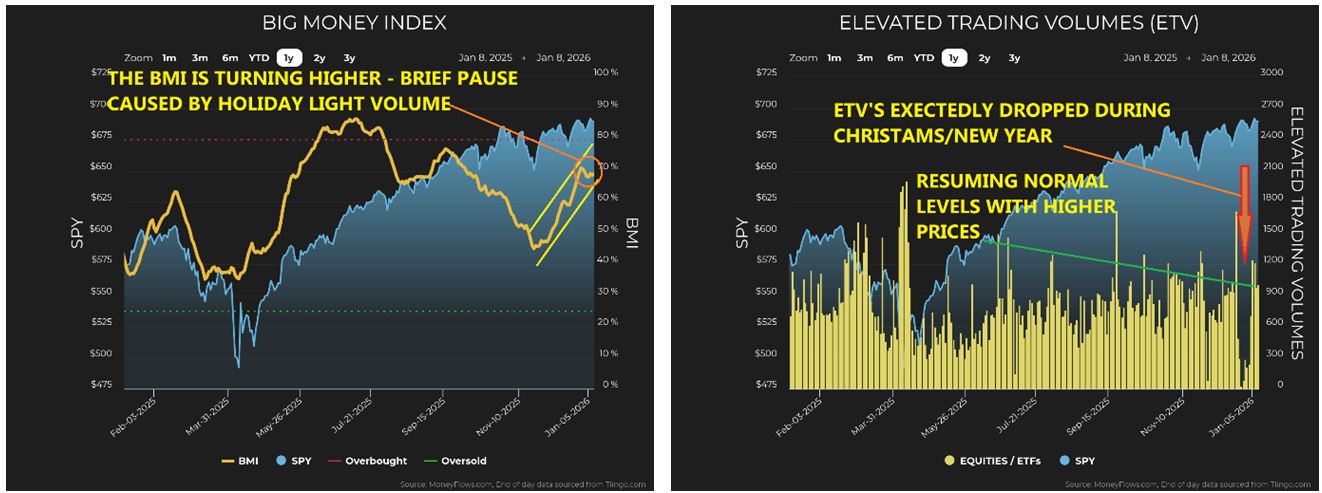
First, the Big Money Index (BMI) is a great gauge of flows ordinary investors can’t see. It smooths all the unusually large inflows and outflows over a 25-day moving average. Since November, the BMI has been rising steadily, meaning there have been substantially more inflows than outflows. It sagged a bit in the last two weeks, but if we look at Elevated Trading Volumes (unusually large trades) we see the void of trading activity normally associated with the end-of-year holidays coincided with the BMI’s pause.
Graphs are for illustrative and discussion purposes only. Please read important disclosures at the end of this commentary.
Now ETVs are back to normal levels, and the BMI is rising, along with higher market prices.
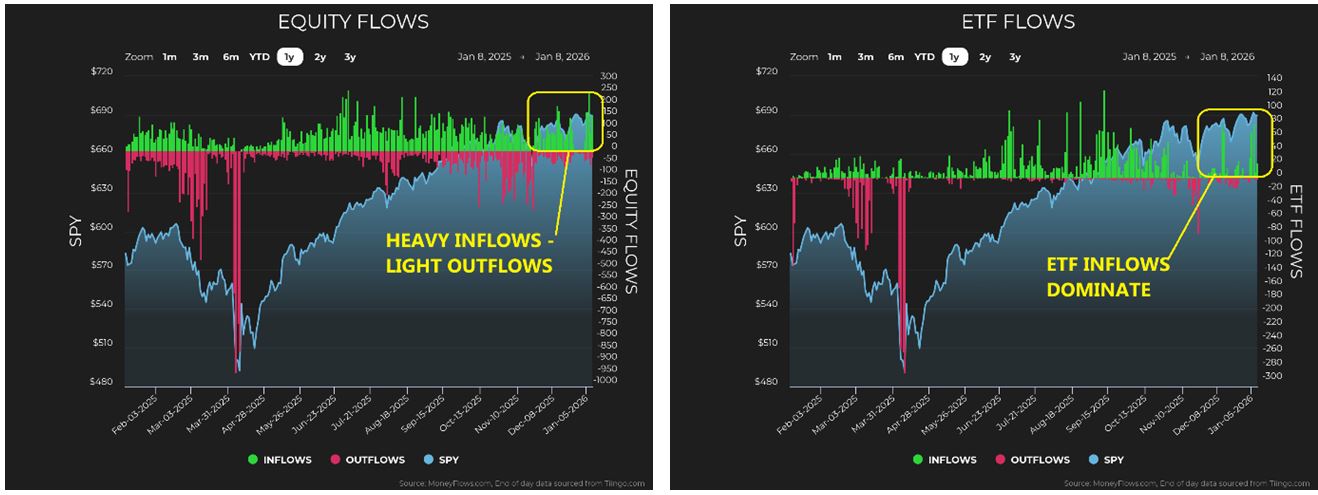
The BMI smooths flow signals over 25-days, based on a proprietary algorithm seeking to identify when big professional investors (like hedge funds and institutions) are trying to be quiet about making big moves but still leave a trail. This trail is invisible to the average investor, but to an investing dragonfly, they show up like bright lights. (Green shows unusually large inflows while red shows outflows). This allows us to see big investors are heavily slanted towards inflows. This is true for both stocks and ETFs:
Graphs are for illustrative and discussion purposes only. Please read important disclosures at the end of this commentary.
The dragonfly sees investment sentiment is heavily bullish despite the noise of constant negative news headlines. Dragonflies aren’t focused on ICE, Minnesota, Venezuela, Russia-Ukraine, China-Taiwan, or any other news-media focuses. Dragonflies see only inflows.
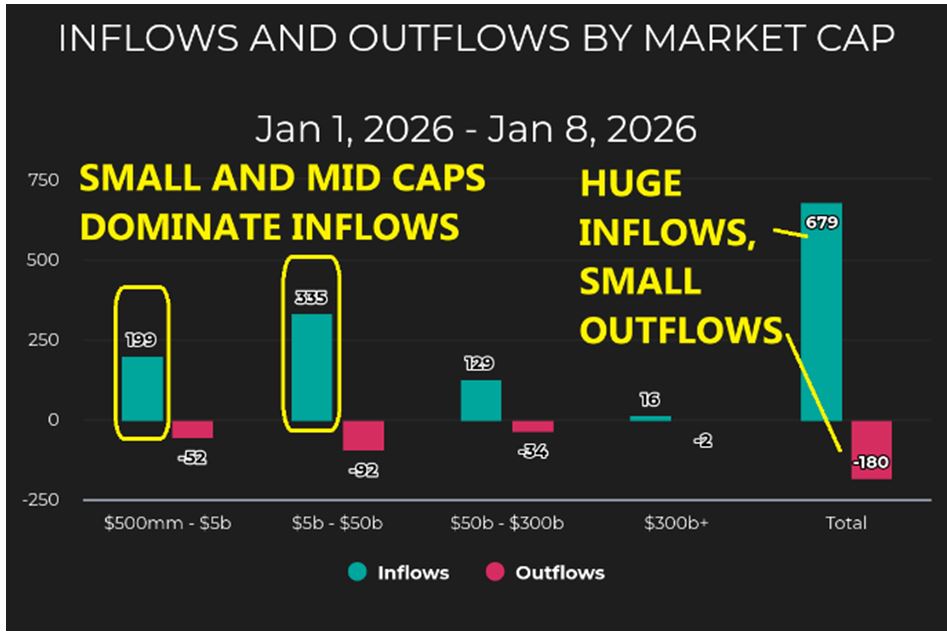
Next, we can see these dominant inflows are moving heavily into riskier stocks. Look how the inflows have been dominated by smaller and mid-sized companies – normally associated with risk:
Graphs are for illustrative and discussion purposes only. Please read important disclosures at the end of this commentary.
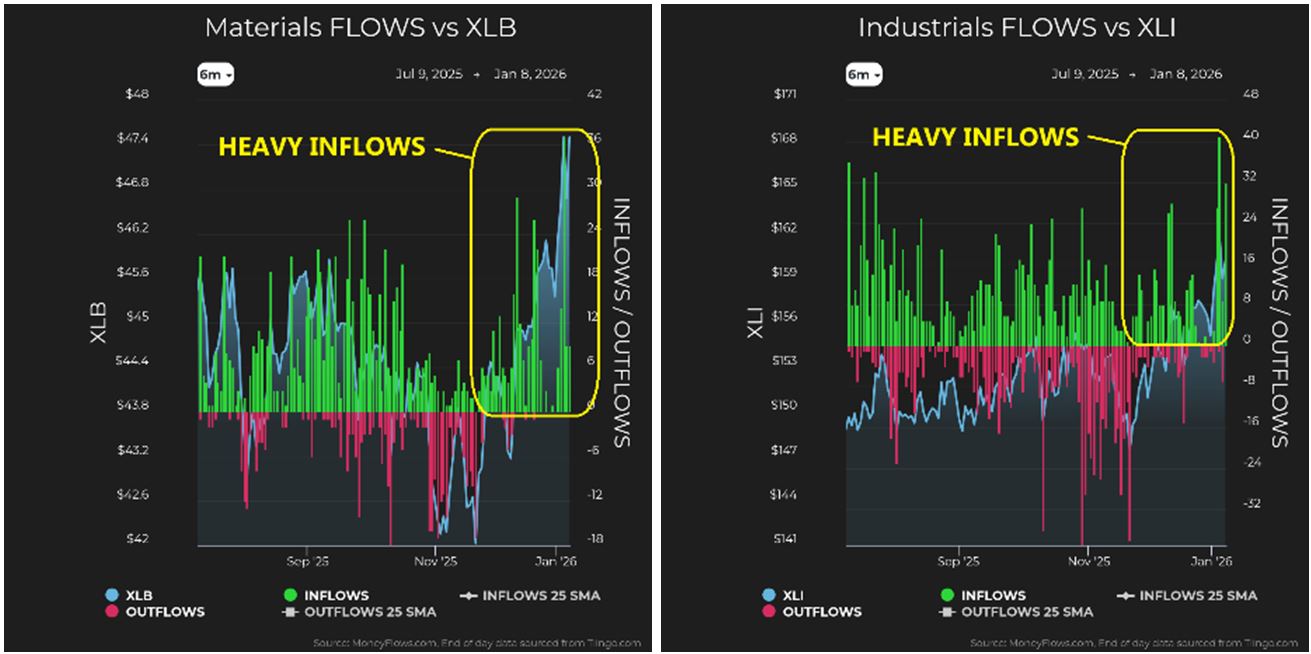
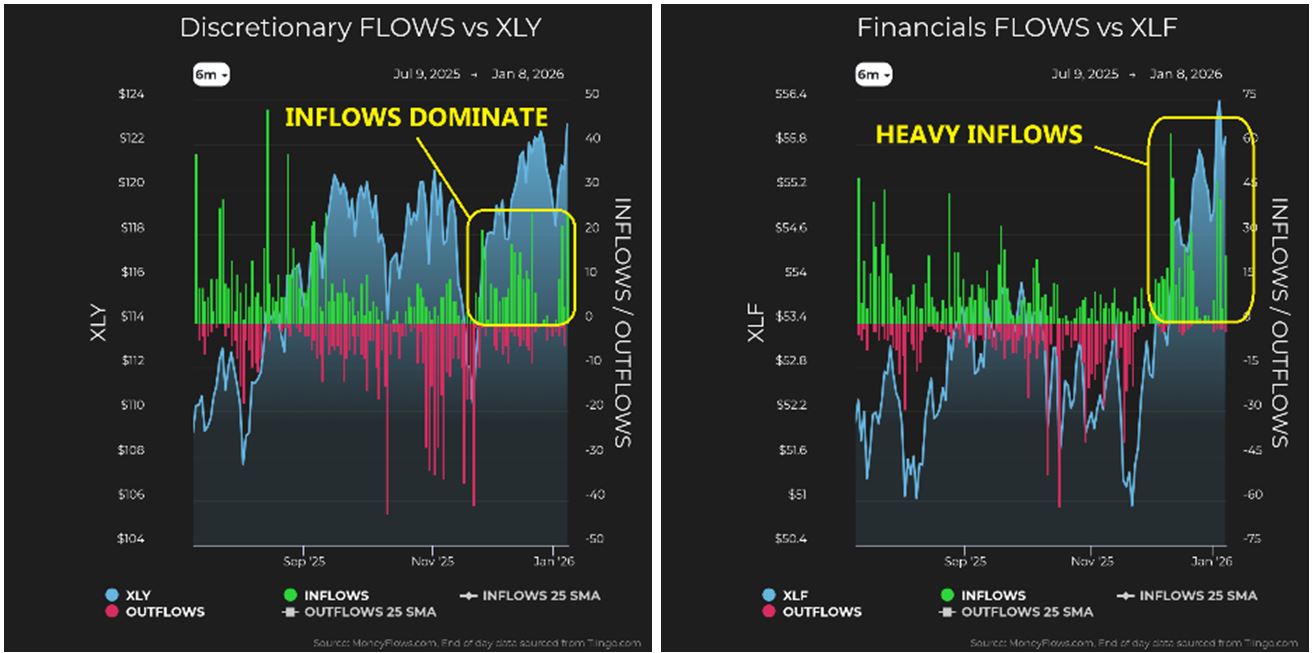
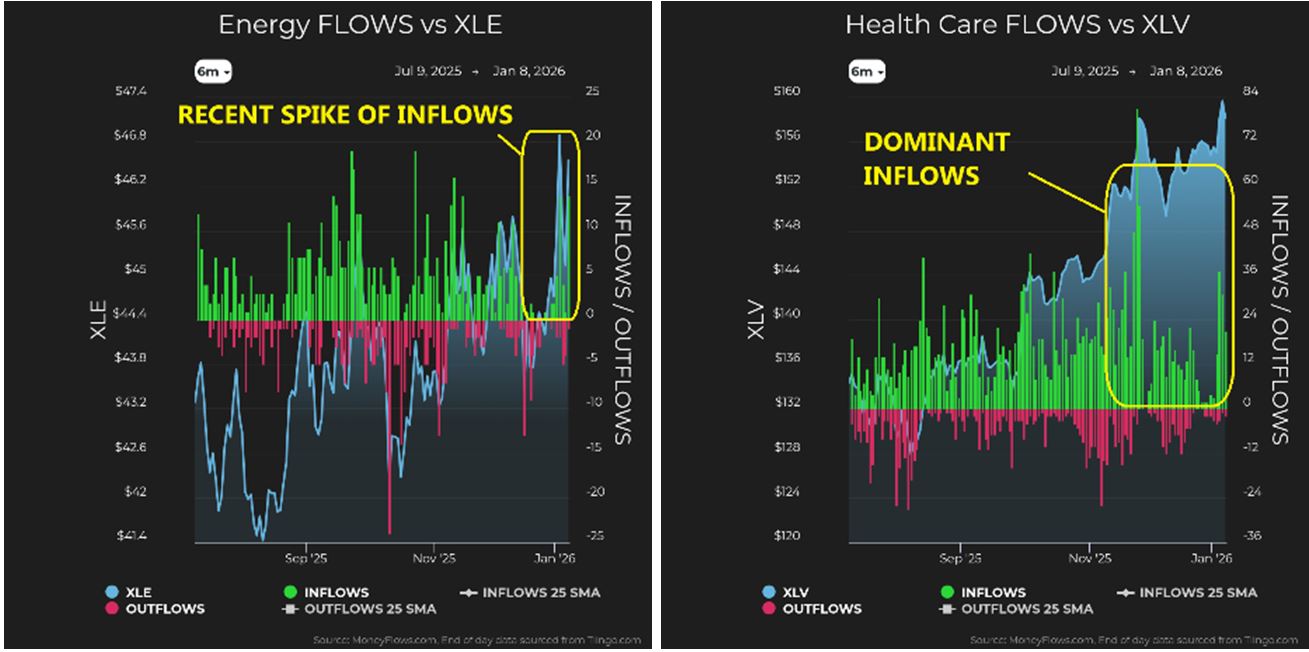
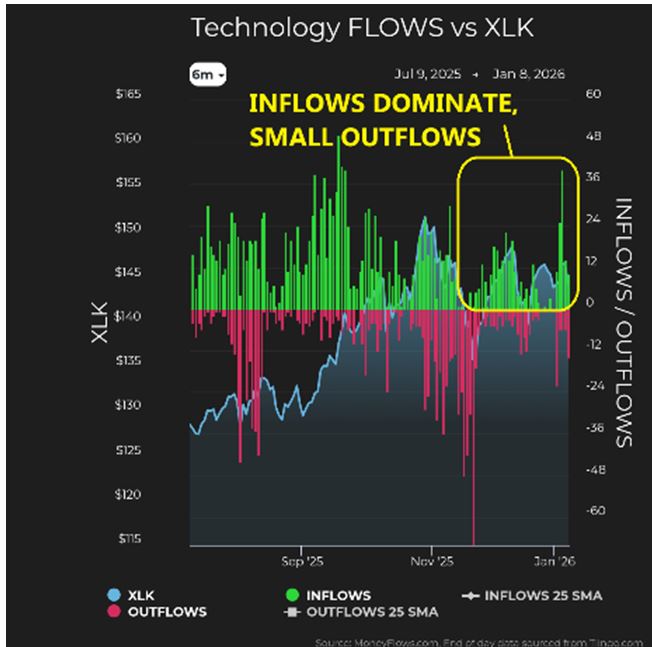
Moving down a layer, we see flow distribution at the sector level, where money is flowing into sectors typically associated with a prosperous economy. Materials, Industrials, Discretionary, and Financials are seeing huge inflows. The same is true for Health Care, and even Energy. Technology is holding its own.
Graphs are for illustrative and discussion purposes only. Please read important disclosures at the end of this commentary.
We also see defensive sectors like Staples, Utilities, Communications, and Real Estate not gaining capital. In fact, Staples and Utilities are seeing outflows. This tells me investors have a clear risk-on appetite.
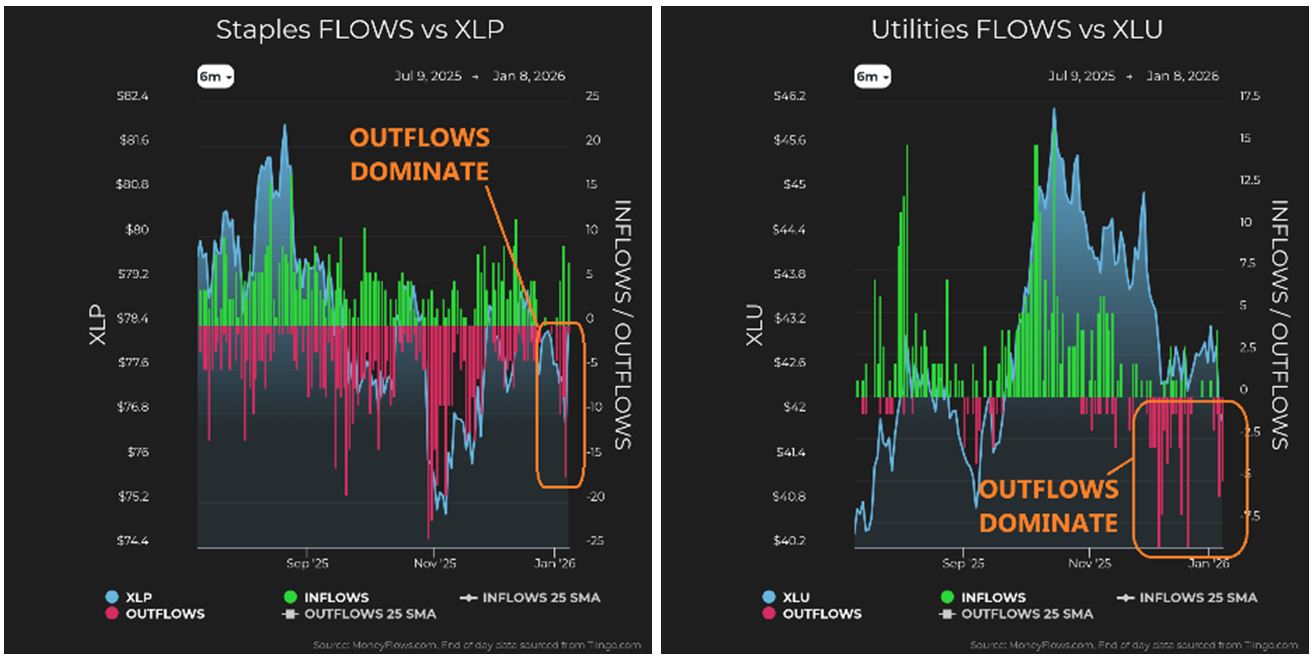
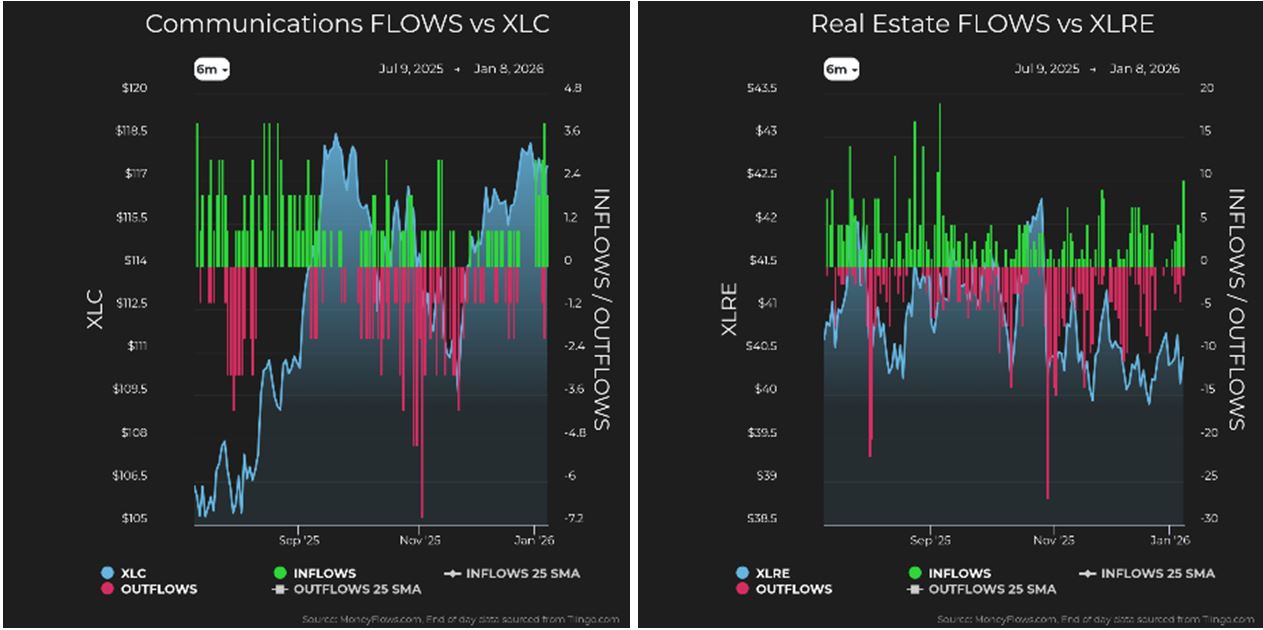
Graphs are for illustrative and discussion purposes only. Please read important disclosures at the end of this commentary.
Now, let’s look at how sector flows have distributed since the year began. We see capital flowing into riskier sectors. The relatively small outflows now occurring are found in Technology, Staples, Energy, and Utilities. I prefer when Technology has heavy inflows, but the outflows don’t concern me. First off, Technology is the largest universe with 287-Technology stocks institutionally tradeable. The outflows we observe since January account for only 4% of the Technology universe – nothing to be concerned about.
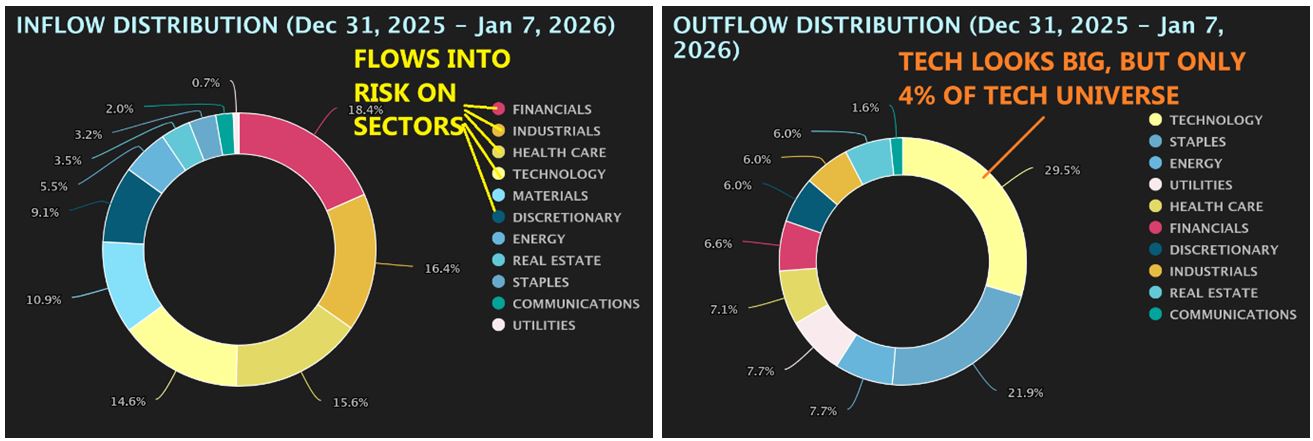
Graphs are for illustrative and discussion purposes only. Please read important disclosures at the end of this commentary.
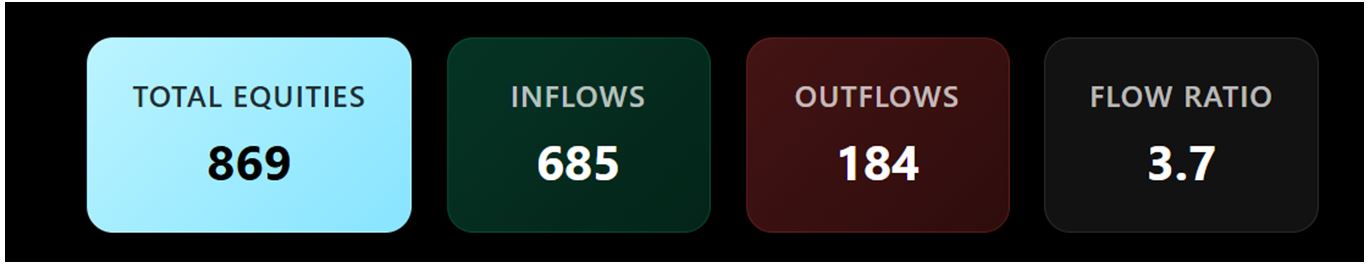
Now we’re hunting! We now know flows are moving into smaller, riskier assets while moving out of defensive areas, so let’s hone in on what could be easy prey. I looked at all the stocks seeing inflows since January 1st. There were 685-inflows out of 869-stocks registering signals – a 3.7-to-1 ratio.
Graphs are for illustrative and discussion purposes only. Please read important disclosures at the end of this commentary.
I then sorted for stocks with the highest scores and most inflow signals. I filtered for quality, looking for stocks with a MapScore of 70 or better, and a fundamental score of 70 or better. I was left with 83-stocks. Removing duplicates (as some had five inflow signals since January 1) I was left with 52-stocks.
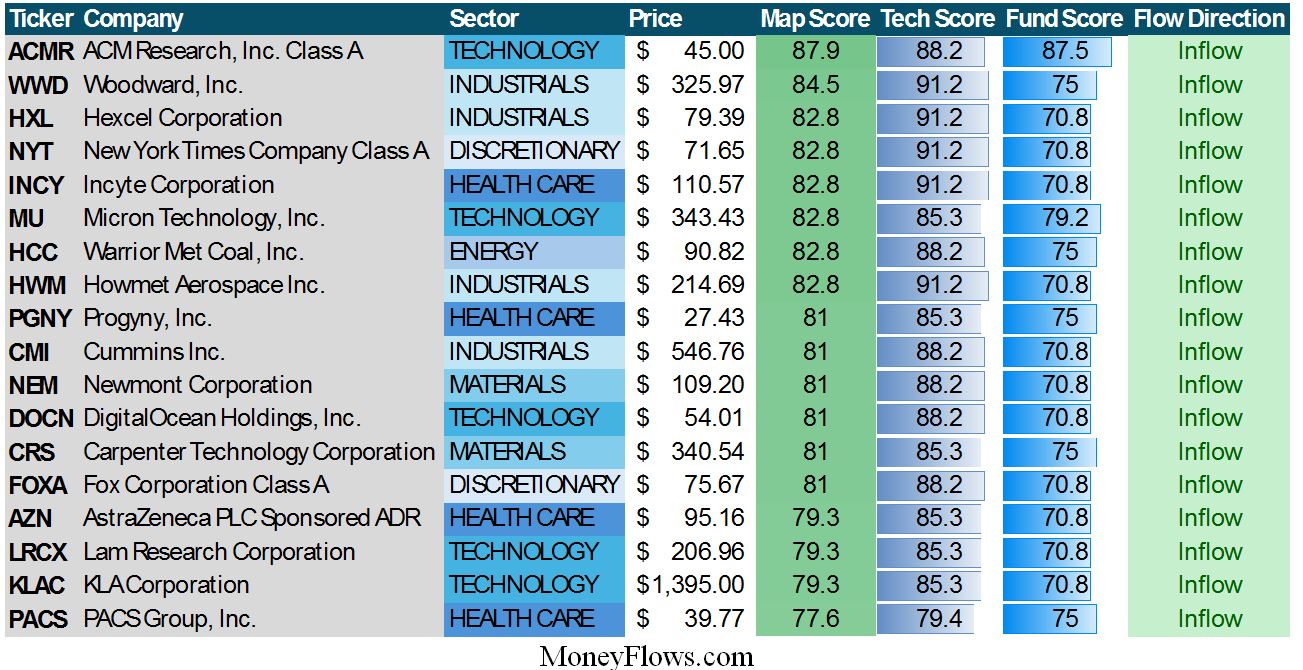
This is a target-rich environment. Still, 52 are too many stocks. To narrow it down, I looked for stocks which appeared on MoneyFlows Outlier 20 Report since October 1st. Here is the list of 18-stocks.
Graphs are for illustrative and discussion purposes only. Please read important disclosures at the end of this commentary.
From this list, I would delve into the fundamentals, looking for low debt levels, high-profit margins and growing sales and earnings. I leave it to you. The point is, hunting for stocks is like being a dragonfly.
“To eat is a necessity, but to eat intelligently is an art” – François de la Rochefoucauld.
Navellier & Associates; own WWD, INCY, CMI, NEM, FOXA, KLAC, HWM, CRS, and LRCX. Navellier does not own ACMR, MU, HXL, NYT, HCC, PGNY, DOCN, AZN, or PACS in managed accounts.
Jason Bodner owns shares in ACMR, MU, HWM, CRS, LRCX, either in publishing portfolios, managed or personal accounts. He does not personally own NYT, HCC, PGNY, DOCN, AZN, WWD, INCY, CMI, NEM, FOXA, KLAC, or PACS.
All content above represents the opinion of Jason Bodner of Navellier & Associates, Inc.
Also In This Issue
A Look Ahead by Louis Navellier
Major Moves in the Caribbean Region Keep Oil Flowing
Income Mail by Bryan Perry
The New Year Is Loaded with Lots of Moving Parts
Growth Mail by Gary Alexander
As Birth Rates Shrink, Demography Defines Our Destiny
Global Mail by Ivan Martchev
As the First Week in January Goes, So Goes the Year
Sector Spotlight by Jason Bodner
The New Year Brings a New Hunt for Market Winners
View Full Archive
Read Past Issues Here

Jason Bodner
MARKETMAIL EDITOR FOR SECTOR SPOTLIGHT
Jason Bodner writes Sector Spotlight in the weekly Marketmail publication and has authored several white papers for the company. He is also Co-Founder of Macro Analytics for Professionals which produces proprietary equity accumulation and distribution research for its clients. Previously, Mr. Bodner served as Director of European Equity Derivatives for Cantor Fitzgerald Europe in London, then moved to the role of Head of Equity Derivatives North America for the same company in New York. He also served as S.V.P. Equity Derivatives for Jefferies, LLC. He received a B.S. in business administration in 1996, with honors, from Skidmore College as a member of the Periclean Honors Society. All content of “Sector Spotlight” represents the opinion of Jason Bodner
Important Disclosures:
Jason Bodner is a co-founder and co-owner of Mapsignals. Mr. Bodner is an independent contractor who is occasionally hired by Navellier & Associates to write an article and or provide opinions for possible use in articles that appear in Navellier & Associates weekly Market Mail. Mr. Bodner is not employed or affiliated with Louis Navellier, Navellier & Associates, Inc., or any other Navellier owned entity. The opinions and statements made here are those of Mr. Bodner and not necessarily those of any other persons or entities. This is not an endorsement, or solicitation or testimonial or investment advice regarding the BMI Index or any statements or recommendations or analysis in the article or the BMI Index or Mapsignals or its products or strategies.
Although information in these reports has been obtained from and is based upon sources that Navellier believes to be reliable, Navellier does not guarantee its accuracy and it may be incomplete or condensed. All opinions and estimates constitute Navellier’s judgment as of the date the report was created and are subject to change without notice. These reports are for informational purposes only and are not a solicitation for the purchase or sale of a security. Any decision to purchase securities mentioned in these reports must take into account existing public information on such securities or any registered prospectus.To the extent permitted by law, neither Navellier & Associates, Inc., nor any of its affiliates, agents, or service providers assumes any liability or responsibility nor owes any duty of care for any consequences of any person acting or refraining to act in reliance on the information contained in this communication or for any decision based on it.
Past performance is no indication of future results. Investment in securities involves significant risk and has the potential for partial or complete loss of funds invested. It should not be assumed that any securities recommendations made by Navellier. in the future will be profitable or equal the performance of securities made in this report. Dividend payments are not guaranteed. The amount of a dividend payment, if any, can vary over time and issuers may reduce dividends paid on securities in the event of a recession or adverse event affecting a specific industry or issuer.
None of the stock information, data, and company information presented herein constitutes a recommendation by Navellier or a solicitation to buy or sell any securities. Any specific securities identified and described do not represent all of the securities purchased, sold, or recommended for advisory clients. The holdings identified do not represent all of the securities purchased, sold, or recommended for advisory clients and the reader should not assume that investments in the securities identified and discussed were or will be profitable.
Information presented is general information that does not take into account your individual circumstances, financial situation, or needs, nor does it present a personalized recommendation to you. Individual stocks presented may not be suitable for every investor. Investment in securities involves significant risk and has the potential for partial or complete loss of funds invested. Investment in fixed income securities has the potential for the investment return and principal value of an investment to fluctuate so that an investor’s holdings, when redeemed, may be worth less than their original cost.
One cannot invest directly in an index. Index is unmanaged and index performance does not reflect deduction of fees, expenses, or taxes. Presentation of Index data does not reflect a belief by Navellier that any stock index constitutes an investment alternative to any Navellier equity strategy or is necessarily comparable to such strategies. Among the most important differences between the Indices and Navellier strategies are that the Navellier equity strategies may (1) incur material management fees, (2) concentrate its investments in relatively few stocks, industries, or sectors, (3) have significantly greater trading activity and related costs, and (4) be significantly more or less volatile than the Indices.
ETF Risk: We may invest in exchange traded funds (“ETFs”) and some of our investment strategies are generally fully invested in ETFs. Like traditional mutual funds, ETFs charge asset-based fees, but they generally do not charge initial sales charges or redemption fees and investors typically pay only customary brokerage fees to buy and sell ETF shares. The fees and costs charged by ETFs held in client accounts will not be deducted from the compensation the client pays Navellier. ETF prices can fluctuate up or down, and a client account could lose money investing in an ETF if the prices of the securities owned by the ETF go down. ETFs are subject to additional risks:
- ETF shares may trade above or below their net asset value;
- An active trading market for an ETF’s shares may not develop or be maintained;
- The value of an ETF may be more volatile than the underlying portfolio of securities the ETF is designed to track;
- The cost of owning shares of the ETF may exceed those a client would incur by directly investing in the underlying securities and;
- Trading of an ETF’s shares may be halted if the listing exchange’s officials deem it appropriate, the shares are delisted from the exchange, or the activation of market-wide “circuit breakers” (which are tied to large decreases in stock prices) halts stock trading generally.
Grader Disclosures: Investment in equity strategies involves substantial risk and has the potential for partial or complete loss of funds invested. The sample portfolio and any accompanying charts are for informational purposes only and are not to be construed as a solicitation to buy or sell any financial instrument and should not be relied upon as the sole factor in an investment making decision. As a matter of normal and important disclosures to you, as a potential investor, please consider the following: The performance presented is not based on any actual securities trading, portfolio, or accounts, and the reported performance of the A, B, C, D, and F portfolios (collectively the “model portfolios”) should be considered mere “paper” or pro forma performance results based on Navellier’s research.
Investors evaluating any of Navellier & Associates, Inc.’s, (or its affiliates’) Investment Products must not use any information presented here, including the performance figures of the model portfolios, in their evaluation of any Navellier Investment Products. Navellier Investment Products include the firm’s mutual funds and managed accounts. The model portfolios, charts, and other information presented do not represent actual funded trades and are not actual funded portfolios. There are material differences between Navellier Investment Products’ portfolios and the model portfolios, research, and performance figures presented here. The model portfolios and the research results (1) may contain stocks or ETFs that are illiquid and difficult to trade; (2) may contain stock or ETF holdings materially different from actual funded Navellier Investment Product portfolios; (3) include the reinvestment of all dividends and other earnings, estimated trading costs, commissions, or management fees; and, (4) may not reflect prices obtained in an actual funded Navellier Investment Product portfolio. For these and other reasons, the reported performances of model portfolios do not reflect the performance results of Navellier’s actually funded and traded Investment Products. In most cases, Navellier’s Investment Products have materially lower performance results than the performances of the model portfolios presented.
This report contains statements that are, or may be considered to be, forward-looking statements. All statements that are not historical facts, including statements about our beliefs or expectations, are “forward-looking statements” within the meaning of The U.S. Private Securities Litigation Reform Act of 1995. These statements may be identified by such forward-looking terminology as “expect,” “estimate,” “plan,” “intend,” “believe,” “anticipate,” “may,” “will,” “should,” “could,” “continue,” “project,” or similar statements or variations of such terms. Our forward-looking statements are based on a series of expectations, assumptions, and projections, are not guarantees of future results or performance, and involve substantial risks and uncertainty as described in Form ADV Part 2A of our filing with the Securities and Exchange Commission (SEC), which is available at www.adviserinfo.sec.gov or by requesting a copy by emailing info@navellier.com. All of our forward-looking statements are as of the date of this report only. We can give no assurance that such expectations or forward-looking statements will prove to be correct. Actual results may differ materially. You are urged to carefully consider all such factors.
FEDERAL TAX ADVICE DISCLAIMER: As required by U.S. Treasury Regulations, you are informed that, to the extent this presentation includes any federal tax advice, the presentation is not written by Navellier to be used, and cannot be used, for the purpose of avoiding federal tax penalties. Navellier does not advise on any income tax requirements or issues. Use of any information presented by Navellier is for general information only and does not represent tax advice either express or implied. You are encouraged to seek professional tax advice for income tax questions and assistance.
IMPORTANT NEWSLETTER DISCLOSURE:The hypothetical performance results for investment newsletters that are authored or edited by Louis Navellier, including Louis Navellier’s Growth Investor, Louis Navellier’s Breakthrough Stocks, Louis Navellier’s Accelerated Profits, and Louis Navellier’s Platinum Club, are not based on any actual securities trading, portfolio, or accounts, and the newsletters’ reported hypothetical performances should be considered mere “paper” or proforma hypothetical performance results and are not actual performance of real world trades. Navellier & Associates, Inc. does not have any relation to or affiliation with the owner of these newsletters. There are material differences between Navellier Investment Products’ portfolios and the InvestorPlace Media, LLC newsletter portfolios authored by Louis Navellier. The InvestorPlace Media, LLC newsletters contain hypothetical performance that do not include transaction costs, advisory fees, or other fees a client might incur if actual investments and trades were being made by an investor. As a result, newsletter performance should not be used to evaluate Navellier Investment services which are separate and different from the newsletters. The owner of the newsletters is InvestorPlace Media, LLC and any questions concerning the newsletters, including any newsletter advertising or hypothetical Newsletter performance claims, (which are calculated solely by Investor Place Media and not Navellier) should be referred to InvestorPlace Media, LLC at (800) 718-8289.
Please note that Navellier & Associates and the Navellier Private Client Group are managed completely independent of the newsletters owned and published by InvestorPlace Media, LLC and written and edited by Louis Navellier, and investment performance of the newsletters should in no way be considered indicative of potential future investment performance for any Navellier & Associates separately managed account portfolio. Potential investors should consult with their financial advisor before investing in any Navellier Investment Product.
Navellier claims compliance with Global Investment Performance Standards (GIPS). To receive a complete list and descriptions of Navellier’s composites and/or a presentation that adheres to the GIPS standards, please contact Navellier or click here. It should not be assumed that any securities recommendations made by Navellier & Associates, Inc. in the future will be profitable or equal the performance of securities made in this report.
FactSet Disclosure: Navellier does not independently calculate the statistical information included in the attached report. The calculation and the information are provided by FactSet, a company not related to Navellier. Although information contained in the report has been obtained from FactSet and is based on sources Navellier believes to be reliable, Navellier does not guarantee its accuracy, and it may be incomplete or condensed. The report and the related FactSet sourced information are provided on an “as is” basis. The user assumes the entire risk of any use made of this information. Investors should consider the report as only a single factor in making their investment decision. The report is for informational purposes only and is not intended as an offer or solicitation for the purchase or sale of a security. FactSet sourced information is the exclusive property of FactSet. Without prior written permission of FactSet, this information may not be reproduced, disseminated or used to create any financial products. All indices are unmanaged and performance of the indices include reinvestment of dividends and interest income, unless otherwise noted, are not illustrative of any particular investment and an investment cannot be made in any index. Past performance is no guarantee of future results.