by Jason Bodner
November 18, 2025
The quietest place on Earth is Minnesota’s Orfield Labs. Sit inside long enough and you can hear your own heart-beat and even blood flowing. When external noise gets turned down, internal signals get louder.
Orfield’s anechoic-chamber is a room designed to completely absorb sound and electromagnetic-waves, eliminating echoes and external noise. This is achieved by lining the walls, floor, and ceiling with sound-absorbing materials like large foam wedges that will trap and dissipate sound waves.

Markets work the same way. When things get loud, turn out the noise and focus on underlying signals.
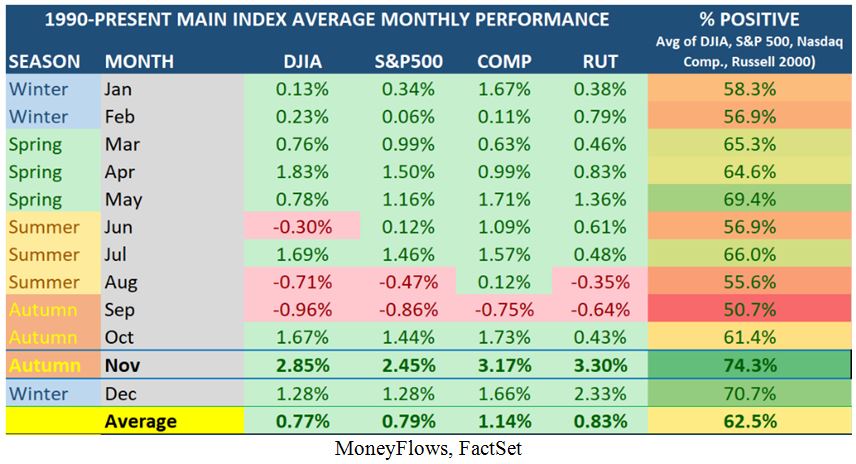
A little context to the latest sell-off: November volatility is unusual, but Thursday’s technology-heavy equity dump was pretty loud. Since 1990, 26 of 35 (74.3%) Novembers were positive, with the S&P 500 averaging +2.45-percent and NASDAQ +3.17-percent, with the Dow up 2.85% and Russell 2000 +3.3%.
Graphs are for illustrative and discussion purposes only. Please read important disclosures at the end of this commentary.
At the mid-way point, through last Friday, this November looks off script, but the second-half may revert to form. Seasonally, September should have been ugly, and October should have been choppier, so maybe November’s turbulence is also fighting the script. With many calling this market over-heated, a pull-back is healthy. If it deepens, I view it as a chance to buy excellent companies with superior fundamentals.
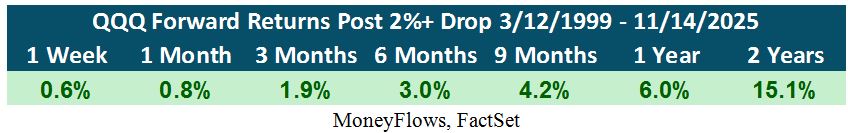
For perspective, last Thursday’s -2.04% drop in QQQ was one of only 590-sessions out of 9,008-sessions in which it fell by 2% or more. That’s one out of 15-sessions (6.55%). Not enjoyable, not frequent, but in the range of normal. Better yet, forward returns after drops like this have historically been solid. One-week and one-month forward returns tend to be modest but positive, and the curve strengthens from there.
Graphs are for illustrative and discussion purposes only. Please read important disclosures at the end of this commentary.
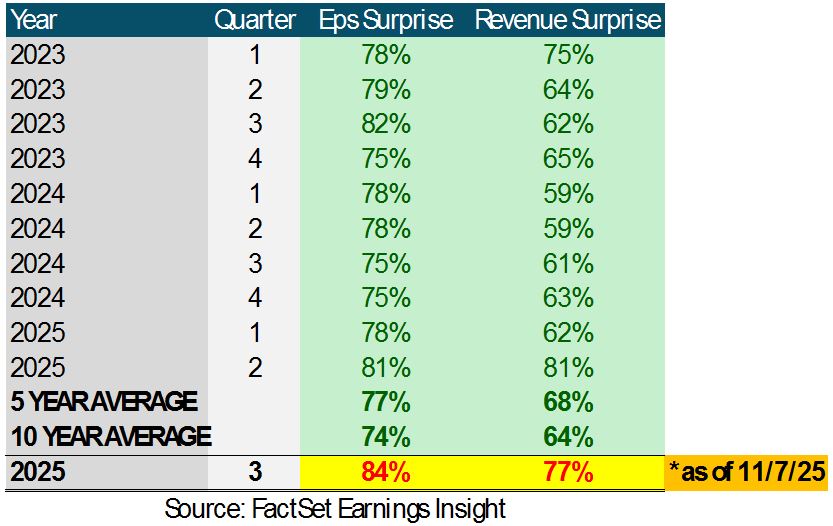
Many pundits keep comparing today’s AI run to the late 1990s. I don’t buy that comparison. Back then, investors shoveled money into companies with no sales, no earnings, and no profits. Many stocks traded at infinite multiples. By contrast, today’s technology surge is dominated by real revenue growth, real earnings growth, and expanding profit margins. FactSet data backs this up. For Q3 2025, with 91% of the S&P 500 reporting, 82% beat earnings estimates and 77% beat revenue. The blended earnings growth rate is 13%. If that number holds, it will mark the fourth-straight quarter of double-digit earnings growth.
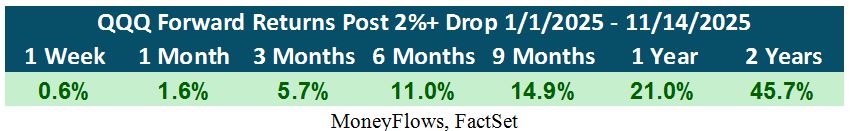
This brings us back to QQQ. Because this isn’t a 1999 internet bubble, let’s exclude the late 1990s and early 2000. For the last two-decades, forward returns after drops like yesterday look even stronger.
Graphs are for illustrative and discussion purposes only. Please read important disclosures at the end of this commentary.
That is why I suggest that you don’t subscribe to the fear that will inevitably spread. Instead, buy into it.
Next, let’s address a factor not being talked about… crypto-currency is under real pressure. A spike in volatility, cooling institutional flows, and a stronger dollar are squeezing a market already stuffed with leverage. When big moves hit, especially sudden draw-downs like we have seen recently, forced liquidations rip through the system. Here is the part most people miss: Those margin calls never stay contained in crypto-currency. Traders facing levered losses raise cash wherever they can, fast, and the most liquid pockets of their portfolios are large-cap technology and other high-flying equities. So, any weakness in crypto-currency spills into stocks not because fundamentals change, but because traders hunt for liquidity. It has a domino effect. A levered unwind in one corner of the market triggers selling in the strongest, most easily sold names in another.
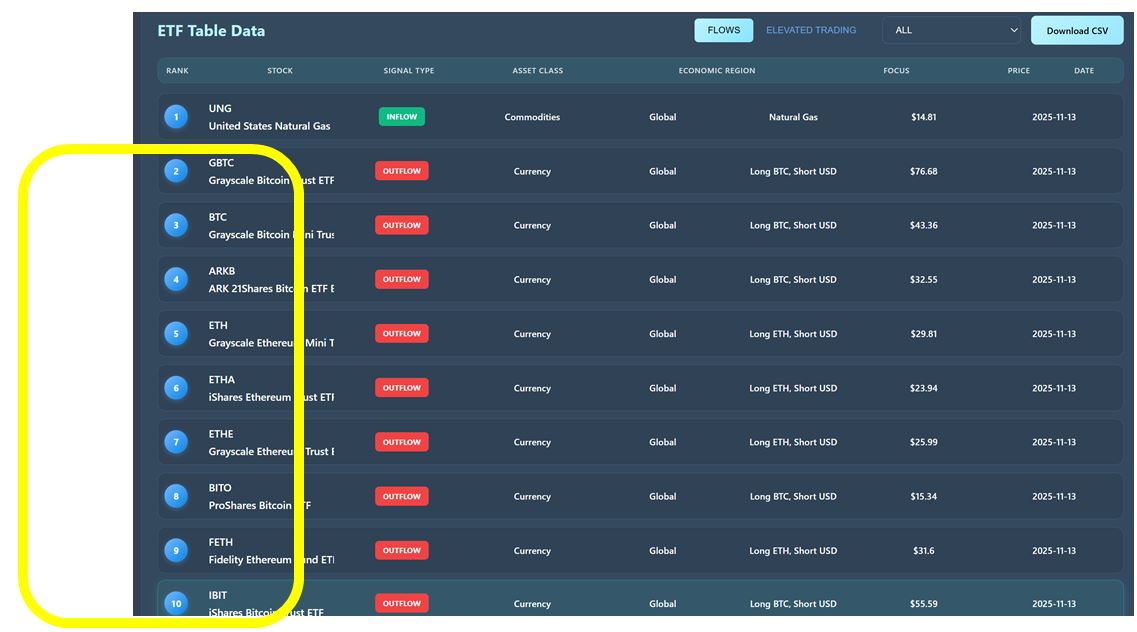
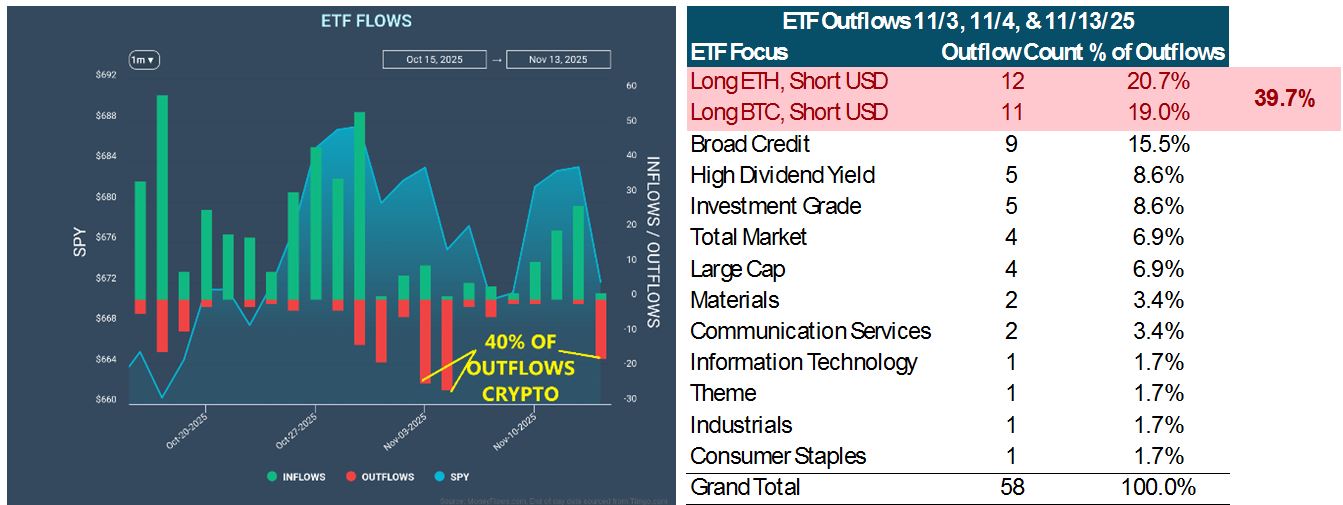
If you want confirmation, look at this sampling of last Thursday’s unusually high ETF outflows:
Graphs are for illustrative and discussion purposes only. Please read important disclosures at the end of this commentary.
Notice anything? Crypto-currency outflows dominated. This same pattern showed up earlier this month, too.
Looking at the three-elevated outflow days in ETFs – namely, November 3rd, 4th and 13th, about 40% of ETF outflows were related to Bitcoin and Ethereum, the leading crypto-currencies.
Graphs are for illustrative and discussion purposes only. Please read important disclosures at the end of this commentary.
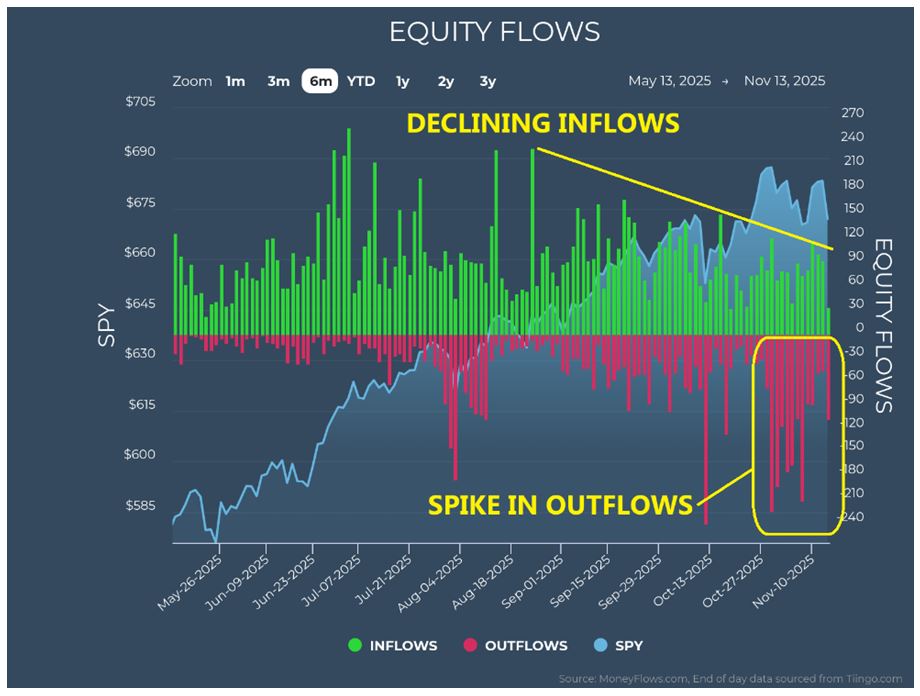
Getting back to equities, the Big Money Index (BMI) gave us a head fake on November 11th. It looked like it would rally at first, but the trend is clearly down. Now just above 50%, it is well off mid-September’s peak of 77%. At first, heavy outflows were not a factor in dragging it down, just fading inflows. Lately the narrative shifted toward more outflows than inflows, which accelerated the BMI drop.
Graphs are for illustrative and discussion purposes only. Please read important disclosures at the end of this commentary.
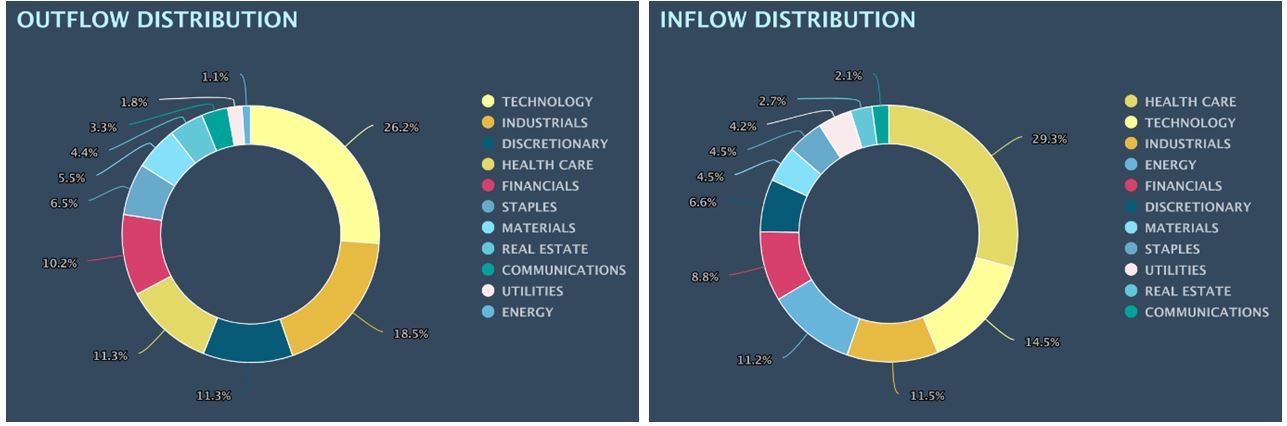
Outflows have been especially heavy in technology. On 11/13, 26% of all outflows were technology shares. Digging into the details, many high-ranking fundamental names were seeing distribution.
Graphs are for illustrative and discussion purposes only. Please read important disclosures at the end of this commentary.
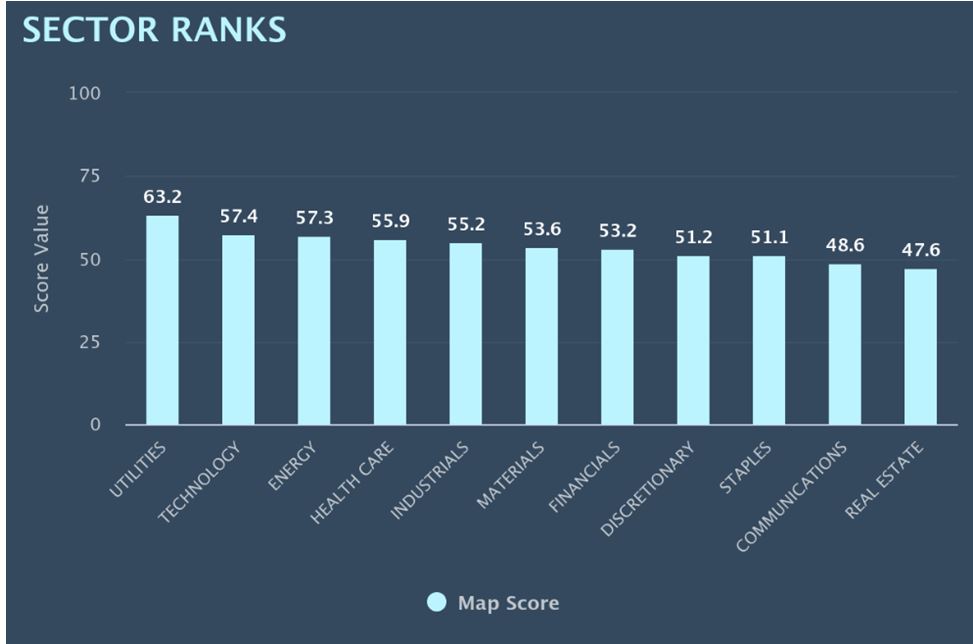
Despite recent pressure, technology still sits as our second-highest ranked sector.
Graphs are for illustrative and discussion purposes only. Please read important disclosures at the end of this commentary.
That is encouraging, but what bothers me is that Industrials, Financials, and Discretionary have slipped in the rankings. When those three rise with technology, they are engines for a broad bull-market. Lately we have seen outflow spikes in Technology, Energy, Health Care, Industrials, Materials, Discretionary, Staples, Communications, and Real Estate.
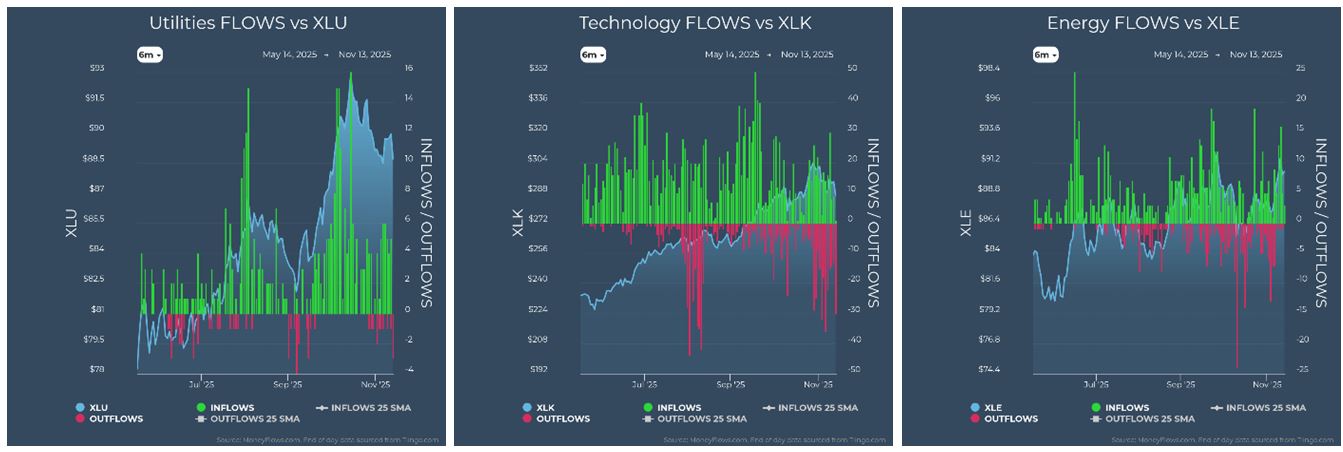
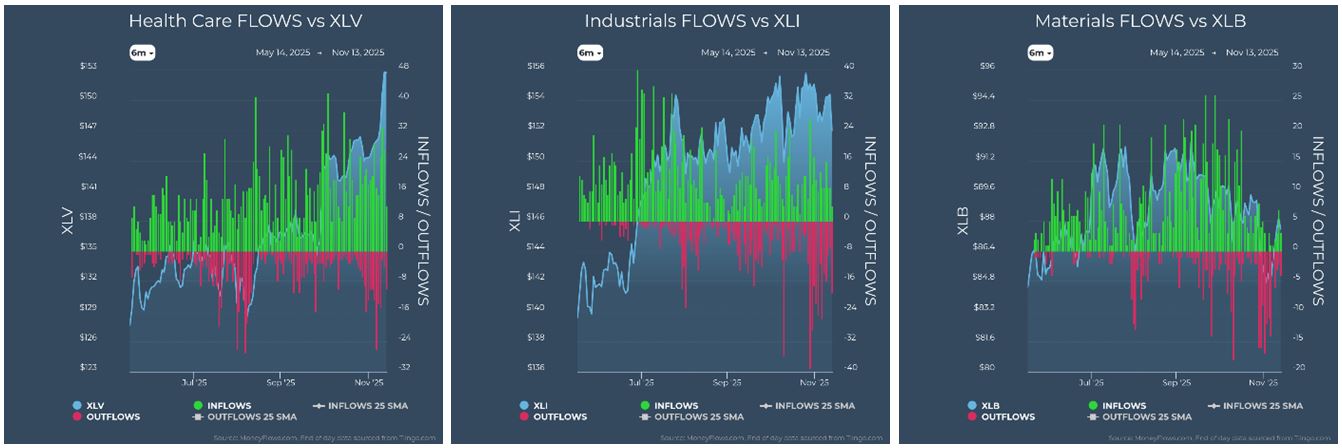
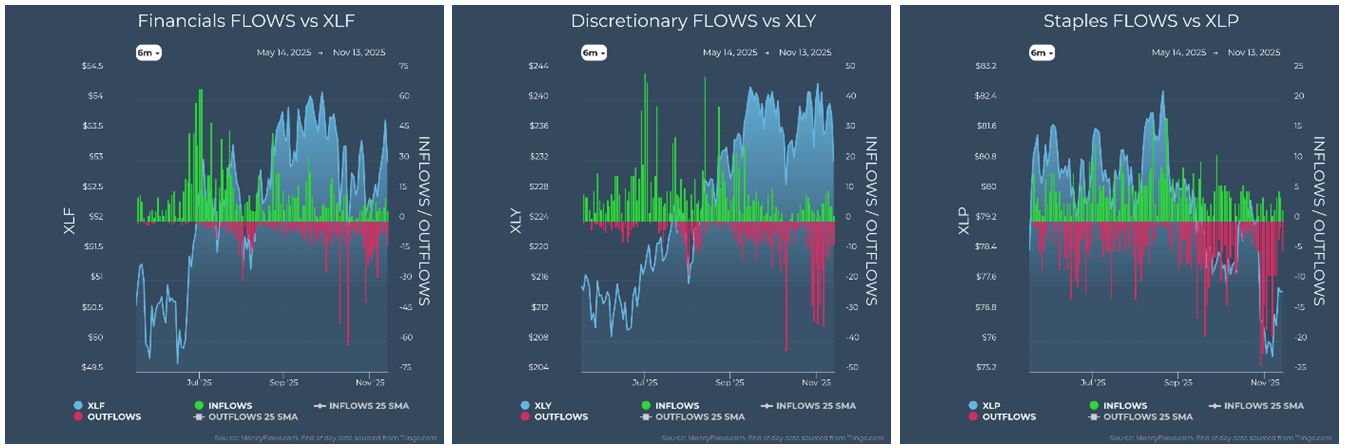
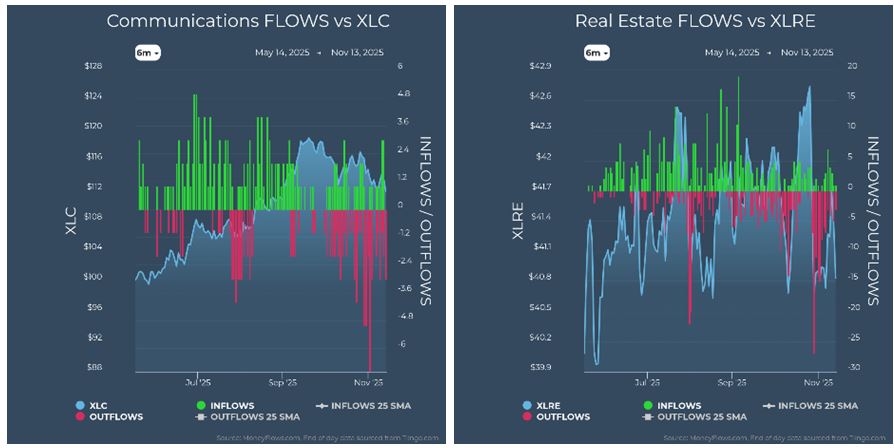
Graphs are for illustrative and discussion purposes only. Please read important disclosures at the end of this commentary.
This prompts some concerns: Are we near a sudden death of the bull-market? Is a new bear-market coming soon? No one knows for certain, but I see a pull-back, not a bear-market. Maybe this pull-back turns into a broader correction, but we should not forget the run we had. From April lows, SPY climbed 39% and QQQ surged 5%. After such a stretch, a moderate pull-back is completely understandable.
Earnings remain stellar. Other tail-winds are still in place, despite softening sentiment. Rates are falling, with more cuts on the horizon. Lower rates and lower taxes are powerful boosts to business profits, even without sales and earnings growth, yet we also have some of the strongest earnings results in four-years.
Graphs are for illustrative and discussion purposes only. Please read important disclosures at the end of this commentary.
A six-week government shutdown is behind us. Now the uncertainty shifts to its impact. Meanwhile, new political scandals fill the headlines. It is the same cycle every time. Wall Street always climbs a wall of worry, yet when you look under the hood, the core metrics remain solid. The climate is not perfect, but from an earnings and growth stand-point, it does not get much better. When market noise intensifies, I get to a quiet place and listen to the internal signals. And that brings me back to the anechoic-chamber. When everything around you gets louder, clarity often comes from tuning into the quiet, steady inner-strength.
As Seneca wrote, “True tranquility comes not from the silence around us, but from the calm within us.”
All content above represents the opinion of Jason Bodner of Navellier & Associates, Inc.
Also In This Issue
A Look Ahead by Louis Navellier
The Government Shutdown Ends: What’s Next – More Spending?
Income Mail by Bryan Perry
Examining the “Space Race” Investment Theme For 2026
Growth Mail by Gary Alexander
Business Magazines Are Worth the Cost – As Contrarian Indicators
Global Mail by Ivan Martchev
Rotation Alone Does Not Explain Recent Market Volatility
Sector Spotlight by Jason Bodner
Turn Up the Quiet…In Order to Hear the Market’s Heartbeat
View Full Archive
Read Past Issues Here

Jason Bodner
MARKETMAIL EDITOR FOR SECTOR SPOTLIGHT
Jason Bodner writes Sector Spotlight in the weekly Marketmail publication and has authored several white papers for the company. He is also Co-Founder of Macro Analytics for Professionals which produces proprietary equity accumulation and distribution research for its clients. Previously, Mr. Bodner served as Director of European Equity Derivatives for Cantor Fitzgerald Europe in London, then moved to the role of Head of Equity Derivatives North America for the same company in New York. He also served as S.V.P. Equity Derivatives for Jefferies, LLC. He received a B.S. in business administration in 1996, with honors, from Skidmore College as a member of the Periclean Honors Society. All content of “Sector Spotlight” represents the opinion of Jason Bodner
Important Disclosures:
Jason Bodner is a co-founder and co-owner of Mapsignals. Mr. Bodner is an independent contractor who is occasionally hired by Navellier & Associates to write an article and or provide opinions for possible use in articles that appear in Navellier & Associates weekly Market Mail. Mr. Bodner is not employed or affiliated with Louis Navellier, Navellier & Associates, Inc., or any other Navellier owned entity. The opinions and statements made here are those of Mr. Bodner and not necessarily those of any other persons or entities. This is not an endorsement, or solicitation or testimonial or investment advice regarding the BMI Index or any statements or recommendations or analysis in the article or the BMI Index or Mapsignals or its products or strategies.
Although information in these reports has been obtained from and is based upon sources that Navellier believes to be reliable, Navellier does not guarantee its accuracy and it may be incomplete or condensed. All opinions and estimates constitute Navellier’s judgment as of the date the report was created and are subject to change without notice. These reports are for informational purposes only and are not a solicitation for the purchase or sale of a security. Any decision to purchase securities mentioned in these reports must take into account existing public information on such securities or any registered prospectus.To the extent permitted by law, neither Navellier & Associates, Inc., nor any of its affiliates, agents, or service providers assumes any liability or responsibility nor owes any duty of care for any consequences of any person acting or refraining to act in reliance on the information contained in this communication or for any decision based on it.
Past performance is no indication of future results. Investment in securities involves significant risk and has the potential for partial or complete loss of funds invested. It should not be assumed that any securities recommendations made by Navellier. in the future will be profitable or equal the performance of securities made in this report. Dividend payments are not guaranteed. The amount of a dividend payment, if any, can vary over time and issuers may reduce dividends paid on securities in the event of a recession or adverse event affecting a specific industry or issuer.
None of the stock information, data, and company information presented herein constitutes a recommendation by Navellier or a solicitation to buy or sell any securities. Any specific securities identified and described do not represent all of the securities purchased, sold, or recommended for advisory clients. The holdings identified do not represent all of the securities purchased, sold, or recommended for advisory clients and the reader should not assume that investments in the securities identified and discussed were or will be profitable.
Information presented is general information that does not take into account your individual circumstances, financial situation, or needs, nor does it present a personalized recommendation to you. Individual stocks presented may not be suitable for every investor. Investment in securities involves significant risk and has the potential for partial or complete loss of funds invested. Investment in fixed income securities has the potential for the investment return and principal value of an investment to fluctuate so that an investor’s holdings, when redeemed, may be worth less than their original cost.
One cannot invest directly in an index. Index is unmanaged and index performance does not reflect deduction of fees, expenses, or taxes. Presentation of Index data does not reflect a belief by Navellier that any stock index constitutes an investment alternative to any Navellier equity strategy or is necessarily comparable to such strategies. Among the most important differences between the Indices and Navellier strategies are that the Navellier equity strategies may (1) incur material management fees, (2) concentrate its investments in relatively few stocks, industries, or sectors, (3) have significantly greater trading activity and related costs, and (4) be significantly more or less volatile than the Indices.
ETF Risk: We may invest in exchange traded funds (“ETFs”) and some of our investment strategies are generally fully invested in ETFs. Like traditional mutual funds, ETFs charge asset-based fees, but they generally do not charge initial sales charges or redemption fees and investors typically pay only customary brokerage fees to buy and sell ETF shares. The fees and costs charged by ETFs held in client accounts will not be deducted from the compensation the client pays Navellier. ETF prices can fluctuate up or down, and a client account could lose money investing in an ETF if the prices of the securities owned by the ETF go down. ETFs are subject to additional risks:
- ETF shares may trade above or below their net asset value;
- An active trading market for an ETF’s shares may not develop or be maintained;
- The value of an ETF may be more volatile than the underlying portfolio of securities the ETF is designed to track;
- The cost of owning shares of the ETF may exceed those a client would incur by directly investing in the underlying securities and;
- Trading of an ETF’s shares may be halted if the listing exchange’s officials deem it appropriate, the shares are delisted from the exchange, or the activation of market-wide “circuit breakers” (which are tied to large decreases in stock prices) halts stock trading generally.
Grader Disclosures: Investment in equity strategies involves substantial risk and has the potential for partial or complete loss of funds invested. The sample portfolio and any accompanying charts are for informational purposes only and are not to be construed as a solicitation to buy or sell any financial instrument and should not be relied upon as the sole factor in an investment making decision. As a matter of normal and important disclosures to you, as a potential investor, please consider the following: The performance presented is not based on any actual securities trading, portfolio, or accounts, and the reported performance of the A, B, C, D, and F portfolios (collectively the “model portfolios”) should be considered mere “paper” or pro forma performance results based on Navellier’s research.
Investors evaluating any of Navellier & Associates, Inc.’s, (or its affiliates’) Investment Products must not use any information presented here, including the performance figures of the model portfolios, in their evaluation of any Navellier Investment Products. Navellier Investment Products include the firm’s mutual funds and managed accounts. The model portfolios, charts, and other information presented do not represent actual funded trades and are not actual funded portfolios. There are material differences between Navellier Investment Products’ portfolios and the model portfolios, research, and performance figures presented here. The model portfolios and the research results (1) may contain stocks or ETFs that are illiquid and difficult to trade; (2) may contain stock or ETF holdings materially different from actual funded Navellier Investment Product portfolios; (3) include the reinvestment of all dividends and other earnings, estimated trading costs, commissions, or management fees; and, (4) may not reflect prices obtained in an actual funded Navellier Investment Product portfolio. For these and other reasons, the reported performances of model portfolios do not reflect the performance results of Navellier’s actually funded and traded Investment Products. In most cases, Navellier’s Investment Products have materially lower performance results than the performances of the model portfolios presented.
This report contains statements that are, or may be considered to be, forward-looking statements. All statements that are not historical facts, including statements about our beliefs or expectations, are “forward-looking statements” within the meaning of The U.S. Private Securities Litigation Reform Act of 1995. These statements may be identified by such forward-looking terminology as “expect,” “estimate,” “plan,” “intend,” “believe,” “anticipate,” “may,” “will,” “should,” “could,” “continue,” “project,” or similar statements or variations of such terms. Our forward-looking statements are based on a series of expectations, assumptions, and projections, are not guarantees of future results or performance, and involve substantial risks and uncertainty as described in Form ADV Part 2A of our filing with the Securities and Exchange Commission (SEC), which is available at www.adviserinfo.sec.gov or by requesting a copy by emailing info@navellier.com. All of our forward-looking statements are as of the date of this report only. We can give no assurance that such expectations or forward-looking statements will prove to be correct. Actual results may differ materially. You are urged to carefully consider all such factors.
FEDERAL TAX ADVICE DISCLAIMER: As required by U.S. Treasury Regulations, you are informed that, to the extent this presentation includes any federal tax advice, the presentation is not written by Navellier to be used, and cannot be used, for the purpose of avoiding federal tax penalties. Navellier does not advise on any income tax requirements or issues. Use of any information presented by Navellier is for general information only and does not represent tax advice either express or implied. You are encouraged to seek professional tax advice for income tax questions and assistance.
IMPORTANT NEWSLETTER DISCLOSURE:The hypothetical performance results for investment newsletters that are authored or edited by Louis Navellier, including Louis Navellier’s Growth Investor, Louis Navellier’s Breakthrough Stocks, Louis Navellier’s Accelerated Profits, and Louis Navellier’s Platinum Club, are not based on any actual securities trading, portfolio, or accounts, and the newsletters’ reported hypothetical performances should be considered mere “paper” or proforma hypothetical performance results and are not actual performance of real world trades. Navellier & Associates, Inc. does not have any relation to or affiliation with the owner of these newsletters. There are material differences between Navellier Investment Products’ portfolios and the InvestorPlace Media, LLC newsletter portfolios authored by Louis Navellier. The InvestorPlace Media, LLC newsletters contain hypothetical performance that do not include transaction costs, advisory fees, or other fees a client might incur if actual investments and trades were being made by an investor. As a result, newsletter performance should not be used to evaluate Navellier Investment services which are separate and different from the newsletters. The owner of the newsletters is InvestorPlace Media, LLC and any questions concerning the newsletters, including any newsletter advertising or hypothetical Newsletter performance claims, (which are calculated solely by Investor Place Media and not Navellier) should be referred to InvestorPlace Media, LLC at (800) 718-8289.
Please note that Navellier & Associates and the Navellier Private Client Group are managed completely independent of the newsletters owned and published by InvestorPlace Media, LLC and written and edited by Louis Navellier, and investment performance of the newsletters should in no way be considered indicative of potential future investment performance for any Navellier & Associates separately managed account portfolio. Potential investors should consult with their financial advisor before investing in any Navellier Investment Product.
Navellier claims compliance with Global Investment Performance Standards (GIPS). To receive a complete list and descriptions of Navellier’s composites and/or a presentation that adheres to the GIPS standards, please contact Navellier or click here. It should not be assumed that any securities recommendations made by Navellier & Associates, Inc. in the future will be profitable or equal the performance of securities made in this report.
FactSet Disclosure: Navellier does not independently calculate the statistical information included in the attached report. The calculation and the information are provided by FactSet, a company not related to Navellier. Although information contained in the report has been obtained from FactSet and is based on sources Navellier believes to be reliable, Navellier does not guarantee its accuracy, and it may be incomplete or condensed. The report and the related FactSet sourced information are provided on an “as is” basis. The user assumes the entire risk of any use made of this information. Investors should consider the report as only a single factor in making their investment decision. The report is for informational purposes only and is not intended as an offer or solicitation for the purchase or sale of a security. FactSet sourced information is the exclusive property of FactSet. Without prior written permission of FactSet, this information may not be reproduced, disseminated or used to create any financial products. All indices are unmanaged and performance of the indices include reinvestment of dividends and interest income, unless otherwise noted, are not illustrative of any particular investment and an investment cannot be made in any index. Past performance is no guarantee of future results.