by Jason Bodner
November 4, 2025
I saw Willy Wonka and the Chocolate Factory as a kid. There’s a scene where Charlie’s grandfather and he try a super-fizzy body-lifting drink. It works, and as they float toward the ceiling, they get dangerously close to the fan. The sharp blades spell doom – until they realize that if they burp, they’ll stop rising.
Sound familiar? Stocks have been floating higher in ways that make many investors nervous. We know it can’t last forever, and the higher we go without a “big burp,” the harder the fall. But guessing outcomes is usually a losing game, while studying and reacting to data lets us adapt when things turn unpredictable.
Some Wonka trivia: Gene Wilder only agreed to play Wonka if he could limp out and then suddenly do a somersault, to show his unpredictability. That’s how we should approach markets – expect surprises.
These days, many investors worry that we’ve floated too high, too fast, but what does the data say?
It’s true that the yellow-flags are piling up. There are cracks in the market which could cause concern, but my approach is to keep emotion out of investing and focus on the data. I believe that this outlook creates better decisions, so before we get carried away, let’s break down and analyze what the data is telling us.
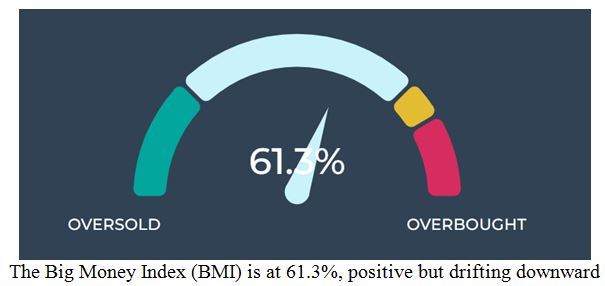
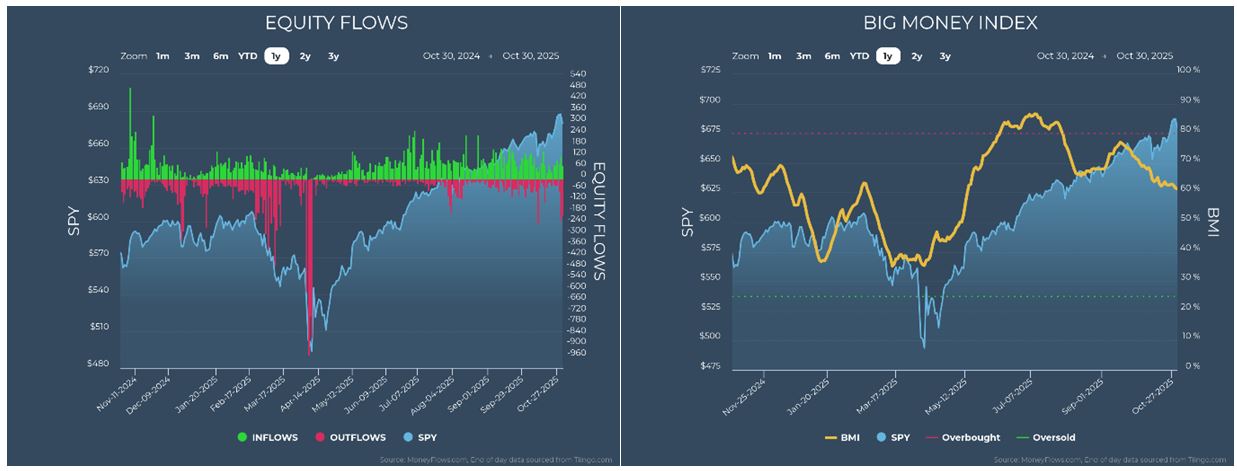
The Big Money Index continues to drift lower. After a bout of fresh outflows, the index came under new pressure. This is because it’s a 25-day moving average of net new inflows. If one day sees 75-inflows out of 100-signals, that day reads 75%. We average the last 25-days to gauge overall inflows or outflows.
The recent BMI decline comes from some weak inflow signals plus a sudden spike in outflows.
Graphs are for illustrative and discussion purposes only. Please read important disclosures at the end of this commentary.
Before addressing whether this trend will continue, let’s keep breaking down the data.
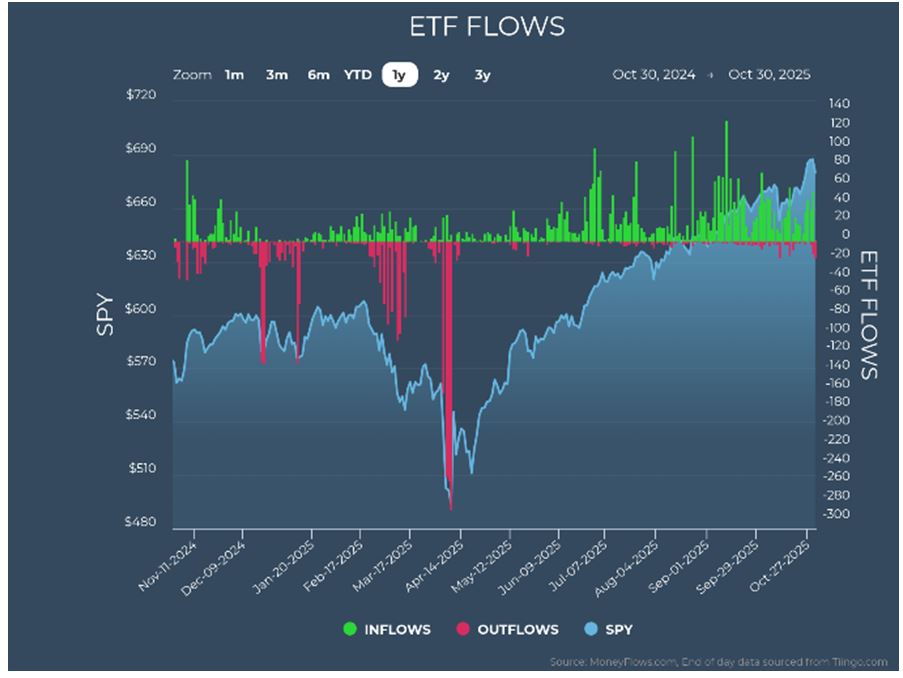
ETFs haven’t succumbed to major outflows yet, though we saw a slight uptick. On October 20, there were 18 ETF outflows – tied for second most (with October 10) since April 8, which saw 288 ETF outflows – the most extreme ETF outflow day in market data since 1990. Compared to that, 18 isn’t even a sniffle.
Graphs are for illustrative and discussion purposes only. Please read important disclosures at the end of this commentary.
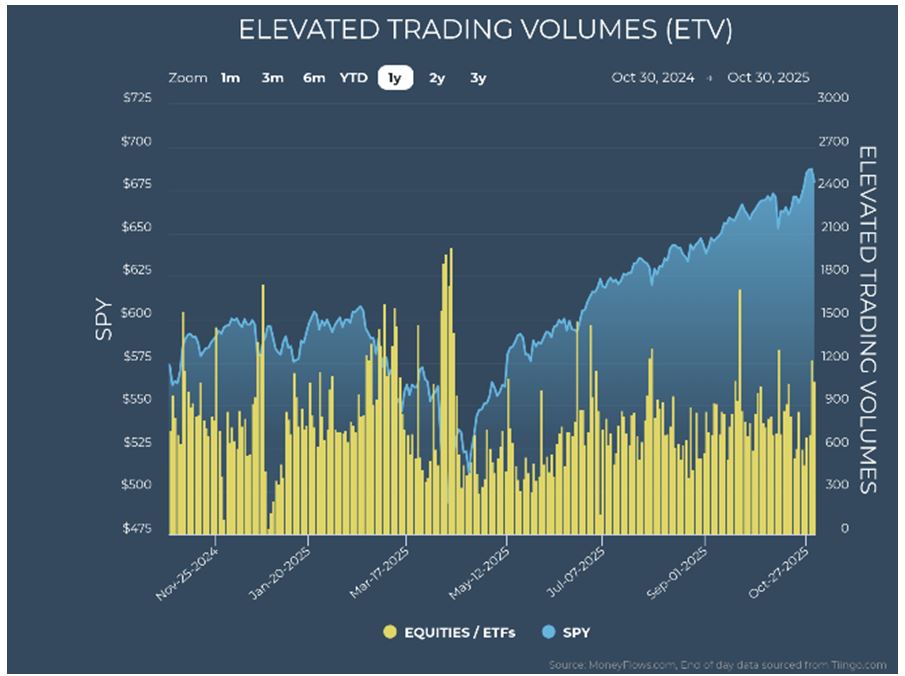
Still, that’s another yellow-flag with elevated trading volumes amid outflows is another yellow-flag:
Graphs are for illustrative and discussion purposes only. Please read important disclosures at the end of this commentary.
Last week (through Thursday), outflows exceeded inflows by 1.4-to-1. In simple terms, an outflow occurs when a stock breaks below an interim 11-week low on heavy volume and volatility. (The full algorithm is more detailed, but that’s the essence). Companies between $5 and $50-billion showed the most outflows:
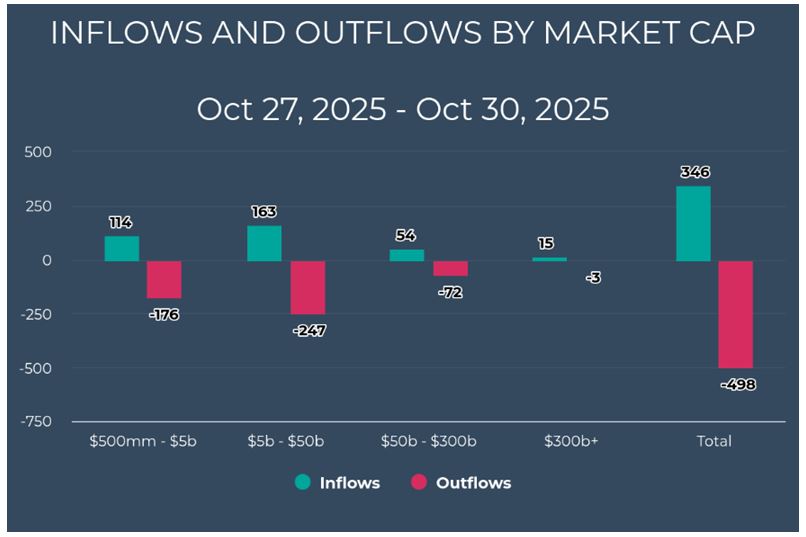
Graphs are for illustrative and discussion purposes only. Please read important disclosures at the end of this commentary.
Sometimes there’s profit-taking before a new leg higher. Other times it deepens, sentiment sours, and markets correct. Which is it this time? Before answering, let’s keep digging deeper into the data.
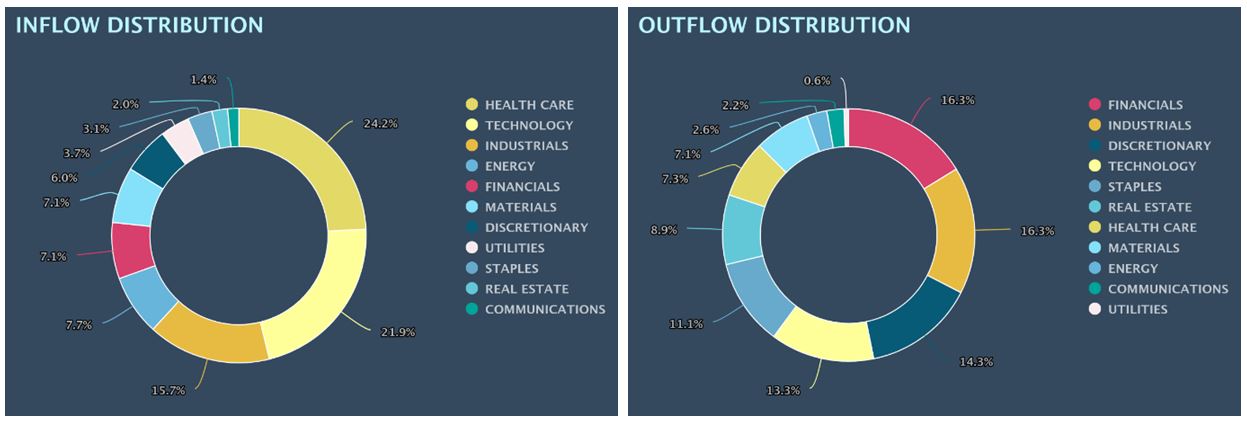
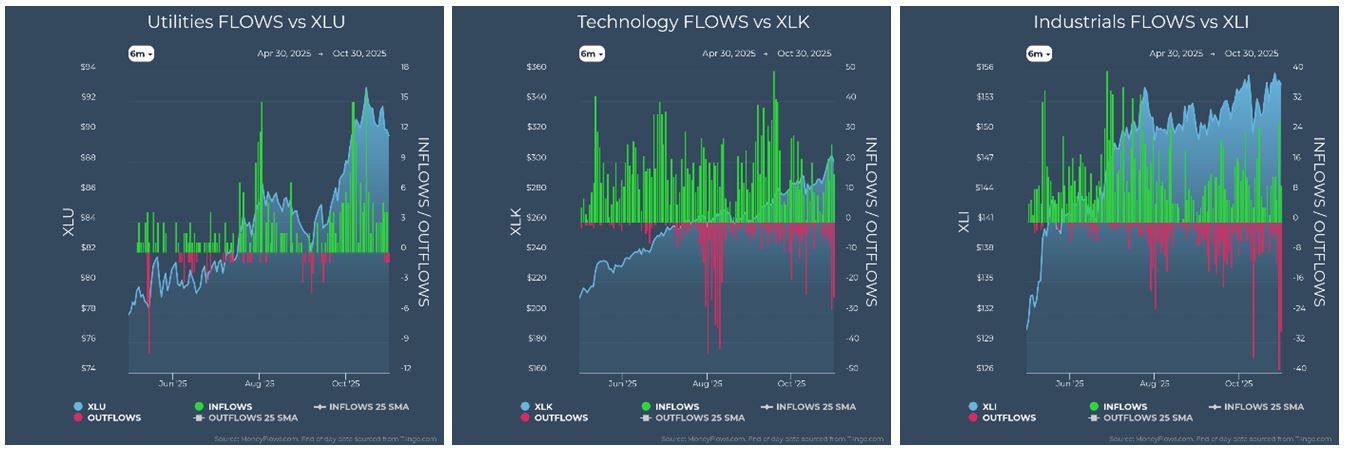
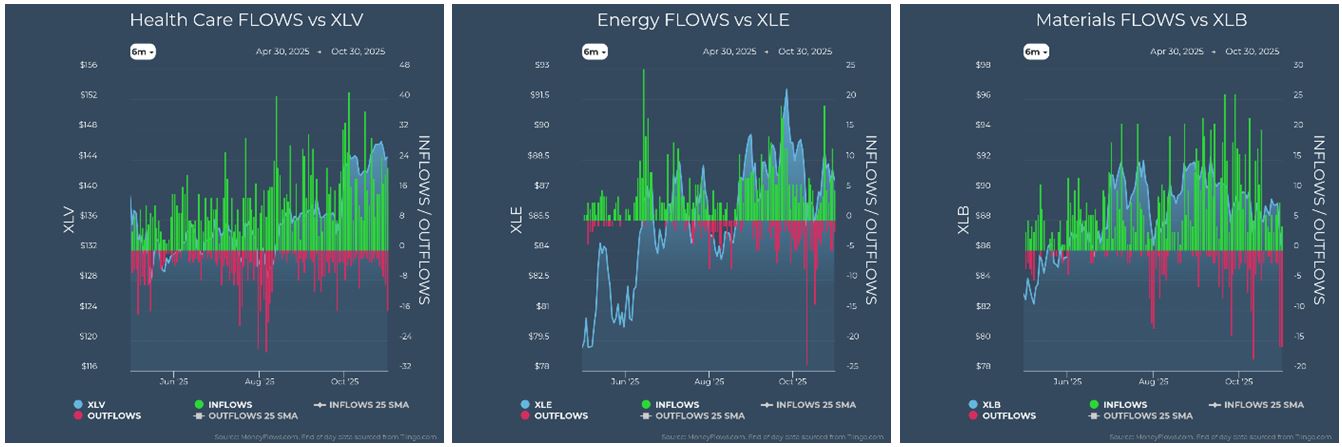
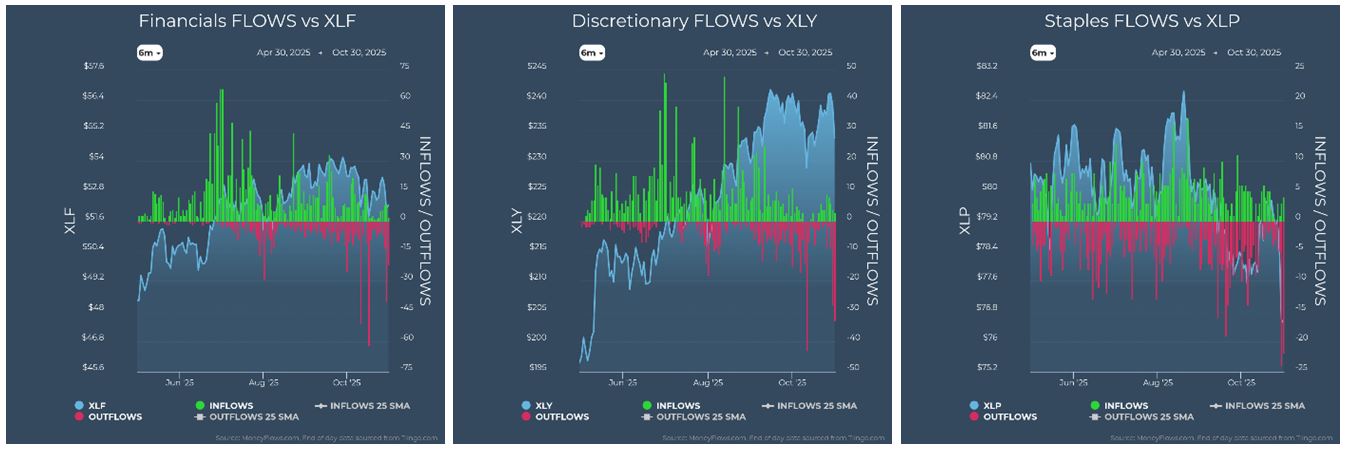
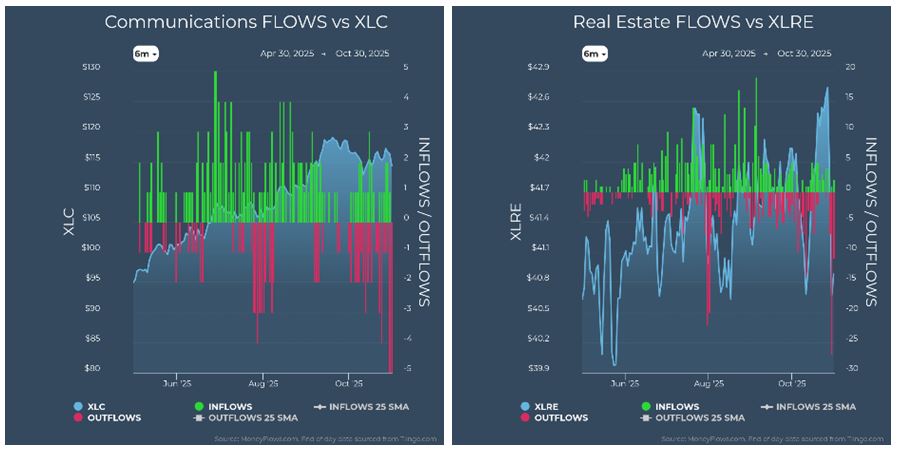
Outflows are concentrated in Technology, Discretionary, Industrials, and Financials—growth-heavy sectors that often power bull-markets. They’ve been trading at or near highs for a long time, so cooling makes sense.
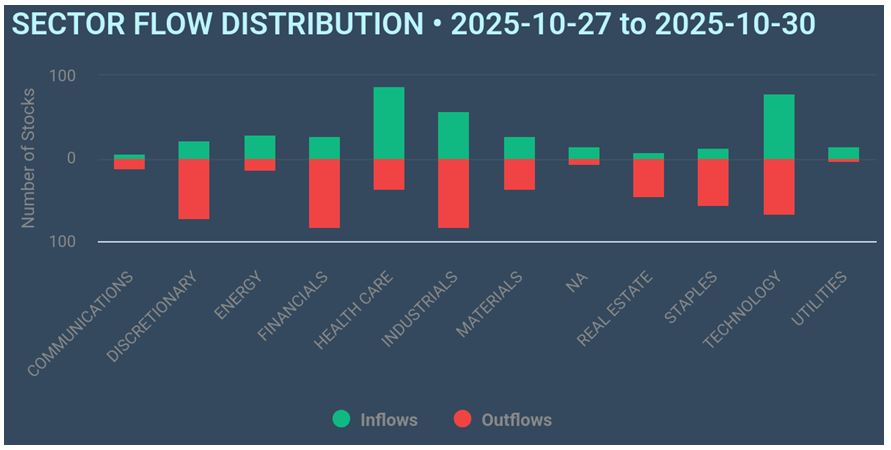
Graphs are for illustrative and discussion purposes only. Please read important disclosures at the end of this commentary.
On the positive side of the ledger, technology shares also saw the most inflows, along with Health Care stocks.
From a sector-ranking perspective, not much has changed: The signals remain mixed. Utilities still rank at the top, but not because defensive investors are hiding out. Speculation that AI will demand more power continues to drive capital into the sector. Technology and Industrials follow, which is bullish since they are growth oriented. Discretionary, however, is disappointing, in eighth-place. I prefer to see Discretionary lead the list, as that signals a strong consumer, but when inflation runs hotter, discretionary can fade.
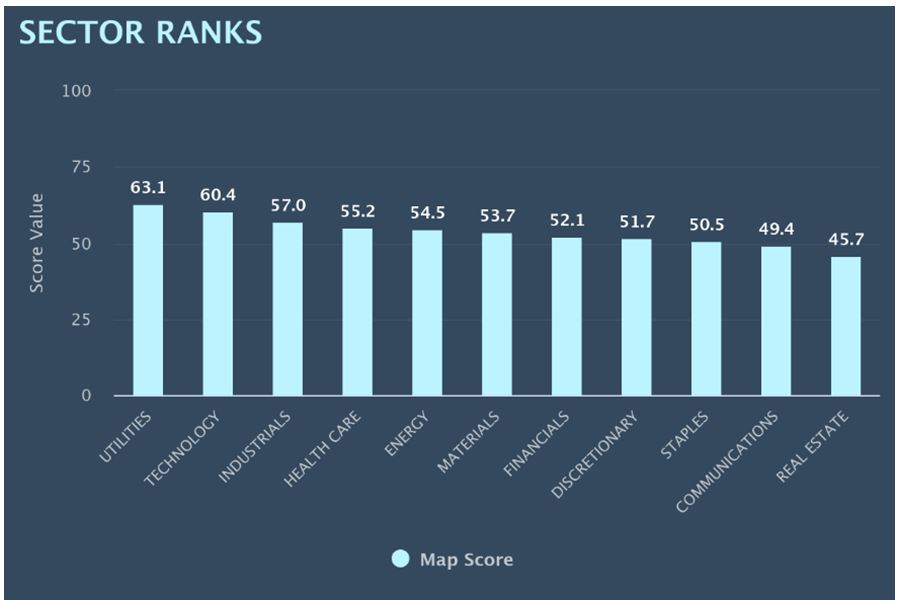
Graphs are for illustrative and discussion purposes only. Please read important disclosures at the end of this commentary.
Here’s another mixed signal: nine of the S&P’s 11-sectors saw elevated outflows on October 29 and 30. That could mark the start of a broader pullback. If investors view November as a good time to take profits, we may see a short-term dip in equities lasting anywhere from a day to a few-weeks.
Graphs are for illustrative and discussion purposes only. Please read important disclosures at the end of this commentary.
On the plus side, the last time the same thing happened was just a few weeks ago on October 10th. We saw very similar distribution across nearly all sectors. The SPY went on to rally 5.3% from there.
Now for the good news:
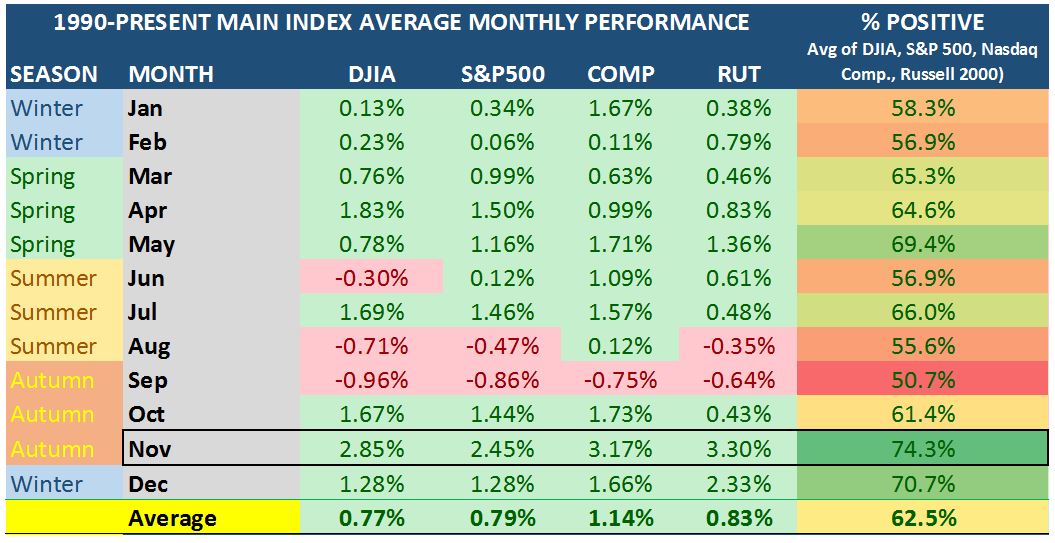
- November is historically the strongest month, with 74% of all Novembers since 1990 being positive with an average return of 2.54% on the S&P 500 and even better on the NASDAQ and Russell 2000.
Graphs are for illustrative and discussion purposes only. Please read important disclosures at the end of this commentary.
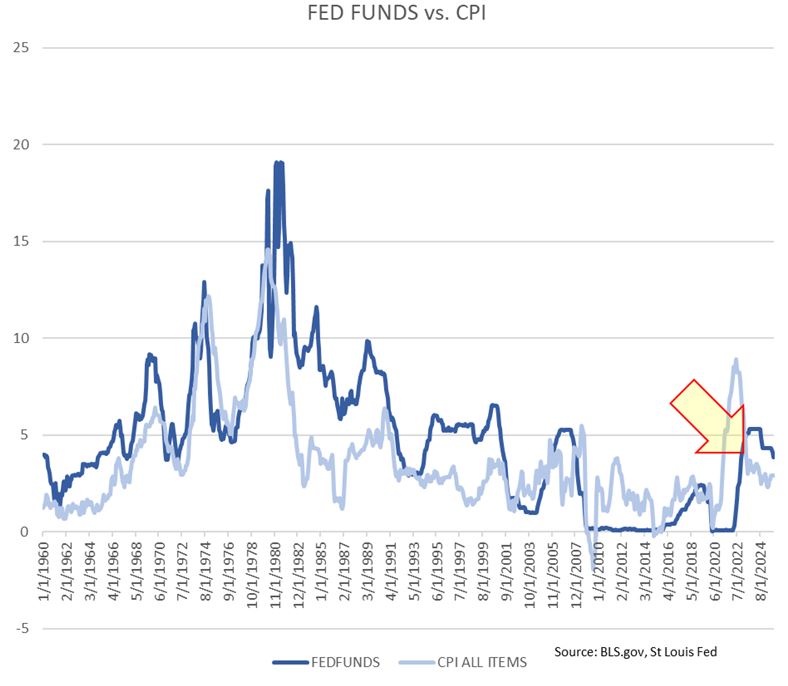
- We just got another rate cut – albeit with a split decision. Rates typically don’t get cut and then suddenly stop or even rise. All indications say we will get continued rate cuts through next year.
- Inflation, while ticking up to 3%, is still well below the 65-year average of 3.75%.
Graphs are for illustrative and discussion purposes only. Please read important disclosures at the end of this commentary.
- Lower taxes remain a tailwind, due to new provisions in the Big Beautiful Bill.
- Recent trade talks are productive, as Trump struck deals with Asian partners and made meaningful progress with China. The U.S. reduced tariffs and reopened chip sales, while China agreed to buy soybeans and American energy, crack down on fentanyl, and pause rare-earth export controls.
- Earnings also impress. FactSet shows that 64% of the S&P 500 companies have reported as of October 31, with 83% beating EPS estimates and 79% beating revenue estimates. Year-over-year earnings growth is 10.7% — the ninth-straight positive quarter and fourth-straight double-digit gain.
- On valuations, the forward P/E for the S&P is 22.9, above the 5-year (19.9) and 10-year (18.6) averages. That raises some eyebrows, but remember that these P/E multiples can normalize by earnings growth, not just by falling prices. With strong fundamentals, I favor the latter.
All told, we’re set for a seasonally strong finish to the year, even with a few air-pockets along the way. The best defense remains a great offense – own excellent growth stocks with strong sales, steady earnings, and consistent institutional support behind them. If the data shifts, it means more opportunity.
As Lao Tzu wrote, “Those who flow as life flows know they need no other force.”
All content above represents the opinion of Jason Bodner of Navellier & Associates, Inc.
Also In This Issue
A Look Ahead by Louis Navellier
Companies Boost Earnings…and Cut Jobs
Income Mail by Bryan Perry
Opaque Jobs Data Could Trigger More Fed Rate Cuts
Growth Mail by Gary Alexander
Is Wall Street’s Investment Clock Broken?
Global Mail by Ivan Martchev
Geopolitics are About to Come to the Fore in the Next Two Weeks
Sector Spotlight by Jason Bodner
What’s Elevating the Stock Market to New Highs?
View Full Archive
Read Past Issues Here

Jason Bodner
MARKETMAIL EDITOR FOR SECTOR SPOTLIGHT
Jason Bodner writes Sector Spotlight in the weekly Marketmail publication and has authored several white papers for the company. He is also Co-Founder of Macro Analytics for Professionals which produces proprietary equity accumulation and distribution research for its clients. Previously, Mr. Bodner served as Director of European Equity Derivatives for Cantor Fitzgerald Europe in London, then moved to the role of Head of Equity Derivatives North America for the same company in New York. He also served as S.V.P. Equity Derivatives for Jefferies, LLC. He received a B.S. in business administration in 1996, with honors, from Skidmore College as a member of the Periclean Honors Society. All content of “Sector Spotlight” represents the opinion of Jason Bodner
Important Disclosures:
Jason Bodner is a co-founder and co-owner of Mapsignals. Mr. Bodner is an independent contractor who is occasionally hired by Navellier & Associates to write an article and or provide opinions for possible use in articles that appear in Navellier & Associates weekly Market Mail. Mr. Bodner is not employed or affiliated with Louis Navellier, Navellier & Associates, Inc., or any other Navellier owned entity. The opinions and statements made here are those of Mr. Bodner and not necessarily those of any other persons or entities. This is not an endorsement, or solicitation or testimonial or investment advice regarding the BMI Index or any statements or recommendations or analysis in the article or the BMI Index or Mapsignals or its products or strategies.
Although information in these reports has been obtained from and is based upon sources that Navellier believes to be reliable, Navellier does not guarantee its accuracy and it may be incomplete or condensed. All opinions and estimates constitute Navellier’s judgment as of the date the report was created and are subject to change without notice. These reports are for informational purposes only and are not a solicitation for the purchase or sale of a security. Any decision to purchase securities mentioned in these reports must take into account existing public information on such securities or any registered prospectus.To the extent permitted by law, neither Navellier & Associates, Inc., nor any of its affiliates, agents, or service providers assumes any liability or responsibility nor owes any duty of care for any consequences of any person acting or refraining to act in reliance on the information contained in this communication or for any decision based on it.
Past performance is no indication of future results. Investment in securities involves significant risk and has the potential for partial or complete loss of funds invested. It should not be assumed that any securities recommendations made by Navellier. in the future will be profitable or equal the performance of securities made in this report. Dividend payments are not guaranteed. The amount of a dividend payment, if any, can vary over time and issuers may reduce dividends paid on securities in the event of a recession or adverse event affecting a specific industry or issuer.
None of the stock information, data, and company information presented herein constitutes a recommendation by Navellier or a solicitation to buy or sell any securities. Any specific securities identified and described do not represent all of the securities purchased, sold, or recommended for advisory clients. The holdings identified do not represent all of the securities purchased, sold, or recommended for advisory clients and the reader should not assume that investments in the securities identified and discussed were or will be profitable.
Information presented is general information that does not take into account your individual circumstances, financial situation, or needs, nor does it present a personalized recommendation to you. Individual stocks presented may not be suitable for every investor. Investment in securities involves significant risk and has the potential for partial or complete loss of funds invested. Investment in fixed income securities has the potential for the investment return and principal value of an investment to fluctuate so that an investor’s holdings, when redeemed, may be worth less than their original cost.
One cannot invest directly in an index. Index is unmanaged and index performance does not reflect deduction of fees, expenses, or taxes. Presentation of Index data does not reflect a belief by Navellier that any stock index constitutes an investment alternative to any Navellier equity strategy or is necessarily comparable to such strategies. Among the most important differences between the Indices and Navellier strategies are that the Navellier equity strategies may (1) incur material management fees, (2) concentrate its investments in relatively few stocks, industries, or sectors, (3) have significantly greater trading activity and related costs, and (4) be significantly more or less volatile than the Indices.
ETF Risk: We may invest in exchange traded funds (“ETFs”) and some of our investment strategies are generally fully invested in ETFs. Like traditional mutual funds, ETFs charge asset-based fees, but they generally do not charge initial sales charges or redemption fees and investors typically pay only customary brokerage fees to buy and sell ETF shares. The fees and costs charged by ETFs held in client accounts will not be deducted from the compensation the client pays Navellier. ETF prices can fluctuate up or down, and a client account could lose money investing in an ETF if the prices of the securities owned by the ETF go down. ETFs are subject to additional risks:
- ETF shares may trade above or below their net asset value;
- An active trading market for an ETF’s shares may not develop or be maintained;
- The value of an ETF may be more volatile than the underlying portfolio of securities the ETF is designed to track;
- The cost of owning shares of the ETF may exceed those a client would incur by directly investing in the underlying securities and;
- Trading of an ETF’s shares may be halted if the listing exchange’s officials deem it appropriate, the shares are delisted from the exchange, or the activation of market-wide “circuit breakers” (which are tied to large decreases in stock prices) halts stock trading generally.
Grader Disclosures: Investment in equity strategies involves substantial risk and has the potential for partial or complete loss of funds invested. The sample portfolio and any accompanying charts are for informational purposes only and are not to be construed as a solicitation to buy or sell any financial instrument and should not be relied upon as the sole factor in an investment making decision. As a matter of normal and important disclosures to you, as a potential investor, please consider the following: The performance presented is not based on any actual securities trading, portfolio, or accounts, and the reported performance of the A, B, C, D, and F portfolios (collectively the “model portfolios”) should be considered mere “paper” or pro forma performance results based on Navellier’s research.
Investors evaluating any of Navellier & Associates, Inc.’s, (or its affiliates’) Investment Products must not use any information presented here, including the performance figures of the model portfolios, in their evaluation of any Navellier Investment Products. Navellier Investment Products include the firm’s mutual funds and managed accounts. The model portfolios, charts, and other information presented do not represent actual funded trades and are not actual funded portfolios. There are material differences between Navellier Investment Products’ portfolios and the model portfolios, research, and performance figures presented here. The model portfolios and the research results (1) may contain stocks or ETFs that are illiquid and difficult to trade; (2) may contain stock or ETF holdings materially different from actual funded Navellier Investment Product portfolios; (3) include the reinvestment of all dividends and other earnings, estimated trading costs, commissions, or management fees; and, (4) may not reflect prices obtained in an actual funded Navellier Investment Product portfolio. For these and other reasons, the reported performances of model portfolios do not reflect the performance results of Navellier’s actually funded and traded Investment Products. In most cases, Navellier’s Investment Products have materially lower performance results than the performances of the model portfolios presented.
This report contains statements that are, or may be considered to be, forward-looking statements. All statements that are not historical facts, including statements about our beliefs or expectations, are “forward-looking statements” within the meaning of The U.S. Private Securities Litigation Reform Act of 1995. These statements may be identified by such forward-looking terminology as “expect,” “estimate,” “plan,” “intend,” “believe,” “anticipate,” “may,” “will,” “should,” “could,” “continue,” “project,” or similar statements or variations of such terms. Our forward-looking statements are based on a series of expectations, assumptions, and projections, are not guarantees of future results or performance, and involve substantial risks and uncertainty as described in Form ADV Part 2A of our filing with the Securities and Exchange Commission (SEC), which is available at www.adviserinfo.sec.gov or by requesting a copy by emailing info@navellier.com. All of our forward-looking statements are as of the date of this report only. We can give no assurance that such expectations or forward-looking statements will prove to be correct. Actual results may differ materially. You are urged to carefully consider all such factors.
FEDERAL TAX ADVICE DISCLAIMER: As required by U.S. Treasury Regulations, you are informed that, to the extent this presentation includes any federal tax advice, the presentation is not written by Navellier to be used, and cannot be used, for the purpose of avoiding federal tax penalties. Navellier does not advise on any income tax requirements or issues. Use of any information presented by Navellier is for general information only and does not represent tax advice either express or implied. You are encouraged to seek professional tax advice for income tax questions and assistance.
IMPORTANT NEWSLETTER DISCLOSURE:The hypothetical performance results for investment newsletters that are authored or edited by Louis Navellier, including Louis Navellier’s Growth Investor, Louis Navellier’s Breakthrough Stocks, Louis Navellier’s Accelerated Profits, and Louis Navellier’s Platinum Club, are not based on any actual securities trading, portfolio, or accounts, and the newsletters’ reported hypothetical performances should be considered mere “paper” or proforma hypothetical performance results and are not actual performance of real world trades. Navellier & Associates, Inc. does not have any relation to or affiliation with the owner of these newsletters. There are material differences between Navellier Investment Products’ portfolios and the InvestorPlace Media, LLC newsletter portfolios authored by Louis Navellier. The InvestorPlace Media, LLC newsletters contain hypothetical performance that do not include transaction costs, advisory fees, or other fees a client might incur if actual investments and trades were being made by an investor. As a result, newsletter performance should not be used to evaluate Navellier Investment services which are separate and different from the newsletters. The owner of the newsletters is InvestorPlace Media, LLC and any questions concerning the newsletters, including any newsletter advertising or hypothetical Newsletter performance claims, (which are calculated solely by Investor Place Media and not Navellier) should be referred to InvestorPlace Media, LLC at (800) 718-8289.
Please note that Navellier & Associates and the Navellier Private Client Group are managed completely independent of the newsletters owned and published by InvestorPlace Media, LLC and written and edited by Louis Navellier, and investment performance of the newsletters should in no way be considered indicative of potential future investment performance for any Navellier & Associates separately managed account portfolio. Potential investors should consult with their financial advisor before investing in any Navellier Investment Product.
Navellier claims compliance with Global Investment Performance Standards (GIPS). To receive a complete list and descriptions of Navellier’s composites and/or a presentation that adheres to the GIPS standards, please contact Navellier or click here. It should not be assumed that any securities recommendations made by Navellier & Associates, Inc. in the future will be profitable or equal the performance of securities made in this report.
FactSet Disclosure: Navellier does not independently calculate the statistical information included in the attached report. The calculation and the information are provided by FactSet, a company not related to Navellier. Although information contained in the report has been obtained from FactSet and is based on sources Navellier believes to be reliable, Navellier does not guarantee its accuracy, and it may be incomplete or condensed. The report and the related FactSet sourced information are provided on an “as is” basis. The user assumes the entire risk of any use made of this information. Investors should consider the report as only a single factor in making their investment decision. The report is for informational purposes only and is not intended as an offer or solicitation for the purchase or sale of a security. FactSet sourced information is the exclusive property of FactSet. Without prior written permission of FactSet, this information may not be reproduced, disseminated or used to create any financial products. All indices are unmanaged and performance of the indices include reinvestment of dividends and interest income, unless otherwise noted, are not illustrative of any particular investment and an investment cannot be made in any index. Past performance is no guarantee of future results.