by Gary Alexander
November 4, 2025
With Daylight Savings Time now dead and buried – may it never rise again – we are back on natural time, when sunrises and sunsets happen in real (not artificial) time. But as we set our multiple clocks and watches back an hour – just as we enter the market’s best historical six-months – it might be a good time to ask why some market timing gurus try to convince us that we should divide the year into two-halves, with May to October being “leave the market” time, and November to April being “market growth time.”
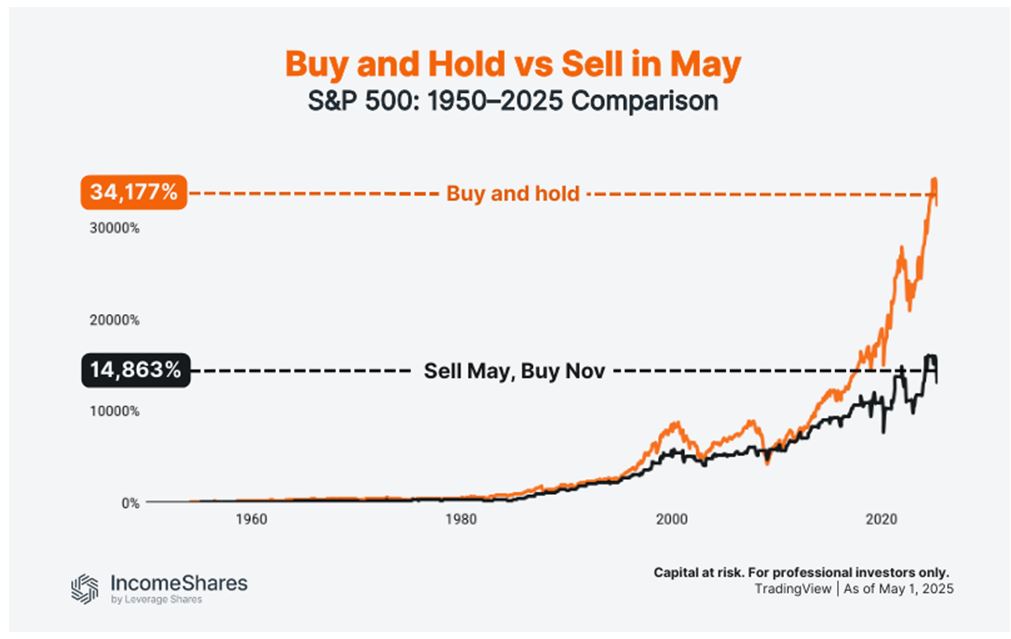
I’m referring to the longtime maxim advising us to “Sell in May and Go Away,” since over 90% of all the market’s gains since 1950 came from November 1 to April 30, with most of the risk in May to October.
This year, however, the opposite happened. Last November to April lost money, with March and April especially gut-wrenching, while every month from May to October was up – even August and September.

So, if you followed the old rule and held stocks from November 1, 2024, to April 30, 2025, you lost an average 3% in the four-major indexes. Then, if you sold on May 1st, you missed gains averaging over 25%. As I council here in spring, “Don’t sell in May, or Go Away.” This old trick doesn’t work anymore
There are many other problems with this strategy – like figuring and paying short-term capital gains taxes, plus commissions and other transactional frictions. You also miss the gains that come in those six-warmer months. Historically, there is a basis for “Sell in May” in tax-free accounts, but that is history – not current events. In the 75-years since 1950, we’ve seen 148-fold gains in the S&P 500 in the six-cold months (November-April), with only about 2% annual gains in the six-warmer months (May-October).
Graphs are for illustrative and discussion purposes only. Please read important disclosures at the end of this commentary.
Please notice that this chart ends “as of May 1, 2025,” so if you add the recent 22.8% gains since May 1st, the total buy-and-hold gains reach 41,965%, or about 180% more than “Sell in May and Go Away” (not counting taxes and commissions), but my main point is that what once worked well, does not work now.
Obviously, the anticipated downdraft in late summer never happened in 2025. The two worst two-month period, August and September, usually delivers a late summer slump, but this year August and September delivered a combined +5.5% in the S&P 500, +7.3% in NASDAQ and a shocking +10.1% in the Russell 2000, as stock market breadth obviously expanded from a few high-flying mega-stocks to their smaller brethren. The days are gone when you can say nearly all our gains come from six or eight-stocks.
Another common calendar maxim is that the fourth-quarter delivers more gains than the other three-quarters combined. That rule has held up well in the last few years. After an unfortunate and unfounded stock market collapse in the final-quarter of 2018 – due mainly to a tweet storm by the President against the Federal Reserve chairman (sound familiar?). Then, Chairman Powell responded by raising interest rates one or two times too many, so the market fell almost 13% in the fourth-quarter of 2018. Since then the final-quarter has been nothing but roses and lollipops for stock investors, as reflected in these gains:
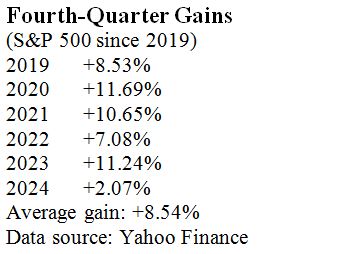
So far in the fourth-quarter, we’ve seen 2.27% gains in October, but this is no guarantee of another booming fourth-quarter. For some more solid hints about the future, we must look at the fundamentals.’
The Fundamentals Point to a Rousing Finale to 2025
Markets tend to rise in the fourth-quarter for more reasons than calendar coincidence. There are some technical reasons, ranging from portfolio rebalancing to tax planning, but the main reason is the sense of national hope we feel on entering a new year, combined with good times enjoyed in the holiday season.
In addition, here are a few fundamentals unique to this year’s closing two-months:
#1: Corporate earnings are off to their best start in four-years, according to Bloomberg
#2: President Trump’s team is negotiating favorable trade deals, most notably in Asia
#3: We will likely see three total Fed interest rate cuts in late 2025, including December
#4: Most American taxpayers and businesses will pay lower taxes under the Big Beautiful Bill
#5: There is still plenty of cash on the sidelines, available to fuel the next stock buying surge
These fundamentals are mostly new to 2025. A year ago today, when the election was still undecided, we didn’t know if the policies of Kamala Harris or Donald Trump would prevail. As a result of confusion about the future, 2024’s fourth-quarter S&P 500 rose only 2%, its weakest performance since 2018, but the market is now rising over the impact of economic policies under President Trump, not the calendar.
These calendar formulas are based on history. You can create any number of similar correlations – from election results to Super Bowl winners, or horse races or hemlines – but correlation is not causation. Just because a coin flips to heads 50-times in a row – or even 30 of 50 – that does not mean that it is “more likely” to be heads in the future. This is where some very smart (Nobel Prize winning) economists and traders stumble. Just because a currency has a narrow trading range for 20-years does not mean it will stay within that range this year. (That’s the fallacy behind Long-Term Capital Management’s big leveraged bet in 1998. They anticipated that the Russian ruble would stay in its historical trading range, but Russia devalued its ruble in August 1998, so that huge hedge fund failed and had to be bailed out by the Fed).
You hear this “rear-view mirror fallacy” all the time – in the markets, or in sports. As I write this on late Saturday, announcers on Game 7 of the World Series said that the Dodgers have a long history of losing when they trail going into the ninth-inning, which was their situation at the time. The Dodgers have won only two of 65 of their many World Series games trailing that late. That yields a 3% chance of winning, if you believe in the record of similar historical situations, but then a home run by a weak hitting infielder tied the game, then a miracle catch by a center fielder who had just entered the game, preventing a loss, then another homer by the Dodger catcher was the winning home run in the 11th in a miracle comeback.
So, don’t bet on history repeating itself. That which we fear most is least likely to happen, since we take extra caution to prevent it happening again. Today’s market does whatever it needs to do to surprise us.
All content above represents the opinion of Gary Alexander of Navellier & Associates, Inc.
Also In This Issue
A Look Ahead by Louis Navellier
Companies Boost Earnings…and Cut Jobs
Income Mail by Bryan Perry
Opaque Jobs Data Could Trigger More Fed Rate Cuts
Growth Mail by Gary Alexander
Is Wall Street’s Investment Clock Broken?
Global Mail by Ivan Martchev
Geopolitics are About to Come to the Fore in the Next Two Weeks
Sector Spotlight by Jason Bodner
What’s Elevating the Stock Market to New Highs?
View Full Archive
Read Past Issues Here
About The Author

Gary Alexander
SENIOR EDITOR
Gary Alexander has been Senior Writer at Navellier since 2009. He edits Navellier’s weekly Marketmail and writes a weekly Growth Mail column, in which he uses market history to support the case for growth stocks. For the previous 20-years before joining Navellier, he was Senior Executive Editor at InvestorPlace Media (formerly Phillips Publishing), where he worked with several leading investment analysts, including Louis Navellier (since 1997), helping launch Louis Navellier’s Blue Chip Growth and Global Growth newsletters.
Prior to that, Gary edited Wealth Magazine and Gold Newsletter and wrote various investment research reports for Jefferson Financial in New Orleans in the 1980s. He began his financial newsletter career with KCI Communications in 1980, where he served as consulting editor for Personal Finance newsletter while serving as general manager of KCI’s Alexandria House book division. Before that, he covered the economics beat for news magazines. All content of “Growth Mail” represents the opinion of Gary Alexander
Important Disclosures:
Although information in these reports has been obtained from and is based upon sources that Navellier believes to be reliable, Navellier does not guarantee its accuracy and it may be incomplete or condensed. All opinions and estimates constitute Navellier’s judgment as of the date the report was created and are subject to change without notice. These reports are for informational purposes only and are not a solicitation for the purchase or sale of a security. Any decision to purchase securities mentioned in these reports must take into account existing public information on such securities or any registered prospectus.To the extent permitted by law, neither Navellier & Associates, Inc., nor any of its affiliates, agents, or service providers assumes any liability or responsibility nor owes any duty of care for any consequences of any person acting or refraining to act in reliance on the information contained in this communication or for any decision based on it.
Past performance is no indication of future results. Investment in securities involves significant risk and has the potential for partial or complete loss of funds invested. It should not be assumed that any securities recommendations made by Navellier. in the future will be profitable or equal the performance of securities made in this report. Dividend payments are not guaranteed. The amount of a dividend payment, if any, can vary over time and issuers may reduce dividends paid on securities in the event of a recession or adverse event affecting a specific industry or issuer.
None of the stock information, data, and company information presented herein constitutes a recommendation by Navellier or a solicitation to buy or sell any securities. Any specific securities identified and described do not represent all of the securities purchased, sold, or recommended for advisory clients. The holdings identified do not represent all of the securities purchased, sold, or recommended for advisory clients and the reader should not assume that investments in the securities identified and discussed were or will be profitable.
Information presented is general information that does not take into account your individual circumstances, financial situation, or needs, nor does it present a personalized recommendation to you. Individual stocks presented may not be suitable for every investor. Investment in securities involves significant risk and has the potential for partial or complete loss of funds invested. Investment in fixed income securities has the potential for the investment return and principal value of an investment to fluctuate so that an investor’s holdings, when redeemed, may be worth less than their original cost.
One cannot invest directly in an index. Index is unmanaged and index performance does not reflect deduction of fees, expenses, or taxes. Presentation of Index data does not reflect a belief by Navellier that any stock index constitutes an investment alternative to any Navellier equity strategy or is necessarily comparable to such strategies. Among the most important differences between the Indices and Navellier strategies are that the Navellier equity strategies may (1) incur material management fees, (2) concentrate its investments in relatively few stocks, industries, or sectors, (3) have significantly greater trading activity and related costs, and (4) be significantly more or less volatile than the Indices.
ETF Risk: We may invest in exchange traded funds (“ETFs”) and some of our investment strategies are generally fully invested in ETFs. Like traditional mutual funds, ETFs charge asset-based fees, but they generally do not charge initial sales charges or redemption fees and investors typically pay only customary brokerage fees to buy and sell ETF shares. The fees and costs charged by ETFs held in client accounts will not be deducted from the compensation the client pays Navellier. ETF prices can fluctuate up or down, and a client account could lose money investing in an ETF if the prices of the securities owned by the ETF go down. ETFs are subject to additional risks:
- ETF shares may trade above or below their net asset value;
- An active trading market for an ETF’s shares may not develop or be maintained;
- The value of an ETF may be more volatile than the underlying portfolio of securities the ETF is designed to track;
- The cost of owning shares of the ETF may exceed those a client would incur by directly investing in the underlying securities; and
- Trading of an ETF’s shares may be halted if the listing exchange’s officials deem it appropriate, the shares are delisted from the exchange, or the activation of market-wide “circuit breakers” (which are tied to large decreases in stock prices) halts stock trading generally.
Grader Disclosures: Investment in equity strategies involves substantial risk and has the potential for partial or complete loss of funds invested. The sample portfolio and any accompanying charts are for informational purposes only and are not to be construed as a solicitation to buy or sell any financial instrument and should not be relied upon as the sole factor in an investment making decision. As a matter of normal and important disclosures to you, as a potential investor, please consider the following: The performance presented is not based on any actual securities trading, portfolio, or accounts, and the reported performance of the A, B, C, D, and F portfolios (collectively the “model portfolios”) should be considered mere “paper” or pro forma performance results based on Navellier’s research.
Investors evaluating any of Navellier & Associates, Inc.’s, (or its affiliates’) Investment Products must not use any information presented here, including the performance figures of the model portfolios, in their evaluation of any Navellier Investment Products. Navellier Investment Products include the firm’s mutual funds and managed accounts. The model portfolios, charts, and other information presented do not represent actual funded trades and are not actual funded portfolios. There are material differences between Navellier Investment Products’ portfolios and the model portfolios, research, and performance figures presented here. The model portfolios and the research results (1) may contain stocks or ETFs that are illiquid and difficult to trade; (2) may contain stock or ETF holdings materially different from actual funded Navellier Investment Product portfolios; (3) include the reinvestment of all dividends and other earnings, estimated trading costs, commissions, or management fees; and, (4) may not reflect prices obtained in an actual funded Navellier Investment Product portfolio. For these and other reasons, the reported performances of model portfolios do not reflect the performance results of Navellier’s actually funded and traded Investment Products. In most cases, Navellier’s Investment Products have materially lower performance results than the performances of the model portfolios presented.
This report contains statements that are, or may be considered to be, forward-looking statements. All statements that are not historical facts, including statements about our beliefs or expectations, are “forward-looking statements” within the meaning of The U.S. Private Securities Litigation Reform Act of 1995. These statements may be identified by such forward-looking terminology as “expect,” “estimate,” “plan,” “intend,” “believe,” “anticipate,” “may,” “will,” “should,” “could,” “continue,” “project,” or similar statements or variations of such terms. Our forward-looking statements are based on a series of expectations, assumptions, and projections, are not guarantees of future results or performance, and involve substantial risks and uncertainty as described in Form ADV Part 2A of our filing with the Securities and Exchange Commission (SEC), which is available at www.adviserinfo.sec.gov or by requesting a copy by emailing info@navellier.com. All of our forward-looking statements are as of the date of this report only. We can give no assurance that such expectations or forward-looking statements will prove to be correct. Actual results may differ materially. You are urged to carefully consider all such factors.
FEDERAL TAX ADVICE DISCLAIMER: As required by U.S. Treasury Regulations, you are informed that, to the extent this presentation includes any federal tax advice, the presentation is not written by Navellier to be used, and cannot be used, for the purpose of avoiding federal tax penalties. Navellier does not advise on any income tax requirements or issues. Use of any information presented by Navellier is for general information only and does not represent tax advice either express or implied. You are encouraged to seek professional tax advice for income tax questions and assistance.
IMPORTANT NEWSLETTER DISCLOSURE:The hypothetical performance results for investment newsletters that are authored or edited by Louis Navellier, including Louis Navellier’s Growth Investor, Louis Navellier’s Breakthrough Stocks, Louis Navellier’s Accelerated Profits, and Louis Navellier’s Platinum Club, are not based on any actual securities trading, portfolio, or accounts, and the newsletters’ reported hypothetical performances should be considered mere “paper” or proforma hypothetical performance results and are not actual performance of real world trades. Navellier & Associates, Inc. does not have any relation to or affiliation with the owner of these newsletters. There are material differences between Navellier Investment Products’ portfolios and the InvestorPlace Media, LLC newsletter portfolios authored by Louis Navellier. The InvestorPlace Media, LLC newsletters contain hypothetical performance that do not include transaction costs, advisory fees, or other fees a client might incur if actual investments and trades were being made by an investor. As a result, newsletter performance should not be used to evaluate Navellier Investment services which are separate and different from the newsletters. The owner of the newsletters is InvestorPlace Media, LLC and any questions concerning the newsletters, including any newsletter advertising or hypothetical Newsletter performance claims, (which are calculated solely by Investor Place Media and not Navellier) should be referred to InvestorPlace Media, LLC at (800) 718-8289.
Please note that Navellier & Associates and the Navellier Private Client Group are managed completely independent of the newsletters owned and published by InvestorPlace Media, LLC and written and edited by Louis Navellier, and investment performance of the newsletters should in no way be considered indicative of potential future investment performance for any Navellier & Associates separately managed account portfolio. Potential investors should consult with their financial advisor before investing in any Navellier Investment Product.
Navellier claims compliance with Global Investment Performance Standards (GIPS). To receive a complete list and descriptions of Navellier’s composites and/or a presentation that adheres to the GIPS standards, please contact Navellier or click here. It should not be assumed that any securities recommendations made by Navellier & Associates, Inc. in the future will be profitable or equal the performance of securities made in this report.
FactSet Disclosure: Navellier does not independently calculate the statistical information included in the attached report. The calculation and the information are provided by FactSet, a company not related to Navellier. Although information contained in the report has been obtained from FactSet and is based on sources Navellier believes to be reliable, Navellier does not guarantee its accuracy, and it may be incomplete or condensed. The report and the related FactSet sourced information are provided on an “as is” basis. The user assumes the entire risk of any use made of this information. Investors should consider the report as only a single factor in making their investment decision. The report is for informational purposes only and is not intended as an offer or solicitation for the purchase or sale of a security. FactSet sourced information is the exclusive property of FactSet. Without prior written permission of FactSet, this information may not be reproduced, disseminated or used to create any financial products. All indices are unmanaged and performance of the indices include reinvestment of dividends and interest income, unless otherwise noted, are not illustrative of any particular investment and an investment cannot be made in any index. Past performance is no guarantee of future results.