by Jason Bodner
October 21, 2025
Did you know that when a star dies, it doesn’t always explode into a spectacular supernova?
Sometimes, the star simply dies, or disappears. Astronomers call it a “failed-supernova,” a massive star collapsing quietly into a black-hole. No fireworks, no flash… just a silent transition.
In cosmic terms that’s not destruction, it is transformation. Matter doesn’t disappear, it changes states.
That’s a helpful way to think about markets. After a strong run, we’re seeing less explosion and more recalibration. The S&P 500 tracking ETF (SPY) is off 0.25% so far in October, so investors naturally wonder if this is the start of something more serious. The answer will come in time, but data offers clues.
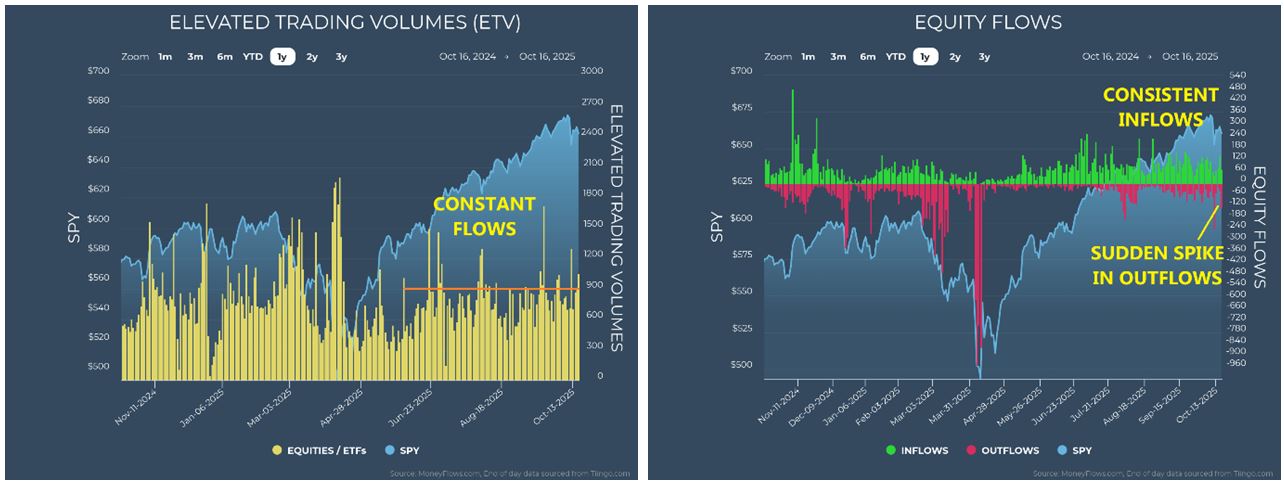
The Big Money Index (BMI), our barometer for institutional fund flows, is drifting lower while volatility has ticked higher. The BMI is now at its lowest level since May 15, when it began rising from April’s lows. The first rule of thumb is, when the BMI falls, outflows outweigh inflows. When the money flows are light, a pause in buying can push it down. That can happen for several reasons.
When flows are steady, a rise in outflows does the trick. When both combine – elevated selling and slowing buying – the BMI can drop quickly. We’re not dropping quickly, just drifting down:


Graphs are for illustrative and discussion purposes only. Please read important disclosures at the end of this commentary.
Right now, inflows remain consistent, but outflows are pulling the index down. That’s the bad news. The good news is that this type of action doesn’t always signal a market top. It often just marks normal “backing and filling” after a long climb. We’ve seen it happen before.
Graphs are for illustrative and discussion purposes only. Please read important disclosures at the end of this commentary.
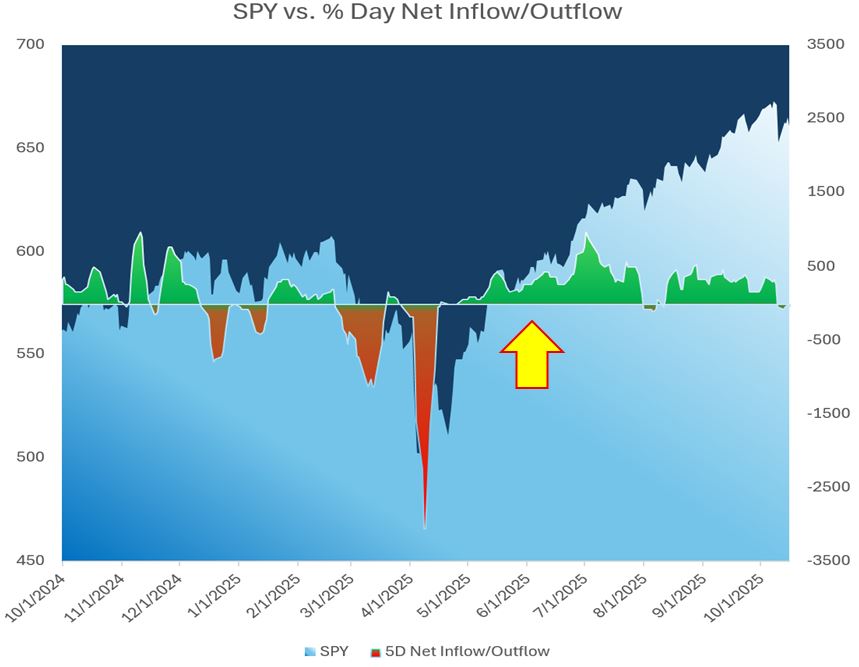
Take the past five-days on a rolling basis. Since October 10th, we’ve seen net outflows for the first time since August. That sounds ominous, until you recall what happened the last time it occurred. Back in August, the dip was fleeting, followed by a surge of inflows and higher-prices.
Graphs are for illustrative and discussion purposes only. Please read important disclosures at the end of this commentary.
The lesson is simple, small negative readings don’t matter as much as their intensity and duration. A brief down-tick is normal, a prolonged drain is where trouble begins. A tiny blip is happening now (above-right).
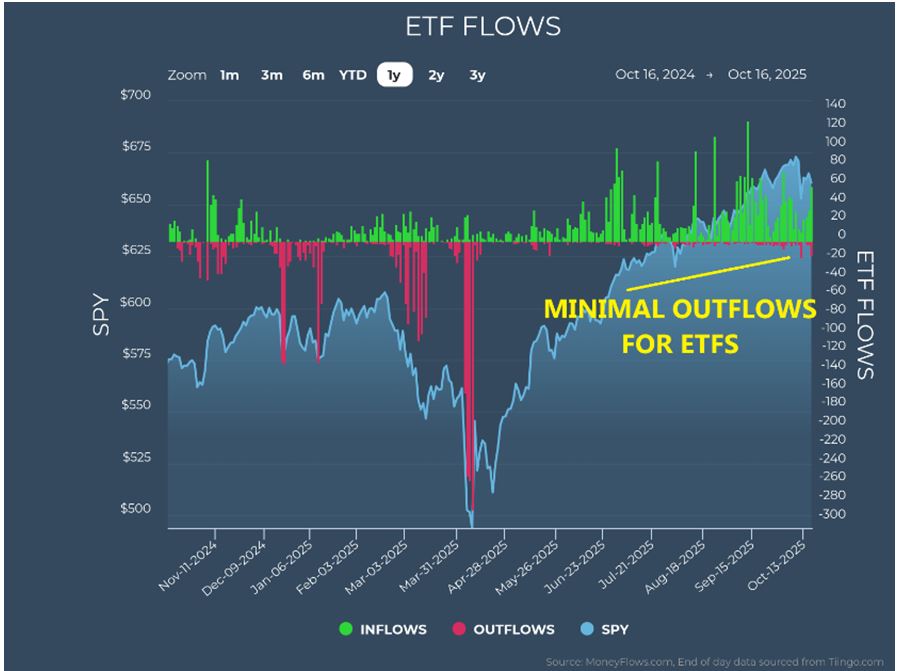
So far, there’s no sign of a prolonged drain. ETF outflows haven’t followed suit, there are no meaningful withdrawals there. Despite an elevated VIX and heavier outflows, I’m not yet worried.
Graphs are for illustrative and discussion purposes only. Please read important disclosures at the end of this commentary.
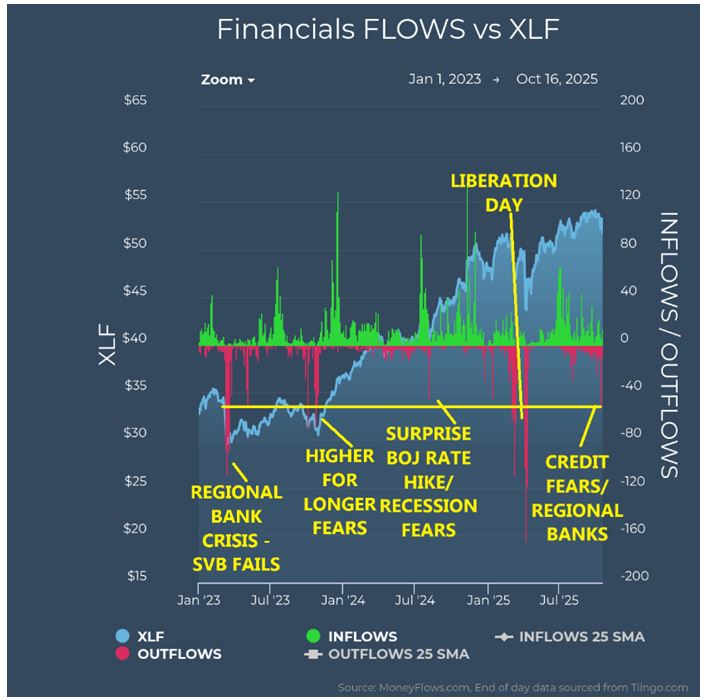
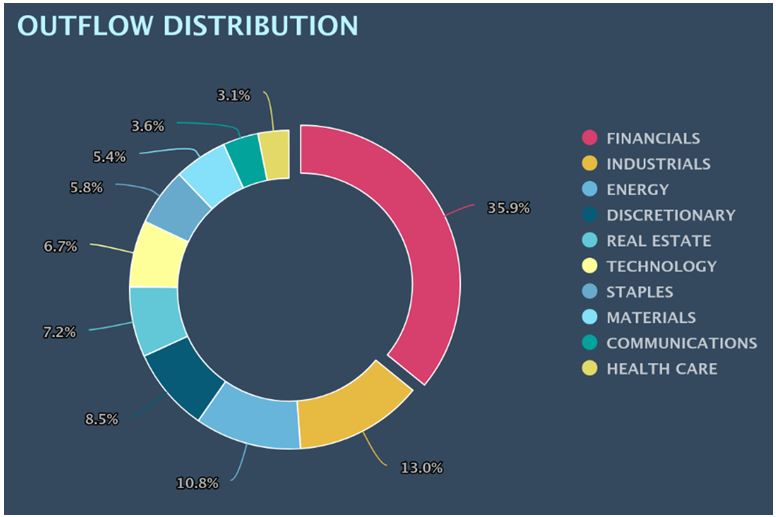
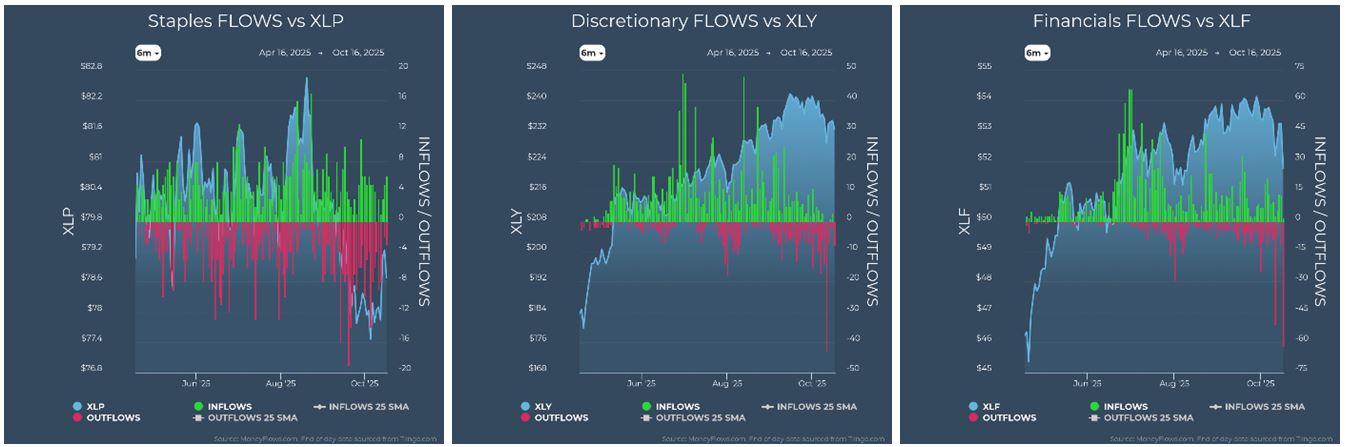
What’s behind the pressure? It’s mostly in the financials. Whispers of bad loans and renewed concern over regional banks have weighed on the sector. Last week alone, we saw 62-financial outflow signals, the most since the April 2nd Liberation Day. To find a comparable stretch, you’d have to go back to March 2023, when Silicon Valley Bank collapsed and fear briefly gripped the system.
History shows that these crises usually prove more contained than feared. My hunch is this will too:
Graphs are for illustrative and discussion purposes only. Please read important disclosures at the end of this commentary.
Weakness in financials was compounded by volatility in cryptocurrency and mining stocks, which dragged down broader financial names not directly related to banking. Altogether, financials accounted for roughly 35% of market outflows, followed by industrials, energy, and discretionary stocks.
Graphs are for illustrative and discussion purposes only. Please read important disclosures at the end of this commentary.
This, friends, is what turbulence looks like in an otherwise steady flight. As I said last week, turbulence doesn’t mean that the plane is going down, it just means we’ve hit a rough patch of air.
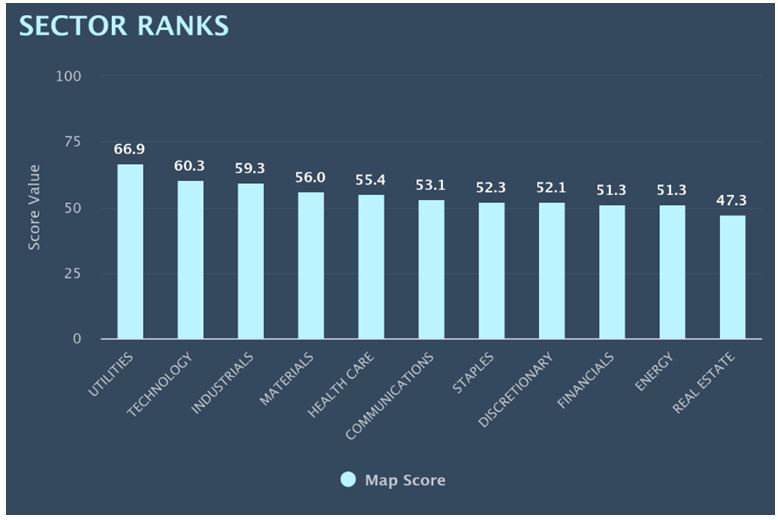
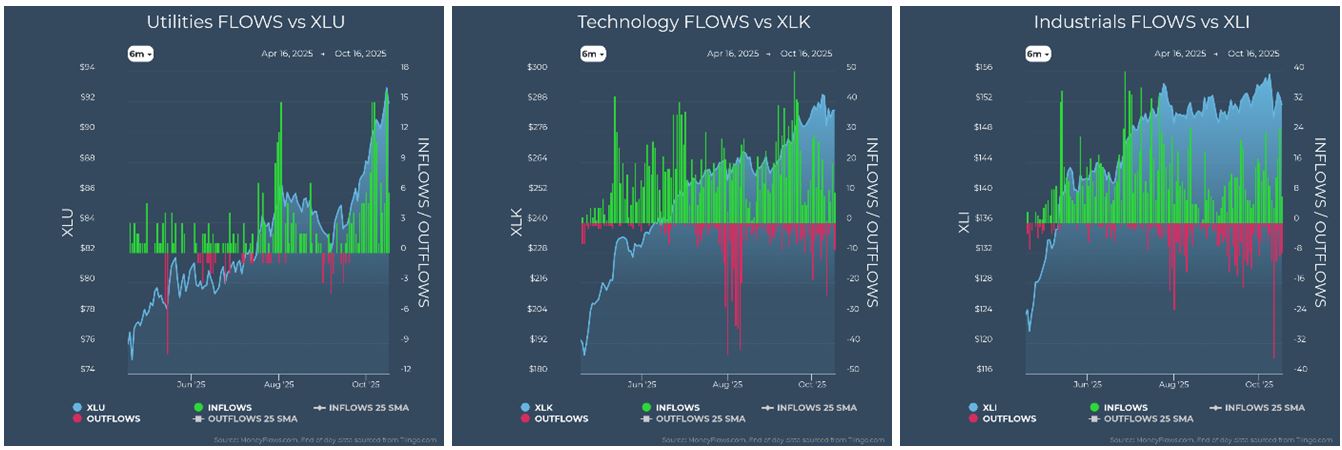
Sector rankings continue to send mixed signals. Utilities lead, buoyed by the narrative that AI is consuming massive electricity. If markets grow risk-averse, utilities tend to benefit as investors seek safety in their lower volatility and higher yields. Just behind utilities is technology, still drawing strong inflows, particularly into semiconductors, software, hardware, and storage – classic risk-on behavior.
Graphs are for illustrative and discussion purposes only. Please read important disclosures at the end of this commentary.
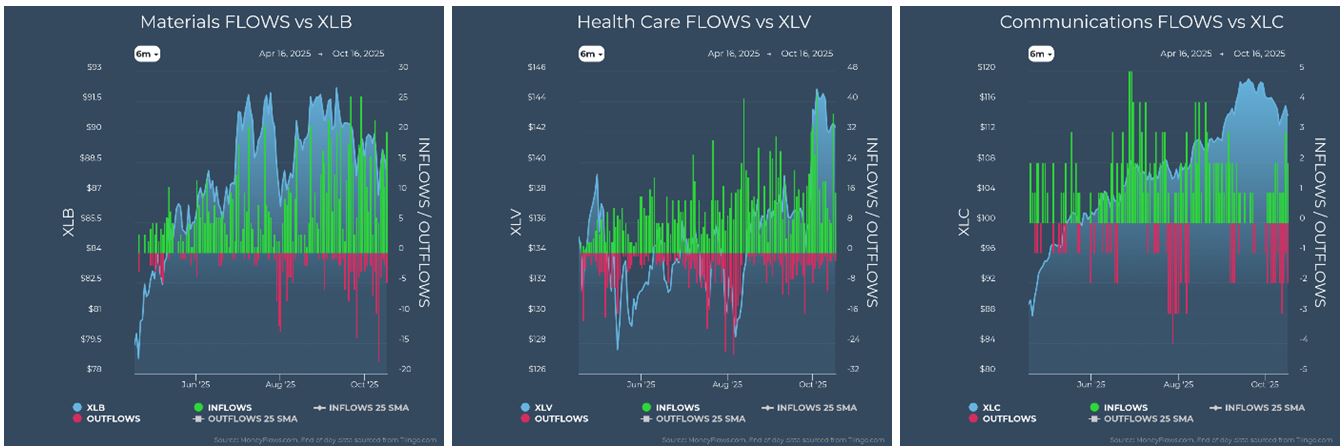
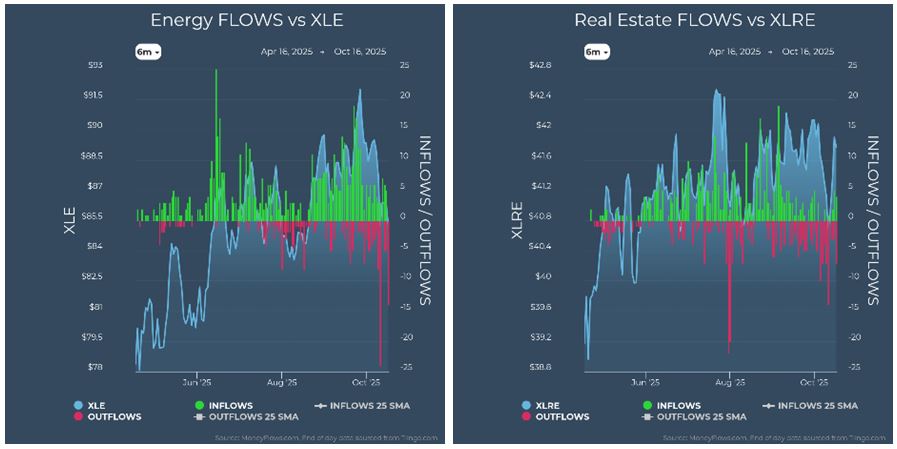
Next up are industrials, materials, and healthcare, three-sectors that typically indicate expansion. The industrials point to construction and infrastructure strength, materials provide the inputs for that growth; healthcare, rebounding from earlier weakness, is near six-month highs and eying 12-month peaks.
In fact, ten of the S&Ps 11-sectors are at, or near, highs, including those bruised financials. Only staples remain near six-month lows. On the surface, that’s bullish breadth, but it also suggests a market approaching full participation, where future gains may require digestion before the next leg higher.
Graphs are for illustrative and discussion purposes only. Please read important disclosures at the end of this commentary.
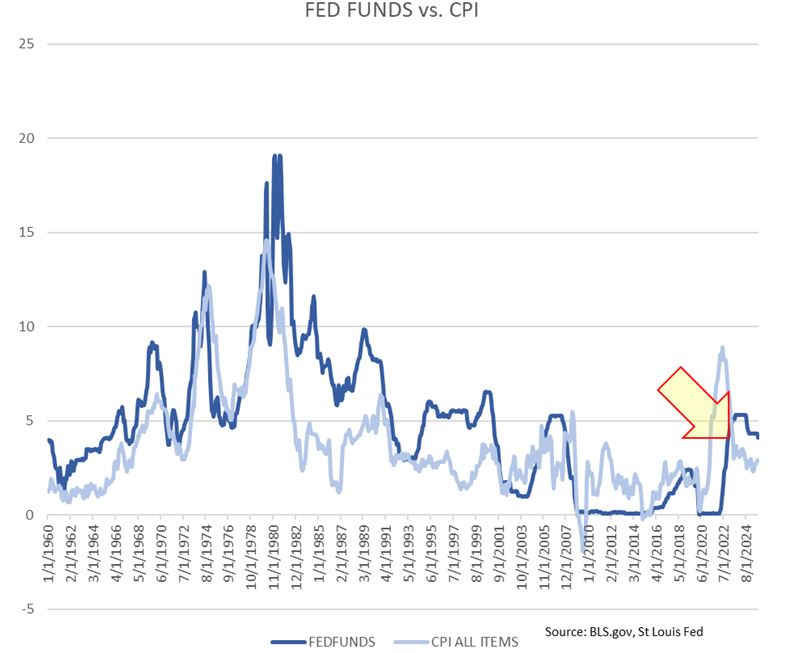
From a macro perspective, the tailwinds are still strong. The Federal Reserve delivered its first rate cut of the year, with more likely to come. The next move is expected to be 25-basis points, though Fed Governor Stephen Miran has advocated for a 50-basis-point cut. Despite a modest uptick in inflation, the long-term trend remains lower, so rate cuts should keep narrowing the spread between the Fed funds rate and CPI.
Graphs are for illustrative and discussion purposes only. Please read important disclosures at the end of this commentary.
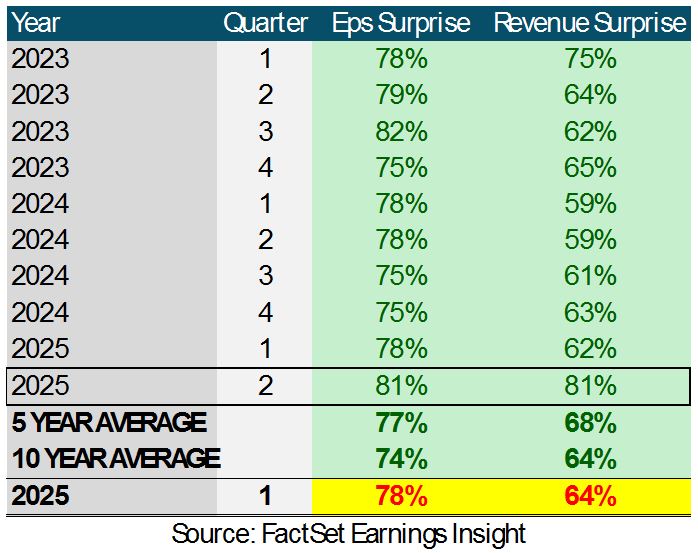
Meanwhile, fiscal policy is friendly, too. The much-discussed “Big Beautiful Bill” could reduce corporate taxes and boost their cash flow. Lower borrowing costs and lighter tax burdens mean companies can widen margins without selling more goods. And they are selling more. According to FactSet, 81% of S&P 500 companies beat both earnings and sales expectations in Q2 – the strongest rate of positive surprises in years. The ten-year averages are 78% and 64%. Corporate America is still firing on all cylinders.
Graphs are for illustrative and discussion purposes only. Please read important disclosures at the end of this commentary.
Then there’s the mountain of $7.5-trillion in cash sitting in money markets. As rates fall, yields will drop. It’s tempting to assume that cash will rush into equities, but reality is subtler. Yields would likely need to fall to near 1.5 % to match the S&P’s after-tax dividend yield, and that raises something crucial: total return.
The S&P 500 is up 14.8 % this year versus roughly 2.5 % in after-tax returns from money markets, so stocks delivered 5.9-times the return. Even if yields seem appealing, they can’t match rising equity gains.
We’re seeing mild outflows, not panic. Sector leadership is shifting but healthy. Financials remain under pressure, but contagion looks limited. The macro back-drop is supportive: falling rates, lower-taxes, strong earnings, and trillions waiting for a home. In short, we’ve hit turbulence, but the plane’s engines are fine.
A “failed-supernova” is just transformation of matter. Markets work the same way. Pressure and volatility often precede renewal. What looks like a fade-out may just be energy regrouping for the next expansion.
As the stoic Marcus Aurelius wrote, “Observe constantly that all things take place by change.”
All content above represents the opinion of Jason Bodner of Navellier & Associates, Inc.
Also In This Issue
A Look Ahead by Louis Navellier
Rising Earnings and the World’s Best Economy Point to a Rising Market
Income Mail by Bryan Perry
Measuring the Market’s Pros and Cons (on the Anniversary of the 1987 Crash)
Growth Mail by Gary Alexander
Book Review: Will “1929” Happen Again Soon?
Global Mail by Ivan Martchev
Will We See Any More “Trillion Dollar Tweets?”
Sector Spotlight by Jason Bodner
Most Corrections Do Not Become Crashes
View Full Archive
Read Past Issues Here

Jason Bodner
MARKETMAIL EDITOR FOR SECTOR SPOTLIGHT
Jason Bodner writes Sector Spotlight in the weekly Marketmail publication and has authored several white papers for the company. He is also Co-Founder of Macro Analytics for Professionals which produces proprietary equity accumulation and distribution research for its clients. Previously, Mr. Bodner served as Director of European Equity Derivatives for Cantor Fitzgerald Europe in London, then moved to the role of Head of Equity Derivatives North America for the same company in New York. He also served as S.V.P. Equity Derivatives for Jefferies, LLC. He received a B.S. in business administration in 1996, with honors, from Skidmore College as a member of the Periclean Honors Society. All content of “Sector Spotlight” represents the opinion of Jason Bodner
Important Disclosures:
Jason Bodner is a co-founder and co-owner of Mapsignals. Mr. Bodner is an independent contractor who is occasionally hired by Navellier & Associates to write an article and or provide opinions for possible use in articles that appear in Navellier & Associates weekly Market Mail. Mr. Bodner is not employed or affiliated with Louis Navellier, Navellier & Associates, Inc., or any other Navellier owned entity. The opinions and statements made here are those of Mr. Bodner and not necessarily those of any other persons or entities. This is not an endorsement, or solicitation or testimonial or investment advice regarding the BMI Index or any statements or recommendations or analysis in the article or the BMI Index or Mapsignals or its products or strategies.
Although information in these reports has been obtained from and is based upon sources that Navellier believes to be reliable, Navellier does not guarantee its accuracy and it may be incomplete or condensed. All opinions and estimates constitute Navellier’s judgment as of the date the report was created and are subject to change without notice. These reports are for informational purposes only and are not a solicitation for the purchase or sale of a security. Any decision to purchase securities mentioned in these reports must take into account existing public information on such securities or any registered prospectus.To the extent permitted by law, neither Navellier & Associates, Inc., nor any of its affiliates, agents, or service providers assumes any liability or responsibility nor owes any duty of care for any consequences of any person acting or refraining to act in reliance on the information contained in this communication or for any decision based on it.
Past performance is no indication of future results. Investment in securities involves significant risk and has the potential for partial or complete loss of funds invested. It should not be assumed that any securities recommendations made by Navellier. in the future will be profitable or equal the performance of securities made in this report. Dividend payments are not guaranteed. The amount of a dividend payment, if any, can vary over time and issuers may reduce dividends paid on securities in the event of a recession or adverse event affecting a specific industry or issuer.
None of the stock information, data, and company information presented herein constitutes a recommendation by Navellier or a solicitation to buy or sell any securities. Any specific securities identified and described do not represent all of the securities purchased, sold, or recommended for advisory clients. The holdings identified do not represent all of the securities purchased, sold, or recommended for advisory clients and the reader should not assume that investments in the securities identified and discussed were or will be profitable.
Information presented is general information that does not take into account your individual circumstances, financial situation, or needs, nor does it present a personalized recommendation to you. Individual stocks presented may not be suitable for every investor. Investment in securities involves significant risk and has the potential for partial or complete loss of funds invested. Investment in fixed income securities has the potential for the investment return and principal value of an investment to fluctuate so that an investor’s holdings, when redeemed, may be worth less than their original cost.
One cannot invest directly in an index. Index is unmanaged and index performance does not reflect deduction of fees, expenses, or taxes. Presentation of Index data does not reflect a belief by Navellier that any stock index constitutes an investment alternative to any Navellier equity strategy or is necessarily comparable to such strategies. Among the most important differences between the Indices and Navellier strategies are that the Navellier equity strategies may (1) incur material management fees, (2) concentrate its investments in relatively few stocks, industries, or sectors, (3) have significantly greater trading activity and related costs, and (4) be significantly more or less volatile than the Indices.
ETF Risk: We may invest in exchange traded funds (“ETFs”) and some of our investment strategies are generally fully invested in ETFs. Like traditional mutual funds, ETFs charge asset-based fees, but they generally do not charge initial sales charges or redemption fees and investors typically pay only customary brokerage fees to buy and sell ETF shares. The fees and costs charged by ETFs held in client accounts will not be deducted from the compensation the client pays Navellier. ETF prices can fluctuate up or down, and a client account could lose money investing in an ETF if the prices of the securities owned by the ETF go down. ETFs are subject to additional risks:
- ETF shares may trade above or below their net asset value;
- An active trading market for an ETF’s shares may not develop or be maintained;
- The value of an ETF may be more volatile than the underlying portfolio of securities the ETF is designed to track;
- The cost of owning shares of the ETF may exceed those a client would incur by directly investing in the underlying securities and;
- Trading of an ETF’s shares may be halted if the listing exchange’s officials deem it appropriate, the shares are delisted from the exchange, or the activation of market-wide “circuit breakers” (which are tied to large decreases in stock prices) halts stock trading generally.
Grader Disclosures: Investment in equity strategies involves substantial risk and has the potential for partial or complete loss of funds invested. The sample portfolio and any accompanying charts are for informational purposes only and are not to be construed as a solicitation to buy or sell any financial instrument and should not be relied upon as the sole factor in an investment making decision. As a matter of normal and important disclosures to you, as a potential investor, please consider the following: The performance presented is not based on any actual securities trading, portfolio, or accounts, and the reported performance of the A, B, C, D, and F portfolios (collectively the “model portfolios”) should be considered mere “paper” or pro forma performance results based on Navellier’s research.
Investors evaluating any of Navellier & Associates, Inc.’s, (or its affiliates’) Investment Products must not use any information presented here, including the performance figures of the model portfolios, in their evaluation of any Navellier Investment Products. Navellier Investment Products include the firm’s mutual funds and managed accounts. The model portfolios, charts, and other information presented do not represent actual funded trades and are not actual funded portfolios. There are material differences between Navellier Investment Products’ portfolios and the model portfolios, research, and performance figures presented here. The model portfolios and the research results (1) may contain stocks or ETFs that are illiquid and difficult to trade; (2) may contain stock or ETF holdings materially different from actual funded Navellier Investment Product portfolios; (3) include the reinvestment of all dividends and other earnings, estimated trading costs, commissions, or management fees; and, (4) may not reflect prices obtained in an actual funded Navellier Investment Product portfolio. For these and other reasons, the reported performances of model portfolios do not reflect the performance results of Navellier’s actually funded and traded Investment Products. In most cases, Navellier’s Investment Products have materially lower performance results than the performances of the model portfolios presented.
This report contains statements that are, or may be considered to be, forward-looking statements. All statements that are not historical facts, including statements about our beliefs or expectations, are “forward-looking statements” within the meaning of The U.S. Private Securities Litigation Reform Act of 1995. These statements may be identified by such forward-looking terminology as “expect,” “estimate,” “plan,” “intend,” “believe,” “anticipate,” “may,” “will,” “should,” “could,” “continue,” “project,” or similar statements or variations of such terms. Our forward-looking statements are based on a series of expectations, assumptions, and projections, are not guarantees of future results or performance, and involve substantial risks and uncertainty as described in Form ADV Part 2A of our filing with the Securities and Exchange Commission (SEC), which is available at www.adviserinfo.sec.gov or by requesting a copy by emailing info@navellier.com. All of our forward-looking statements are as of the date of this report only. We can give no assurance that such expectations or forward-looking statements will prove to be correct. Actual results may differ materially. You are urged to carefully consider all such factors.
FEDERAL TAX ADVICE DISCLAIMER: As required by U.S. Treasury Regulations, you are informed that, to the extent this presentation includes any federal tax advice, the presentation is not written by Navellier to be used, and cannot be used, for the purpose of avoiding federal tax penalties. Navellier does not advise on any income tax requirements or issues. Use of any information presented by Navellier is for general information only and does not represent tax advice either express or implied. You are encouraged to seek professional tax advice for income tax questions and assistance.
IMPORTANT NEWSLETTER DISCLOSURE:The hypothetical performance results for investment newsletters that are authored or edited by Louis Navellier, including Louis Navellier’s Growth Investor, Louis Navellier’s Breakthrough Stocks, Louis Navellier’s Accelerated Profits, and Louis Navellier’s Platinum Club, are not based on any actual securities trading, portfolio, or accounts, and the newsletters’ reported hypothetical performances should be considered mere “paper” or proforma hypothetical performance results and are not actual performance of real world trades. Navellier & Associates, Inc. does not have any relation to or affiliation with the owner of these newsletters. There are material differences between Navellier Investment Products’ portfolios and the InvestorPlace Media, LLC newsletter portfolios authored by Louis Navellier. The InvestorPlace Media, LLC newsletters contain hypothetical performance that do not include transaction costs, advisory fees, or other fees a client might incur if actual investments and trades were being made by an investor. As a result, newsletter performance should not be used to evaluate Navellier Investment services which are separate and different from the newsletters. The owner of the newsletters is InvestorPlace Media, LLC and any questions concerning the newsletters, including any newsletter advertising or hypothetical Newsletter performance claims, (which are calculated solely by Investor Place Media and not Navellier) should be referred to InvestorPlace Media, LLC at (800) 718-8289.
Please note that Navellier & Associates and the Navellier Private Client Group are managed completely independent of the newsletters owned and published by InvestorPlace Media, LLC and written and edited by Louis Navellier, and investment performance of the newsletters should in no way be considered indicative of potential future investment performance for any Navellier & Associates separately managed account portfolio. Potential investors should consult with their financial advisor before investing in any Navellier Investment Product.
Navellier claims compliance with Global Investment Performance Standards (GIPS). To receive a complete list and descriptions of Navellier’s composites and/or a presentation that adheres to the GIPS standards, please contact Navellier or click here. It should not be assumed that any securities recommendations made by Navellier & Associates, Inc. in the future will be profitable or equal the performance of securities made in this report.
FactSet Disclosure: Navellier does not independently calculate the statistical information included in the attached report. The calculation and the information are provided by FactSet, a company not related to Navellier. Although information contained in the report has been obtained from FactSet and is based on sources Navellier believes to be reliable, Navellier does not guarantee its accuracy, and it may be incomplete or condensed. The report and the related FactSet sourced information are provided on an “as is” basis. The user assumes the entire risk of any use made of this information. Investors should consider the report as only a single factor in making their investment decision. The report is for informational purposes only and is not intended as an offer or solicitation for the purchase or sale of a security. FactSet sourced information is the exclusive property of FactSet. Without prior written permission of FactSet, this information may not be reproduced, disseminated or used to create any financial products. All indices are unmanaged and performance of the indices include reinvestment of dividends and interest income, unless otherwise noted, are not illustrative of any particular investment and an investment cannot be made in any index. Past performance is no guarantee of future results.