by Gary Alexander
September 30, 2025
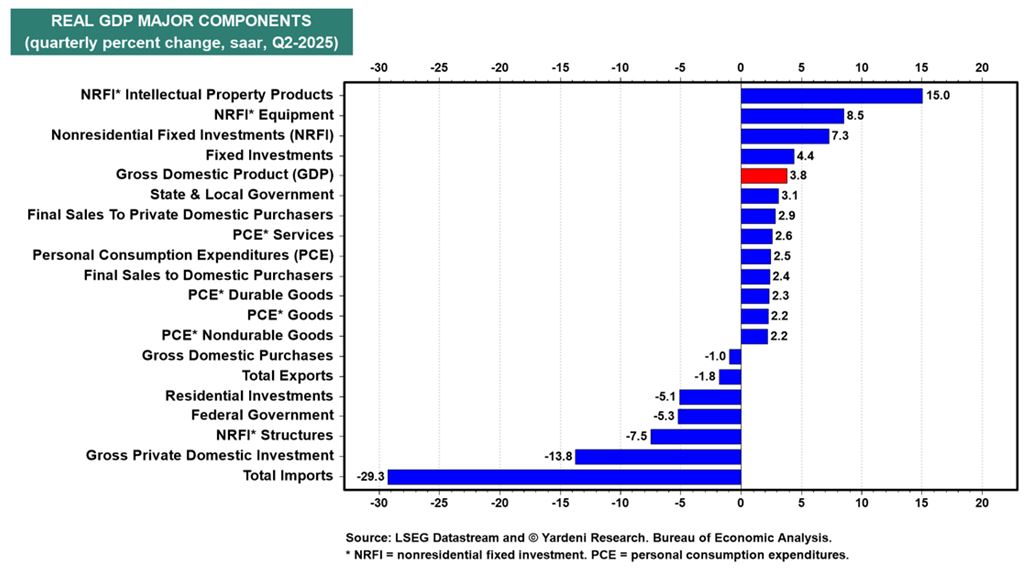
Last week’s third and final estimate of the second-quarter real GDP growth rate rose fairly dramatically, from 3.3% to 3.8%, confirming that the economy is in good-to-great condition. Most notably, I’d say, the consumer is still shopping, big-time, as real consumer spending was revised up from 1.6% to 2.5%.
Here are some of the major winning (and some losing) components of 2Q GDP, thanks to Ed Yardeni.
Graphs are for illustrative and discussion purposes only. Please read important disclosures at the end of this commentary.
Fixed investments in intellectual property (IP) were up the most (+15%) while imports were down the most (-29%), partly due to the imposition of higher (but temporary) tariffs on some trading partners.
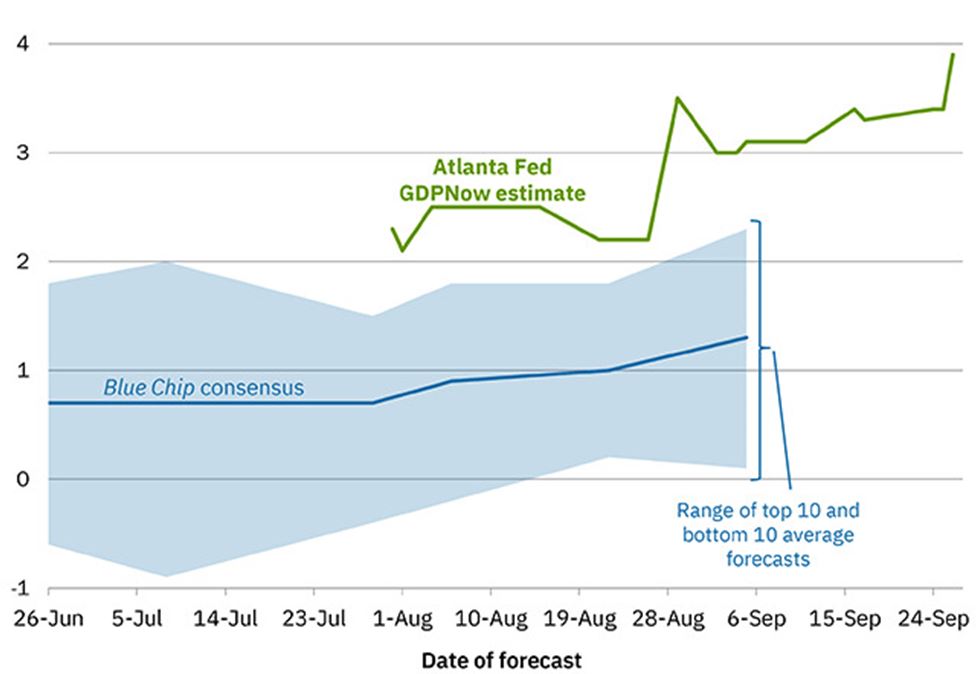
Moving ahead to the current (third-quarter), ending today, the Atlanta Fed’s model, GDPNow, estimates a continuation of the second-quarter’s torrid pace, at +3.9%, up from a 3.3% estimate earlier last week.
Graphs are for illustrative and discussion purposes only. Please read important disclosures at the end of this commentary.
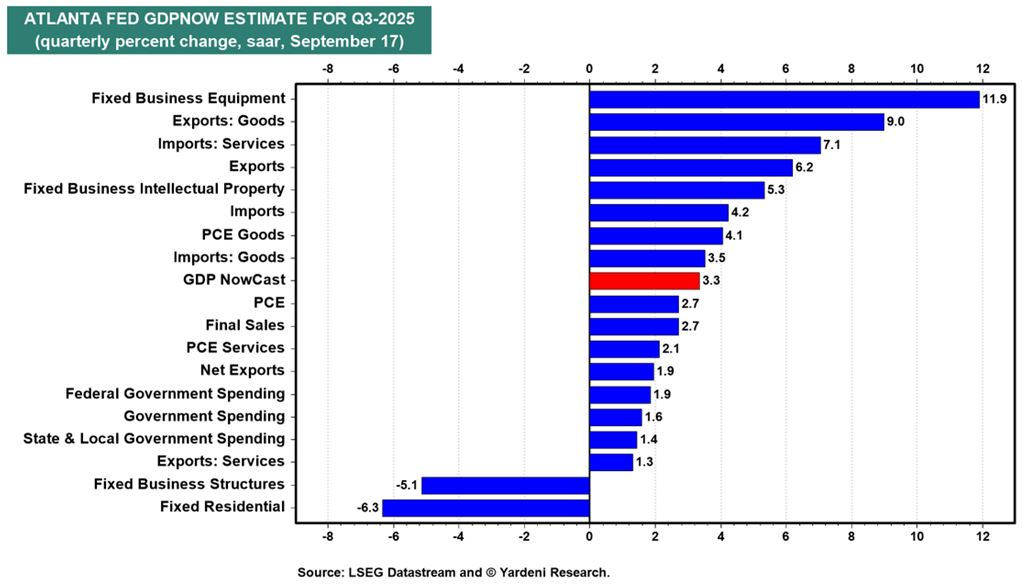
Looking at the leading component from the Atlanta Fed, we see fixed business equipment rising the most (nearly 12%), while fixed residential and business structures were the main drag, down 5% to 6%.
Graphs are for illustrative and discussion purposes only. Please read important disclosures at the end of this commentary.
This sudden upward revision in real GDP growth in two-consecutive quarters – combined with the recent downward revisions in employment – implies that productivity growth is fueling this surge. The Fed cut-rates due to a weakness in the labor market rather than high-growth or high-inflation, but this latest wave of decline in new jobs seems to stem mostly from productivity growth – replacing humans with bots.
Bottom line, the Fed’s easing can’t “save” the job-market, but it could fuel a stock market melt-up.
For a “Happy New (Fiscal) Year” in 2026,
Congress Needs to Grow a Spine over Spending Cuts
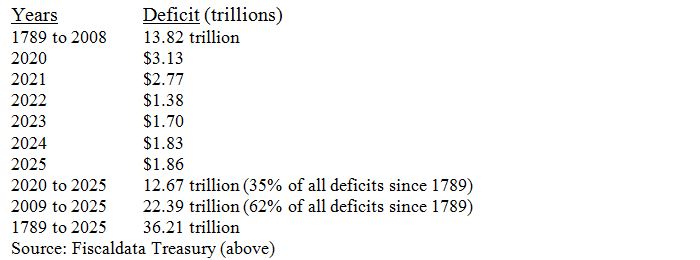
Today is not only the last day of the third-quarter. It is also the final day of Federal Fiscal Year 2025, a year in which the annual deficit is likely to rise, not fall, despite all the controversial (and ham-handed) actions of the Department of Government Efficiency (DOGE) in the first half of the calendar year.
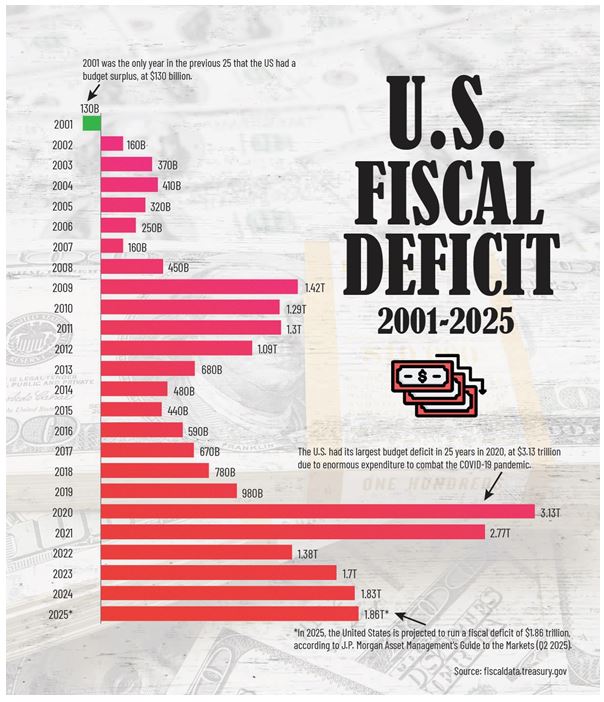
We won’t know the final deficit accounting for a couple of weeks, but it looks like the 2025 federal deficit will approach or surpass $1.9-trillion, the largest since 2021 and the third-largest deficit ever.
Graphs are for illustrative and discussion purposes only. Please read important disclosures at the end of this commentary.
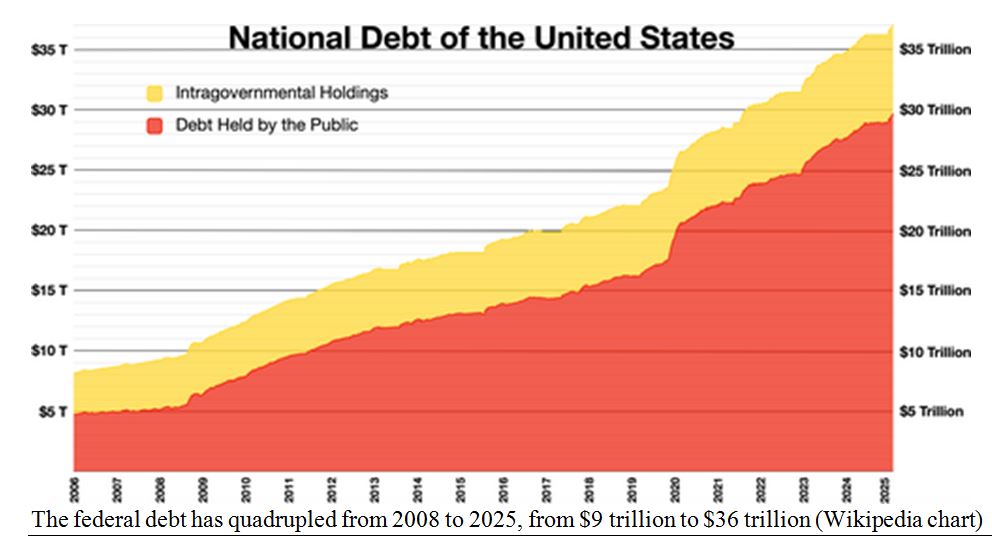
Deficits since 2008’s Great Recession account for 62% of the combined federal deficits in our first 235-years as a nation, and deficits since 2020 are more than half the deficits of all of the previous 230-years.
Graphs are for illustrative and discussion purposes only. Please read important disclosures at the end of this commentary.
Tax collections are not the problem. Income taxes (including Social Security) totaled $3.972-trillion in the 11-months through August 31, 2025, compared with $3,743 the previous year’s same 11-months. That means the IRS collected 6% more in 2025 from we Americans – but federal spending grew faster.
Total tax revenues (from all sources) through the first 11-months of FY25 were $300-billion above all the tax collections from a year ago – led by a $182-billion increase in individual income taxes. Due in part to rising tariffs, customs duties were $95-billion higher this year than in the same 11-months in 2024.
This won’t happen forever. Tax collections are up due to a booming economy, but what if we enter a recession or slowdown? The, tax collections will decrease while the demand for benefits will increase.
These facts don’t seem to penetrate the minds of most voters or politicians, so the Kids on the Potomac are threatening a government shutdown again, tonight at midnight as the new fiscal year begins, since they can’t figure out how to talk to each other and fashion a 2026 budget. This is vastly different than one of President Clinton’s finest moments, when he admitted that the 1994 mid-term elections signaled “the end of big government as we know it.” Clinton and the new Republican House engineered a huge set of budget surpluses by the end of the 1990s, capped by a $130-billion budget surplus in fiscal year 2001.
This year, a 6.1% increase in spending – in a 3% inflationary world – isn’t enough for the big spenders in both Parties, but the Democrats are particularly adamant about reversing the “Big Beautiful Bill’s” cuts in wasteful Medicaid spending, plus pet programs like PBS and NPR. They also insist on more protections for federal workers – after few were let go by DOGE – and over $1-trillion in new Medicaid spending.
Graphs are for illustrative and discussion purposes only. Please read important disclosures at the end of this commentary.
In a predictable war of words on the Potomac, President Trump’s OMB director Russ Vought said that if the Democrats force a shutdown, he will order “reduction in force” (RIF) notices for “all employees in programs, projects, or activities.” Once the shutdown ends, he added, federal agencies will be directed to retain only a “minimal number” of employees needed to function. Take time-off, and you may be jobless.
We don’t want to get too mired in the political weeds of shutdowns, showdowns or suspensions, since this is primarily an investment column, and government shutdowns have little impact on the stock market.
Businesses live or die on their earnings. The less government intervention in businesses, the better (for them). History shows that the market has gained ground during most previous government shutdowns.
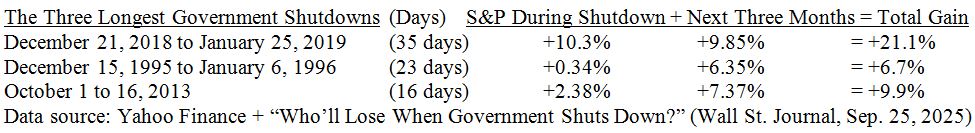
Most shutdowns lasted just a few days, but the three-longest shutdowns didn’t spook the market. The first (1996) was over a balanced budget resolution and Medicare funding. The second (2013) began on Day 1 of the new budget year, all about a proposal to defund Obamacare. The third involved funding Trump’s border wall. In that third-longest shutdown – running five-weeks, from December 21, 2018, to January 25, 2019 – the S&P 500 gained over 10% during the shutdown and another 10% in the next three-months.
Graphs are for illustrative and discussion purposes only. Please read important disclosures at the end of this commentary.
So, bring on the shutdown, Congress…. And then, start talking to each other about realistic spending cuts.
All content above represents the opinion of Gary Alexander of Navellier & Associates, Inc.
Also In This Issue
A Look Ahead by Louis Navellier
Skilled Tech Workers Are Losing Their Jobs, Mostly Due to AI
Income Mail by Bryan Perry
Finding Good Yields in the Bond Junk Yard
Growth Mail by Gary Alexander
Happy New Year! Growth Surges as we Enter Fiscal Year 2026
Global Mail by Ivan Martchev
A Quarter-Ending Ramp-Up Is Likely
Sector Spotlight by Jason Bodner
The Data Speak Volumes, Even When the Market Seems Silent
View Full Archive
Read Past Issues Here
About The Author

Gary Alexander
SENIOR EDITOR
Gary Alexander has been Senior Writer at Navellier since 2009. He edits Navellier’s weekly Marketmail and writes a weekly Growth Mail column, in which he uses market history to support the case for growth stocks. For the previous 20-years before joining Navellier, he was Senior Executive Editor at InvestorPlace Media (formerly Phillips Publishing), where he worked with several leading investment analysts, including Louis Navellier (since 1997), helping launch Louis Navellier’s Blue Chip Growth and Global Growth newsletters.
Prior to that, Gary edited Wealth Magazine and Gold Newsletter and wrote various investment research reports for Jefferson Financial in New Orleans in the 1980s. He began his financial newsletter career with KCI Communications in 1980, where he served as consulting editor for Personal Finance newsletter while serving as general manager of KCI’s Alexandria House book division. Before that, he covered the economics beat for news magazines. All content of “Growth Mail” represents the opinion of Gary Alexander
Important Disclosures:
Although information in these reports has been obtained from and is based upon sources that Navellier believes to be reliable, Navellier does not guarantee its accuracy and it may be incomplete or condensed. All opinions and estimates constitute Navellier’s judgment as of the date the report was created and are subject to change without notice. These reports are for informational purposes only and are not a solicitation for the purchase or sale of a security. Any decision to purchase securities mentioned in these reports must take into account existing public information on such securities or any registered prospectus.To the extent permitted by law, neither Navellier & Associates, Inc., nor any of its affiliates, agents, or service providers assumes any liability or responsibility nor owes any duty of care for any consequences of any person acting or refraining to act in reliance on the information contained in this communication or for any decision based on it.
Past performance is no indication of future results. Investment in securities involves significant risk and has the potential for partial or complete loss of funds invested. It should not be assumed that any securities recommendations made by Navellier. in the future will be profitable or equal the performance of securities made in this report. Dividend payments are not guaranteed. The amount of a dividend payment, if any, can vary over time and issuers may reduce dividends paid on securities in the event of a recession or adverse event affecting a specific industry or issuer.
None of the stock information, data, and company information presented herein constitutes a recommendation by Navellier or a solicitation to buy or sell any securities. Any specific securities identified and described do not represent all of the securities purchased, sold, or recommended for advisory clients. The holdings identified do not represent all of the securities purchased, sold, or recommended for advisory clients and the reader should not assume that investments in the securities identified and discussed were or will be profitable.
Information presented is general information that does not take into account your individual circumstances, financial situation, or needs, nor does it present a personalized recommendation to you. Individual stocks presented may not be suitable for every investor. Investment in securities involves significant risk and has the potential for partial or complete loss of funds invested. Investment in fixed income securities has the potential for the investment return and principal value of an investment to fluctuate so that an investor’s holdings, when redeemed, may be worth less than their original cost.
One cannot invest directly in an index. Index is unmanaged and index performance does not reflect deduction of fees, expenses, or taxes. Presentation of Index data does not reflect a belief by Navellier that any stock index constitutes an investment alternative to any Navellier equity strategy or is necessarily comparable to such strategies. Among the most important differences between the Indices and Navellier strategies are that the Navellier equity strategies may (1) incur material management fees, (2) concentrate its investments in relatively few stocks, industries, or sectors, (3) have significantly greater trading activity and related costs, and (4) be significantly more or less volatile than the Indices.
ETF Risk: We may invest in exchange traded funds (“ETFs”) and some of our investment strategies are generally fully invested in ETFs. Like traditional mutual funds, ETFs charge asset-based fees, but they generally do not charge initial sales charges or redemption fees and investors typically pay only customary brokerage fees to buy and sell ETF shares. The fees and costs charged by ETFs held in client accounts will not be deducted from the compensation the client pays Navellier. ETF prices can fluctuate up or down, and a client account could lose money investing in an ETF if the prices of the securities owned by the ETF go down. ETFs are subject to additional risks:
- ETF shares may trade above or below their net asset value;
- An active trading market for an ETF’s shares may not develop or be maintained;
- The value of an ETF may be more volatile than the underlying portfolio of securities the ETF is designed to track;
- The cost of owning shares of the ETF may exceed those a client would incur by directly investing in the underlying securities; and
- Trading of an ETF’s shares may be halted if the listing exchange’s officials deem it appropriate, the shares are delisted from the exchange, or the activation of market-wide “circuit breakers” (which are tied to large decreases in stock prices) halts stock trading generally.
Grader Disclosures: Investment in equity strategies involves substantial risk and has the potential for partial or complete loss of funds invested. The sample portfolio and any accompanying charts are for informational purposes only and are not to be construed as a solicitation to buy or sell any financial instrument and should not be relied upon as the sole factor in an investment making decision. As a matter of normal and important disclosures to you, as a potential investor, please consider the following: The performance presented is not based on any actual securities trading, portfolio, or accounts, and the reported performance of the A, B, C, D, and F portfolios (collectively the “model portfolios”) should be considered mere “paper” or pro forma performance results based on Navellier’s research.
Investors evaluating any of Navellier & Associates, Inc.’s, (or its affiliates’) Investment Products must not use any information presented here, including the performance figures of the model portfolios, in their evaluation of any Navellier Investment Products. Navellier Investment Products include the firm’s mutual funds and managed accounts. The model portfolios, charts, and other information presented do not represent actual funded trades and are not actual funded portfolios. There are material differences between Navellier Investment Products’ portfolios and the model portfolios, research, and performance figures presented here. The model portfolios and the research results (1) may contain stocks or ETFs that are illiquid and difficult to trade; (2) may contain stock or ETF holdings materially different from actual funded Navellier Investment Product portfolios; (3) include the reinvestment of all dividends and other earnings, estimated trading costs, commissions, or management fees; and, (4) may not reflect prices obtained in an actual funded Navellier Investment Product portfolio. For these and other reasons, the reported performances of model portfolios do not reflect the performance results of Navellier’s actually funded and traded Investment Products. In most cases, Navellier’s Investment Products have materially lower performance results than the performances of the model portfolios presented.
This report contains statements that are, or may be considered to be, forward-looking statements. All statements that are not historical facts, including statements about our beliefs or expectations, are “forward-looking statements” within the meaning of The U.S. Private Securities Litigation Reform Act of 1995. These statements may be identified by such forward-looking terminology as “expect,” “estimate,” “plan,” “intend,” “believe,” “anticipate,” “may,” “will,” “should,” “could,” “continue,” “project,” or similar statements or variations of such terms. Our forward-looking statements are based on a series of expectations, assumptions, and projections, are not guarantees of future results or performance, and involve substantial risks and uncertainty as described in Form ADV Part 2A of our filing with the Securities and Exchange Commission (SEC), which is available at www.adviserinfo.sec.gov or by requesting a copy by emailing info@navellier.com. All of our forward-looking statements are as of the date of this report only. We can give no assurance that such expectations or forward-looking statements will prove to be correct. Actual results may differ materially. You are urged to carefully consider all such factors.
FEDERAL TAX ADVICE DISCLAIMER: As required by U.S. Treasury Regulations, you are informed that, to the extent this presentation includes any federal tax advice, the presentation is not written by Navellier to be used, and cannot be used, for the purpose of avoiding federal tax penalties. Navellier does not advise on any income tax requirements or issues. Use of any information presented by Navellier is for general information only and does not represent tax advice either express or implied. You are encouraged to seek professional tax advice for income tax questions and assistance.
IMPORTANT NEWSLETTER DISCLOSURE:The hypothetical performance results for investment newsletters that are authored or edited by Louis Navellier, including Louis Navellier’s Growth Investor, Louis Navellier’s Breakthrough Stocks, Louis Navellier’s Accelerated Profits, and Louis Navellier’s Platinum Club, are not based on any actual securities trading, portfolio, or accounts, and the newsletters’ reported hypothetical performances should be considered mere “paper” or proforma hypothetical performance results and are not actual performance of real world trades. Navellier & Associates, Inc. does not have any relation to or affiliation with the owner of these newsletters. There are material differences between Navellier Investment Products’ portfolios and the InvestorPlace Media, LLC newsletter portfolios authored by Louis Navellier. The InvestorPlace Media, LLC newsletters contain hypothetical performance that do not include transaction costs, advisory fees, or other fees a client might incur if actual investments and trades were being made by an investor. As a result, newsletter performance should not be used to evaluate Navellier Investment services which are separate and different from the newsletters. The owner of the newsletters is InvestorPlace Media, LLC and any questions concerning the newsletters, including any newsletter advertising or hypothetical Newsletter performance claims, (which are calculated solely by Investor Place Media and not Navellier) should be referred to InvestorPlace Media, LLC at (800) 718-8289.
Please note that Navellier & Associates and the Navellier Private Client Group are managed completely independent of the newsletters owned and published by InvestorPlace Media, LLC and written and edited by Louis Navellier, and investment performance of the newsletters should in no way be considered indicative of potential future investment performance for any Navellier & Associates separately managed account portfolio. Potential investors should consult with their financial advisor before investing in any Navellier Investment Product.
Navellier claims compliance with Global Investment Performance Standards (GIPS). To receive a complete list and descriptions of Navellier’s composites and/or a presentation that adheres to the GIPS standards, please contact Navellier or click here. It should not be assumed that any securities recommendations made by Navellier & Associates, Inc. in the future will be profitable or equal the performance of securities made in this report.
FactSet Disclosure: Navellier does not independently calculate the statistical information included in the attached report. The calculation and the information are provided by FactSet, a company not related to Navellier. Although information contained in the report has been obtained from FactSet and is based on sources Navellier believes to be reliable, Navellier does not guarantee its accuracy, and it may be incomplete or condensed. The report and the related FactSet sourced information are provided on an “as is” basis. The user assumes the entire risk of any use made of this information. Investors should consider the report as only a single factor in making their investment decision. The report is for informational purposes only and is not intended as an offer or solicitation for the purchase or sale of a security. FactSet sourced information is the exclusive property of FactSet. Without prior written permission of FactSet, this information may not be reproduced, disseminated or used to create any financial products. All indices are unmanaged and performance of the indices include reinvestment of dividends and interest income, unless otherwise noted, are not illustrative of any particular investment and an investment cannot be made in any index. Past performance is no guarantee of future results.