by Jason Bodner
September 23, 2025
Did you know that bamboo can grow by more than three-feet in a single day? This astonishing growth rate makes bamboo one of the fastest growing plants on Earth. When conditions are right, entire forests can appear seemingly overnight – but it often takes five-years of underground growth before the first green-shoot emerges. In other words, the real growth happens under the surface before we see anything.
Markets can also surge with unexpected vigor, after a long base-building period.
Barring sudden geopolitical instability, the next three-months should be stellar for stocks, and we have already seen a typically weak-summer season instead being surprisingly strong.
Graphs are for illustrative and discussion purposes only. Please read important disclosures at the end of this commentary.
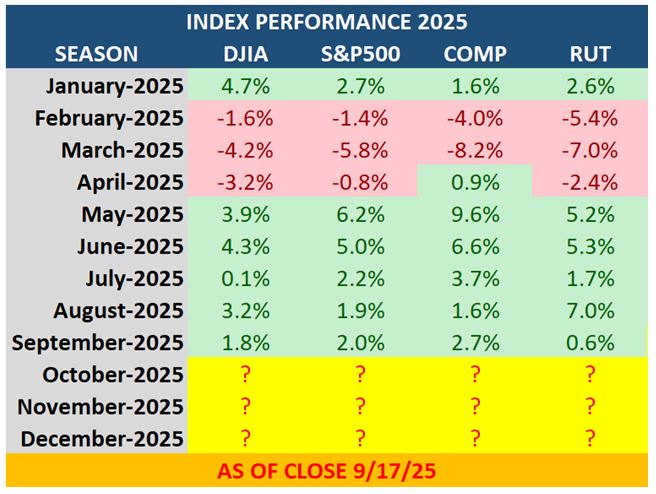
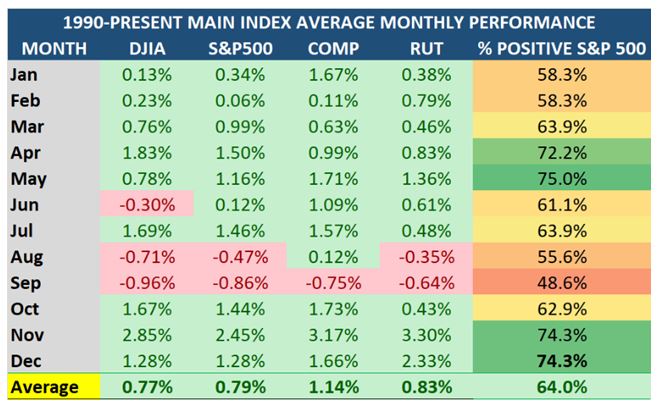
With one week left to go in September, we’ve seen five-straight months of rising stock markets in all four-major indexes (above), but for the previous 35-years, August and September have been the two-weakest months for equities. Since 1990, September has been positive less than half (48.6%) of the time. This matters because the final-quarter of the year is usually the strongest. October’s average returns are solid (a +1.3% average), December is better (+1.6%), and November posts the highest average-gains (at +3.2%).
Graphs are for illustrative and discussion purposes only. Please read important disclosures at the end of this commentary.
Heading into year-end, I feel well-positioned for what could be an outstanding finish.
The Fed’s Rate-Cut is an Added Gift
Last week, the Fed cut its target range short-term rate from a range of 4.25–4.50% to 4.00–4.25%. Most pundits expected a 25-basis-point cut, but the real juice came from the outlook for more cuts in October and November. Cuts usually are not a one-off event… they are part of a “cycle,” or long-term trend.
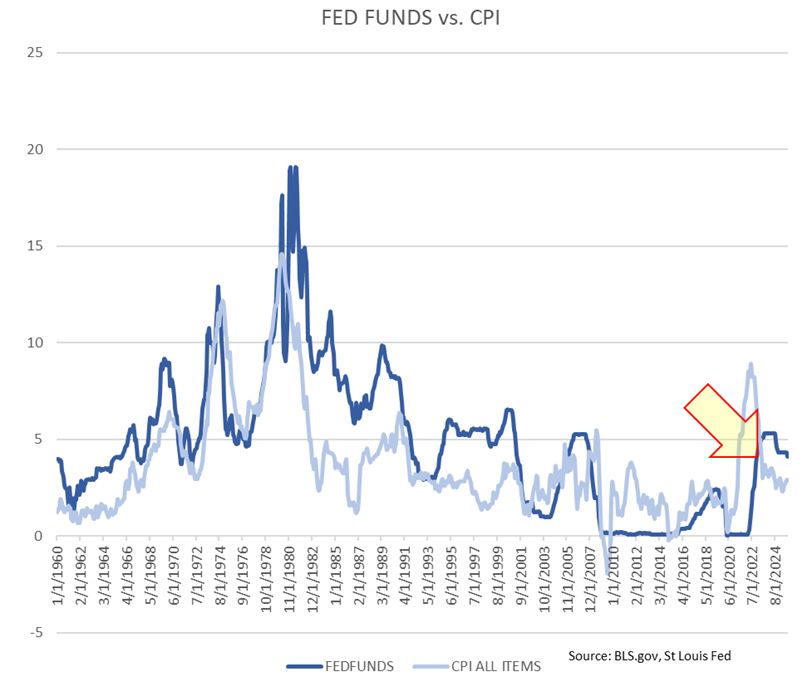
Inflation has steadied. The Consumer Price Index (CPI) ticked up in August, but the broader pattern remains down. Both the CPI and the Fed Funds effective rate are trending lower. Yet the spread between them remains elevated at 1.225 – still well above the 65-year average of 1.04. That gap can close two-ways – either inflation rises, or the Fed cuts further. With inflation stable, the odds favor the latter.
Graphs are for illustrative and discussion purposes only. Please read important disclosures at the end of this commentary.
It’s also worth remembering that the Fed’s 2% inflation target is a unicorn: The 65-year average CPI is 3.75%, so inflation under 3% is healthy. Falling rates and steady inflation are fertile ground for growth.
Earnings Strength Continues
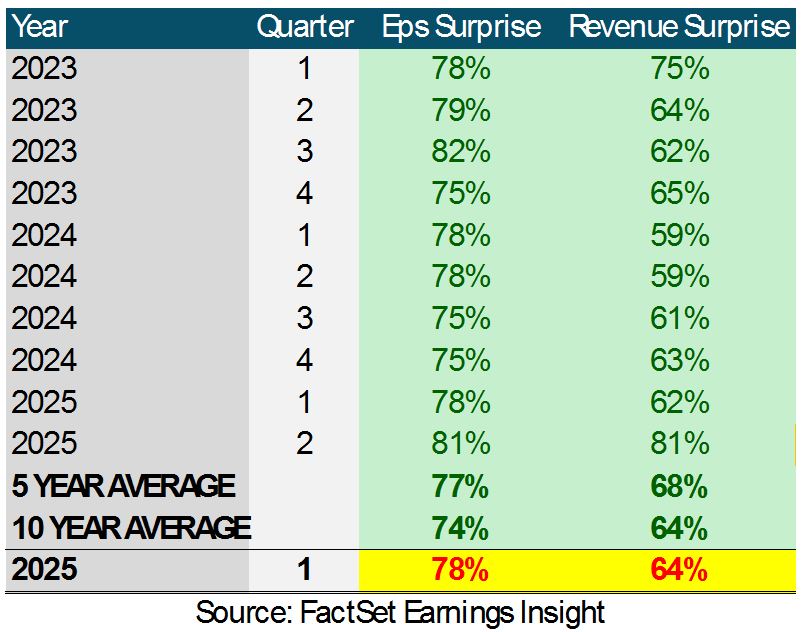
In Q2, 81% of S&P 500 companies beat both sales and earnings expectations. That far exceeds historical averages. Looking ahead, analysts expect continued positive surprises, partly because corporate guidance has been cautious. Tariffs and trade concerns were expected to drag profits down, but the reality has been far less severe than most had feared. And as more reports roll in, the case for optimism becomes clearer.
Graphs are for illustrative and discussion purposes only. Please read important disclosures at the end of this commentary.
Add fiscal policy, and the case strengthens. The “Big Beautiful Bill” promises lower taxes, directly improving margins. Combine that with cheaper financing, and profitability is set to expand.
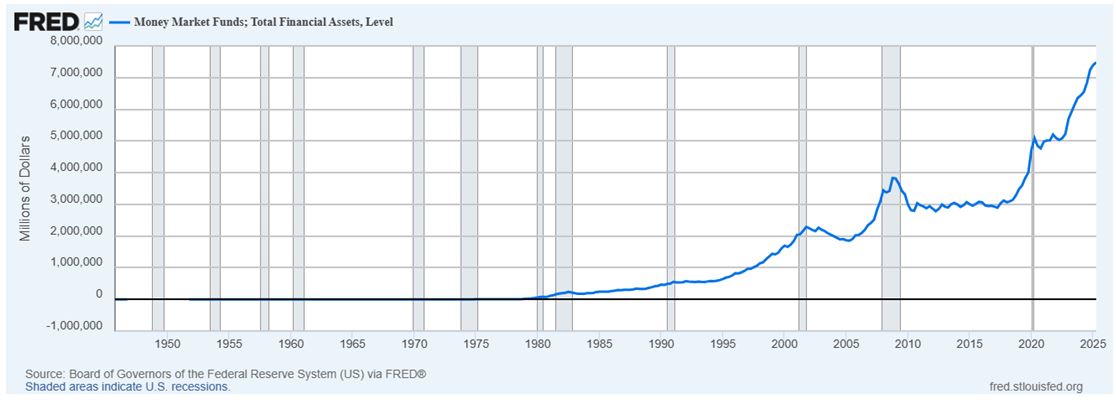
Nearly $7.5-trillion sits in money market funds. Those accounts have earned handsome yields during the rate-hike cycle, but their allure fades as rates fall. Why accept shrinking yields when equities are rising?
Graphs are for illustrative and discussion purposes only. Please read important disclosures at the end of this commentary.
This massive “wall of money” can fuel the next rally. As cash comes off the sidelines, it becomes rocket-fuel for stocks, so the question is not whether to be long equities, but which equities to own.
The answer starts with small-cap and mid-cap, the companies with the most ground to recover. They benefit disproportionately from falling-rates and lower-taxes. Smaller firms are more capital-sensitive than the giants. When borrowing costs fall and tax burdens ease, margins expand faster, fueling monster-growth.
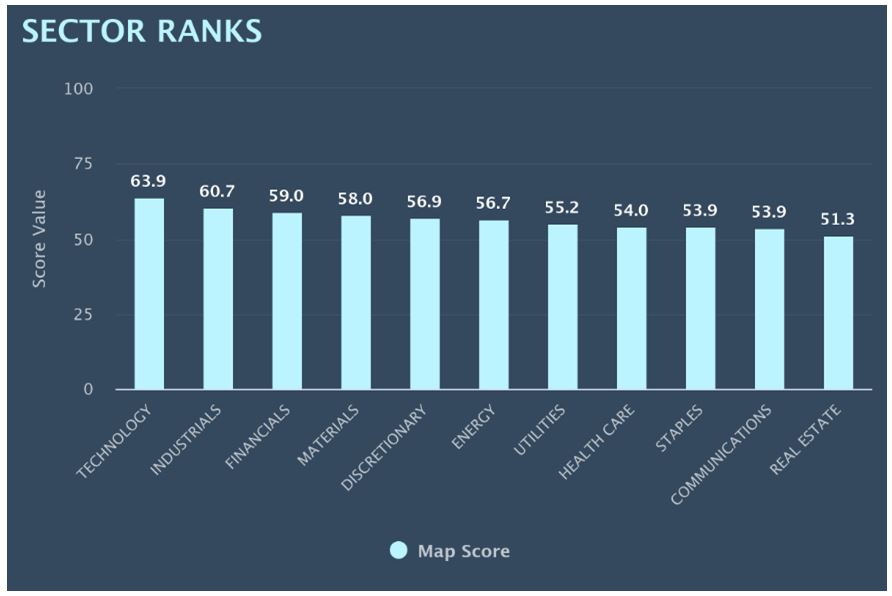
Sector Leadership
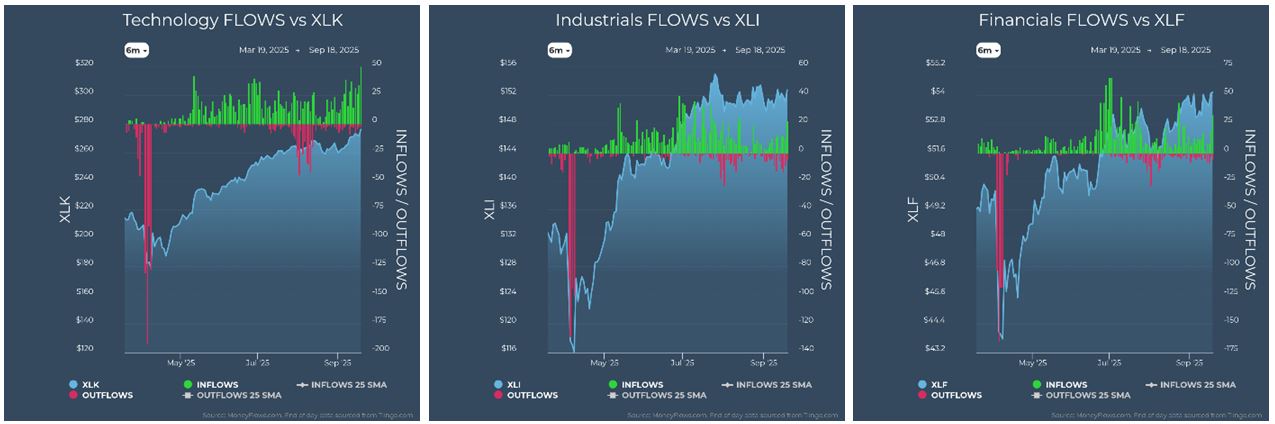
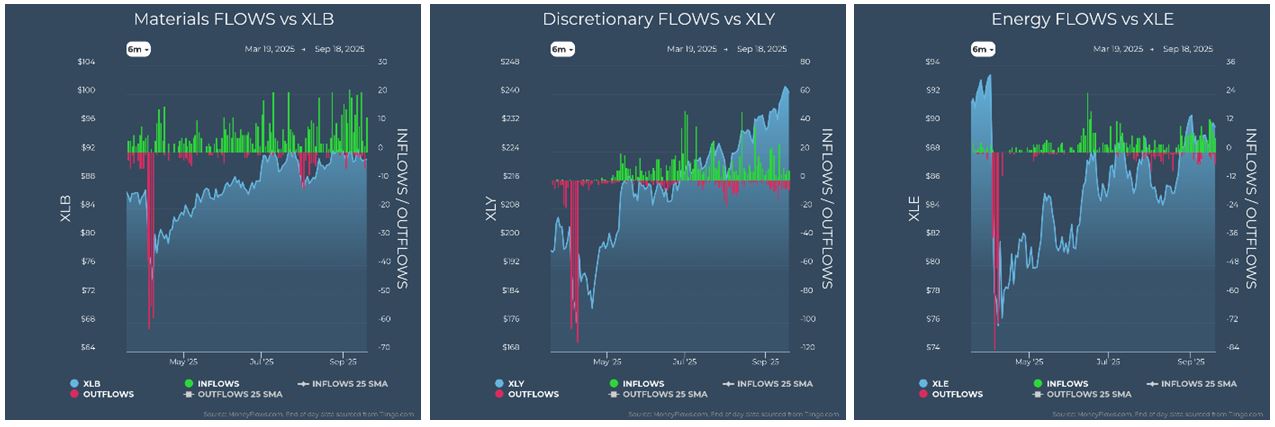
Technology, Discretionary, and Industrials – the engines of every bull-market – are all in gear. Technology underpins nearly everything – products, services, healthcare, and infrastructure. Discretionary spending reflects true consumer strength, while Industrials signal expansion in construction and manufacturing.
Graphs are for illustrative and discussion purposes only. Please read important disclosures at the end of this commentary.
Financials deserve equal attention. Falling rates loosen credit conditions, spurring more lending. Banks also benefit from renewed M&A activity, as companies seek expansion in friendlier monetary conditions.
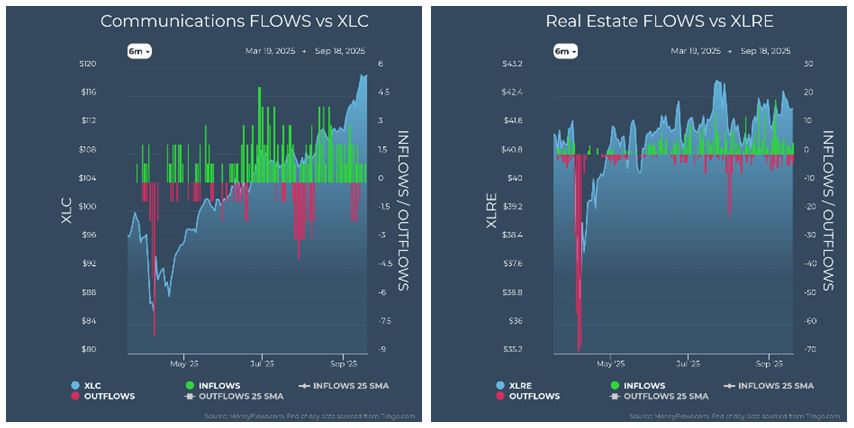
REITs also stand to gain. With their legal requirement to distribute 70% to 90% of profits as dividends, they become an appealing alternative for yield-seeking investors when money market returns shrink.
Money Flows Confirm the Picture
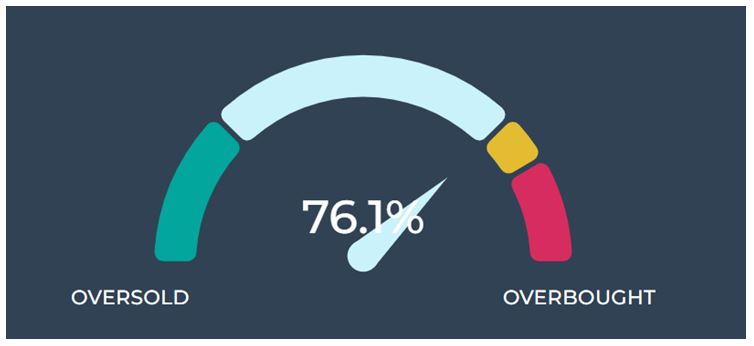
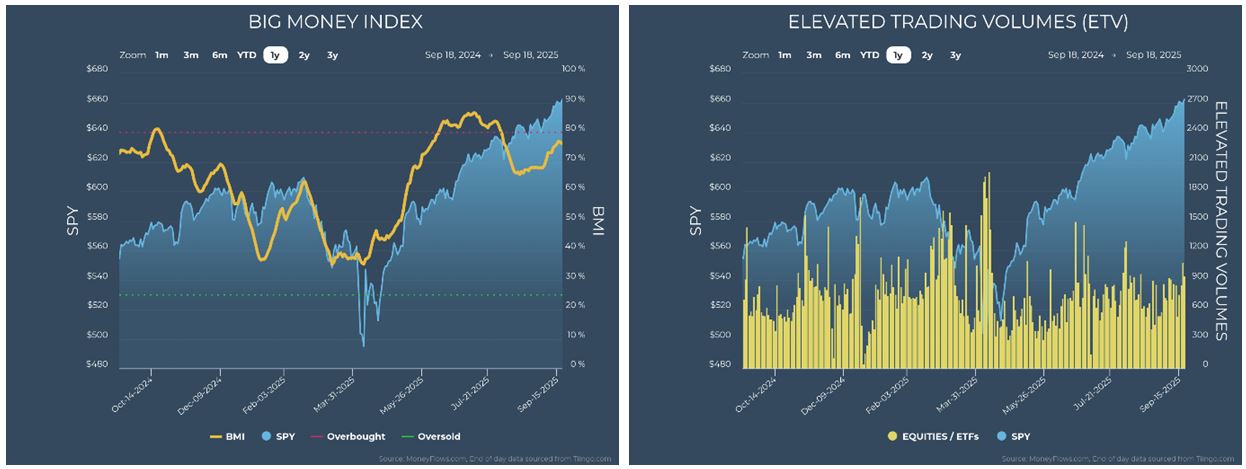
Institutional flows support the bullish backdrop. The Big Money Index (BMI) continues to rise. It’s now at 76%. Overbought is defined as 80%, but history shows that being overbought is no red-flag. After the CoVID crash, the BMI remained overbought for 87-trading days, all while the major markets surged.
We are not there yet, and even if we cross the 80% threshold, that would likely signal persistent strength.
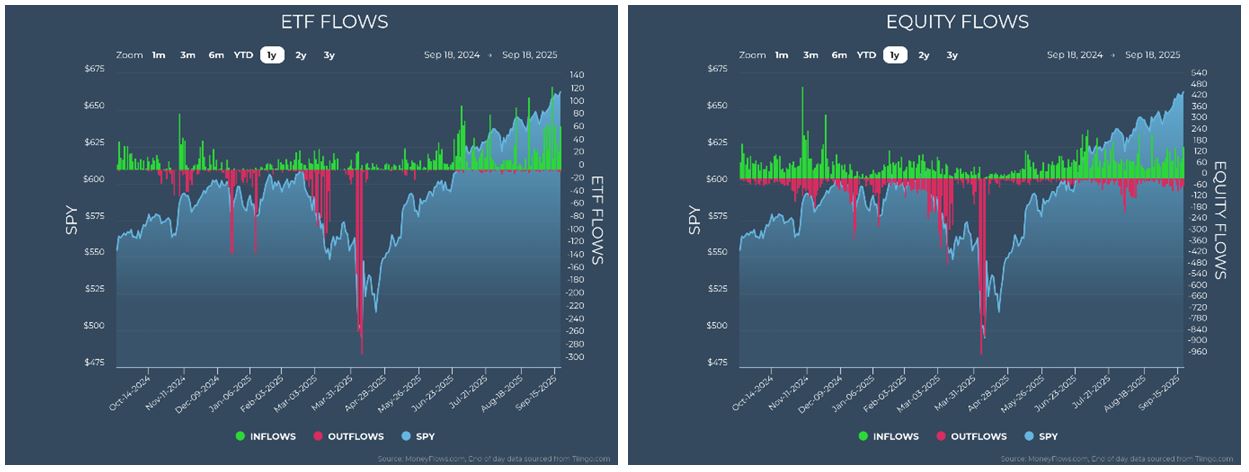
Equity flows remain positive. Outflows in August and early September were negligible. ETF inflows are climbing, reflecting broad participation. Elevated Trading Volumes confirm conviction, not hesitation.
Graphs are for illustrative and discussion purposes only. Please read important disclosures at the end of this commentary.
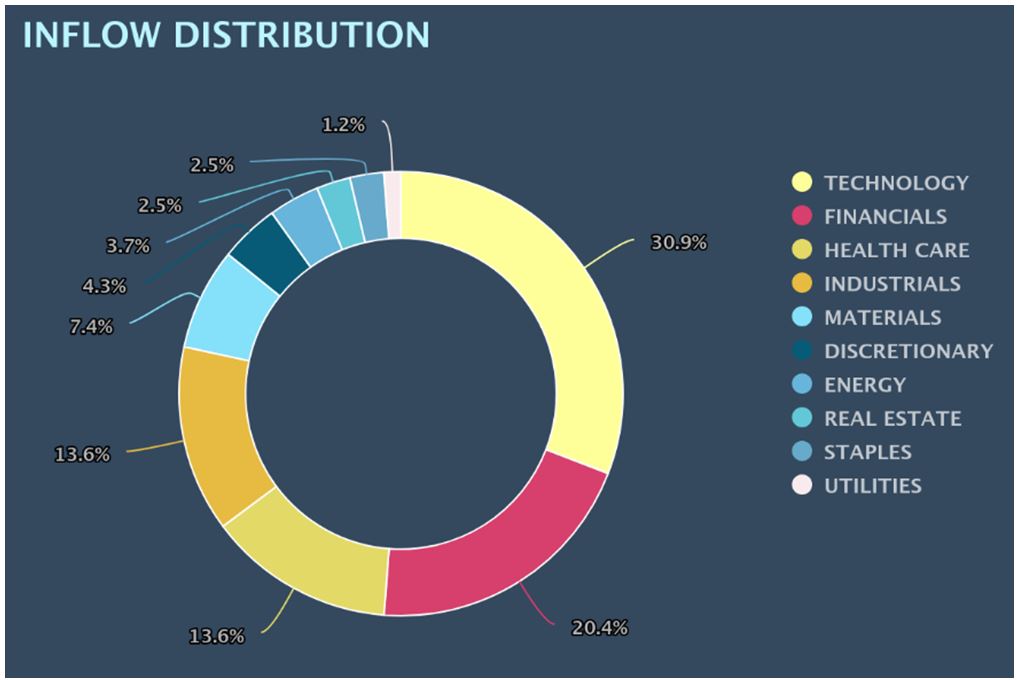
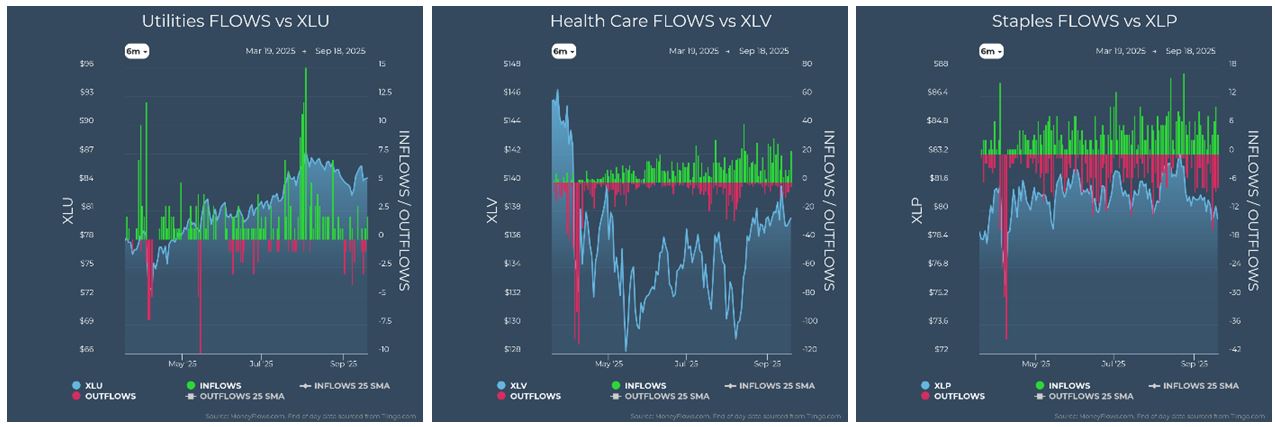
The sector breakdown is equally bullish. In September, the largest inflows have been into Technology, Financials, Healthcare, and Industrials. Healthcare, in particular, is interesting. Long left behind, it is finally lifting off six-month lows. The internal tug-of-war that kept it flat may be giving way to growth.
Graphs are for illustrative and discussion purposes only. Please read important disclosures at the end of this commentary.
Graphs are for illustrative and discussion purposes only. Please read important disclosures at the end of this commentary.
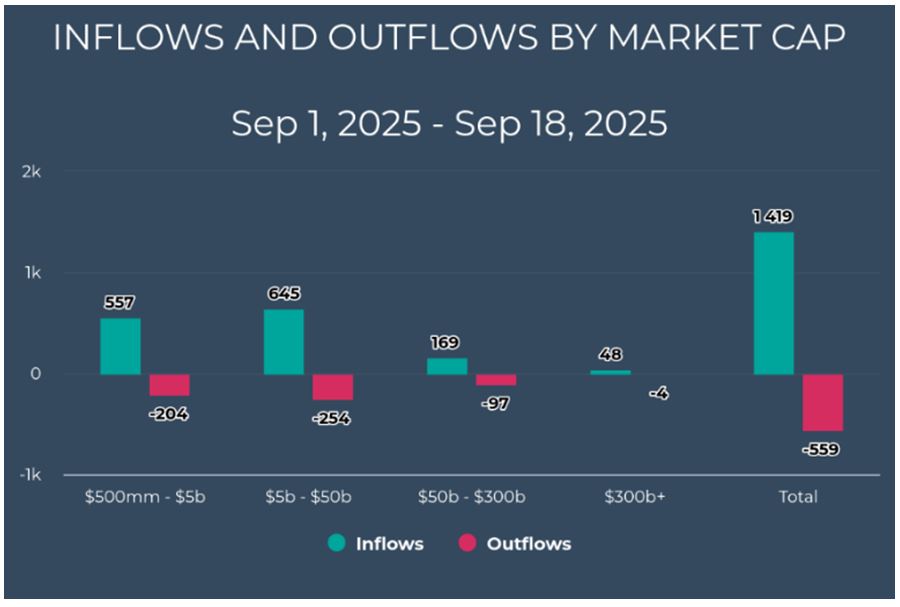
Within the sectors, most inflows are going into smaller companies. Since September 1st, 85% of inflows have gone into firms under $50-billion in market cap, with 39.3% in the $500-million to $5-billion range and 45.5% in $5-billion to $50-billion range. This indicates small-cap and mid-caps (not mega-caps) are leading the way.
Graphs are for illustrative and discussion purposes only. Please read important disclosures at the end of this commentary.
Put it all together, and the setup is extraordinary. Rates are falling, taxes are easing, earnings are beating, and $7.5-trillion in cash is waiting to move. Sector leadership is in the right places. Institutional flows are overwhelmingly positive. Even seasonal headwinds have vanished. The market is not just strong, it’s accelerating into what could be one of the most bullish setups in decades.
Bamboo forests seem to appear overnight, but their growth is the result of deep roots and fertile conditions. Markets work the same way. This rally is not magic. It is the product of policy shifts, strong earnings, cash positioning and broad flows all working in harmony.
As Seneca reminds us: “Luck is what happens when preparation meets opportunity.” Investors prepared with facts, discipline, and optimism are poised to find not just luck, but lasting success.
Which side will you be on when this forest of opportunity takes shape?
All content above represents the opinion of Jason Bodner of Navellier & Associates, Inc.
Also In This Issue
A Look Ahead by Louis Navellier
The Case for More Interest Rate Cuts in 2025
Income Mail by Bryan Perry
Russell 2000 Delivers Broad-Based Rally Confirmation
Growth Mail by Gary Alexander
In Market Lingo, a “Fall” (Season) Means a Rise (in Stocks)
Global Mail by Ivan Martchev
We’re In “Thin-Air” Territory in the U.S. Stock Market
Sector Spotlight by Jason Bodner
Welcome to the “Bamboo” Market
View Full Archive
Read Past Issues Here

Jason Bodner
MARKETMAIL EDITOR FOR SECTOR SPOTLIGHT
Jason Bodner writes Sector Spotlight in the weekly Marketmail publication and has authored several white papers for the company. He is also Co-Founder of Macro Analytics for Professionals which produces proprietary equity accumulation and distribution research for its clients. Previously, Mr. Bodner served as Director of European Equity Derivatives for Cantor Fitzgerald Europe in London, then moved to the role of Head of Equity Derivatives North America for the same company in New York. He also served as S.V.P. Equity Derivatives for Jefferies, LLC. He received a B.S. in business administration in 1996, with honors, from Skidmore College as a member of the Periclean Honors Society. All content of “Sector Spotlight” represents the opinion of Jason Bodner
Important Disclosures:
Jason Bodner is a co-founder and co-owner of Mapsignals. Mr. Bodner is an independent contractor who is occasionally hired by Navellier & Associates to write an article and or provide opinions for possible use in articles that appear in Navellier & Associates weekly Market Mail. Mr. Bodner is not employed or affiliated with Louis Navellier, Navellier & Associates, Inc., or any other Navellier owned entity. The opinions and statements made here are those of Mr. Bodner and not necessarily those of any other persons or entities. This is not an endorsement, or solicitation or testimonial or investment advice regarding the BMI Index or any statements or recommendations or analysis in the article or the BMI Index or Mapsignals or its products or strategies.
Although information in these reports has been obtained from and is based upon sources that Navellier believes to be reliable, Navellier does not guarantee its accuracy and it may be incomplete or condensed. All opinions and estimates constitute Navellier’s judgment as of the date the report was created and are subject to change without notice. These reports are for informational purposes only and are not a solicitation for the purchase or sale of a security. Any decision to purchase securities mentioned in these reports must take into account existing public information on such securities or any registered prospectus.To the extent permitted by law, neither Navellier & Associates, Inc., nor any of its affiliates, agents, or service providers assumes any liability or responsibility nor owes any duty of care for any consequences of any person acting or refraining to act in reliance on the information contained in this communication or for any decision based on it.
Past performance is no indication of future results. Investment in securities involves significant risk and has the potential for partial or complete loss of funds invested. It should not be assumed that any securities recommendations made by Navellier. in the future will be profitable or equal the performance of securities made in this report. Dividend payments are not guaranteed. The amount of a dividend payment, if any, can vary over time and issuers may reduce dividends paid on securities in the event of a recession or adverse event affecting a specific industry or issuer.
None of the stock information, data, and company information presented herein constitutes a recommendation by Navellier or a solicitation to buy or sell any securities. Any specific securities identified and described do not represent all of the securities purchased, sold, or recommended for advisory clients. The holdings identified do not represent all of the securities purchased, sold, or recommended for advisory clients and the reader should not assume that investments in the securities identified and discussed were or will be profitable.
Information presented is general information that does not take into account your individual circumstances, financial situation, or needs, nor does it present a personalized recommendation to you. Individual stocks presented may not be suitable for every investor. Investment in securities involves significant risk and has the potential for partial or complete loss of funds invested. Investment in fixed income securities has the potential for the investment return and principal value of an investment to fluctuate so that an investor’s holdings, when redeemed, may be worth less than their original cost.
One cannot invest directly in an index. Index is unmanaged and index performance does not reflect deduction of fees, expenses, or taxes. Presentation of Index data does not reflect a belief by Navellier that any stock index constitutes an investment alternative to any Navellier equity strategy or is necessarily comparable to such strategies. Among the most important differences between the Indices and Navellier strategies are that the Navellier equity strategies may (1) incur material management fees, (2) concentrate its investments in relatively few stocks, industries, or sectors, (3) have significantly greater trading activity and related costs, and (4) be significantly more or less volatile than the Indices.
ETF Risk: We may invest in exchange traded funds (“ETFs”) and some of our investment strategies are generally fully invested in ETFs. Like traditional mutual funds, ETFs charge asset-based fees, but they generally do not charge initial sales charges or redemption fees and investors typically pay only customary brokerage fees to buy and sell ETF shares. The fees and costs charged by ETFs held in client accounts will not be deducted from the compensation the client pays Navellier. ETF prices can fluctuate up or down, and a client account could lose money investing in an ETF if the prices of the securities owned by the ETF go down. ETFs are subject to additional risks:
- ETF shares may trade above or below their net asset value;
- An active trading market for an ETF’s shares may not develop or be maintained;
- The value of an ETF may be more volatile than the underlying portfolio of securities the ETF is designed to track;
- The cost of owning shares of the ETF may exceed those a client would incur by directly investing in the underlying securities and;
- Trading of an ETF’s shares may be halted if the listing exchange’s officials deem it appropriate, the shares are delisted from the exchange, or the activation of market-wide “circuit breakers” (which are tied to large decreases in stock prices) halts stock trading generally.
Grader Disclosures: Investment in equity strategies involves substantial risk and has the potential for partial or complete loss of funds invested. The sample portfolio and any accompanying charts are for informational purposes only and are not to be construed as a solicitation to buy or sell any financial instrument and should not be relied upon as the sole factor in an investment making decision. As a matter of normal and important disclosures to you, as a potential investor, please consider the following: The performance presented is not based on any actual securities trading, portfolio, or accounts, and the reported performance of the A, B, C, D, and F portfolios (collectively the “model portfolios”) should be considered mere “paper” or pro forma performance results based on Navellier’s research.
Investors evaluating any of Navellier & Associates, Inc.’s, (or its affiliates’) Investment Products must not use any information presented here, including the performance figures of the model portfolios, in their evaluation of any Navellier Investment Products. Navellier Investment Products include the firm’s mutual funds and managed accounts. The model portfolios, charts, and other information presented do not represent actual funded trades and are not actual funded portfolios. There are material differences between Navellier Investment Products’ portfolios and the model portfolios, research, and performance figures presented here. The model portfolios and the research results (1) may contain stocks or ETFs that are illiquid and difficult to trade; (2) may contain stock or ETF holdings materially different from actual funded Navellier Investment Product portfolios; (3) include the reinvestment of all dividends and other earnings, estimated trading costs, commissions, or management fees; and, (4) may not reflect prices obtained in an actual funded Navellier Investment Product portfolio. For these and other reasons, the reported performances of model portfolios do not reflect the performance results of Navellier’s actually funded and traded Investment Products. In most cases, Navellier’s Investment Products have materially lower performance results than the performances of the model portfolios presented.
This report contains statements that are, or may be considered to be, forward-looking statements. All statements that are not historical facts, including statements about our beliefs or expectations, are “forward-looking statements” within the meaning of The U.S. Private Securities Litigation Reform Act of 1995. These statements may be identified by such forward-looking terminology as “expect,” “estimate,” “plan,” “intend,” “believe,” “anticipate,” “may,” “will,” “should,” “could,” “continue,” “project,” or similar statements or variations of such terms. Our forward-looking statements are based on a series of expectations, assumptions, and projections, are not guarantees of future results or performance, and involve substantial risks and uncertainty as described in Form ADV Part 2A of our filing with the Securities and Exchange Commission (SEC), which is available at www.adviserinfo.sec.gov or by requesting a copy by emailing info@navellier.com. All of our forward-looking statements are as of the date of this report only. We can give no assurance that such expectations or forward-looking statements will prove to be correct. Actual results may differ materially. You are urged to carefully consider all such factors.
FEDERAL TAX ADVICE DISCLAIMER: As required by U.S. Treasury Regulations, you are informed that, to the extent this presentation includes any federal tax advice, the presentation is not written by Navellier to be used, and cannot be used, for the purpose of avoiding federal tax penalties. Navellier does not advise on any income tax requirements or issues. Use of any information presented by Navellier is for general information only and does not represent tax advice either express or implied. You are encouraged to seek professional tax advice for income tax questions and assistance.
IMPORTANT NEWSLETTER DISCLOSURE:The hypothetical performance results for investment newsletters that are authored or edited by Louis Navellier, including Louis Navellier’s Growth Investor, Louis Navellier’s Breakthrough Stocks, Louis Navellier’s Accelerated Profits, and Louis Navellier’s Platinum Club, are not based on any actual securities trading, portfolio, or accounts, and the newsletters’ reported hypothetical performances should be considered mere “paper” or proforma hypothetical performance results and are not actual performance of real world trades. Navellier & Associates, Inc. does not have any relation to or affiliation with the owner of these newsletters. There are material differences between Navellier Investment Products’ portfolios and the InvestorPlace Media, LLC newsletter portfolios authored by Louis Navellier. The InvestorPlace Media, LLC newsletters contain hypothetical performance that do not include transaction costs, advisory fees, or other fees a client might incur if actual investments and trades were being made by an investor. As a result, newsletter performance should not be used to evaluate Navellier Investment services which are separate and different from the newsletters. The owner of the newsletters is InvestorPlace Media, LLC and any questions concerning the newsletters, including any newsletter advertising or hypothetical Newsletter performance claims, (which are calculated solely by Investor Place Media and not Navellier) should be referred to InvestorPlace Media, LLC at (800) 718-8289.
Please note that Navellier & Associates and the Navellier Private Client Group are managed completely independent of the newsletters owned and published by InvestorPlace Media, LLC and written and edited by Louis Navellier, and investment performance of the newsletters should in no way be considered indicative of potential future investment performance for any Navellier & Associates separately managed account portfolio. Potential investors should consult with their financial advisor before investing in any Navellier Investment Product.
Navellier claims compliance with Global Investment Performance Standards (GIPS). To receive a complete list and descriptions of Navellier’s composites and/or a presentation that adheres to the GIPS standards, please contact Navellier or click here. It should not be assumed that any securities recommendations made by Navellier & Associates, Inc. in the future will be profitable or equal the performance of securities made in this report.
FactSet Disclosure: Navellier does not independently calculate the statistical information included in the attached report. The calculation and the information are provided by FactSet, a company not related to Navellier. Although information contained in the report has been obtained from FactSet and is based on sources Navellier believes to be reliable, Navellier does not guarantee its accuracy, and it may be incomplete or condensed. The report and the related FactSet sourced information are provided on an “as is” basis. The user assumes the entire risk of any use made of this information. Investors should consider the report as only a single factor in making their investment decision. The report is for informational purposes only and is not intended as an offer or solicitation for the purchase or sale of a security. FactSet sourced information is the exclusive property of FactSet. Without prior written permission of FactSet, this information may not be reproduced, disseminated or used to create any financial products. All indices are unmanaged and performance of the indices include reinvestment of dividends and interest income, unless otherwise noted, are not illustrative of any particular investment and an investment cannot be made in any index. Past performance is no guarantee of future results.