by Jason Bodner
July 22, 2025
I wonder… if the average lifespan of a housefly is only two weeks, does that feel like a lifetime to them?
According to scientists, animals experience time differently from humans. The smaller the animal, the more slowly time feels to them, compared to humans. For example, flies experience time more slowly than salamanders, which in turn feel time slower than a dog, and so on, up to humans. And humans feel time faster than a Greenland shark, which can live hundreds of years. This is because the perception of time depends on how quickly the brain can process all the relevant incoming information.
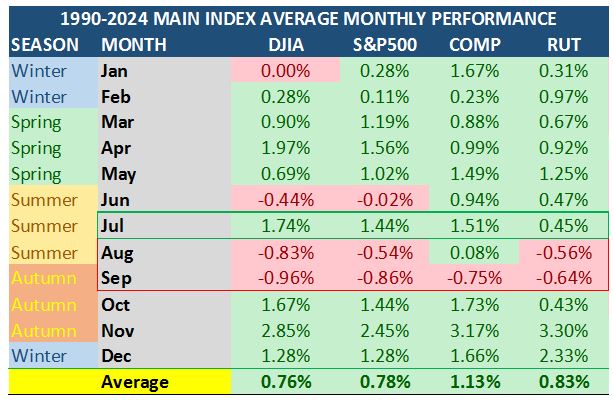
Likewise, history tells us that markets move higher during cold months and fall in warmer months. This was once expressed as “Sell in May and Go Away.” More recently, July caps off the strongest period for stocks, after which stocks take the late summer off. History tells us that perhaps investors should, too.
“Market time” during August and September passes slowly for bullish investors, as the weaker “dog days” of August tend to recall those “lazy days of summer.” But as volatility typically amps up, usually in late September, things tend to happen more quickly. Stocks whip around and violent moves are expected.
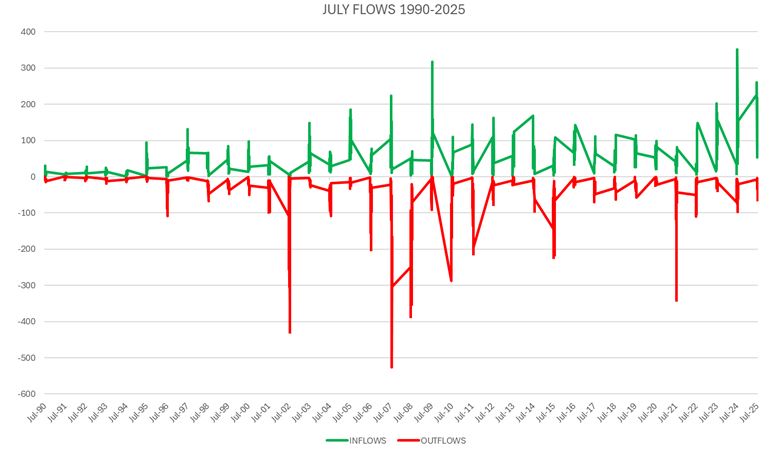
Markets can act fast or slowly. It’s complicated. Looking at the market data since 1990 (below), we can see that July is typically very strong. So far, we’ve enjoyed a great July for stocks, but we’ve now entered the second half of July, and you can clearly see we should not expect much from August and September:
Graphs are for illustrative and discussion purposes only. Please read important disclosures at the end of this commentary.
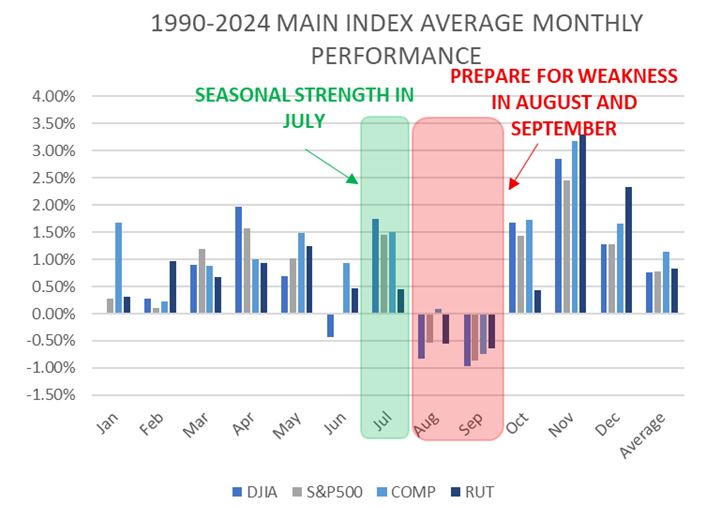
July is the third best month (behind November and April) in the Dow and S&P 500 since 1990, while August and September are the two worst months of the year since 1990, as shown clearly here:
Graphs are for illustrative and discussion purposes only. Please read important disclosures at the end of this commentary.
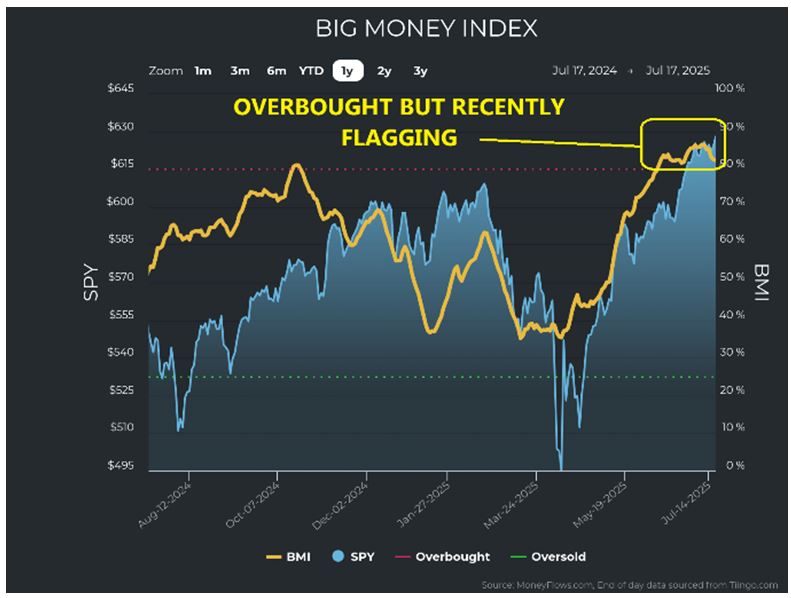
No one has a crystal ball, but we can consult reliable indicators to take the temperature of the market. The Big Money Index (BMI) tells us we are certainly overheated. It has been overbought for 26-days – longer than the average 22-days for all overbought periods since 1990 – and it has recently taken a turn lower:
Graphs are for illustrative and discussion purposes only. Please read important disclosures at the end of this commentary.
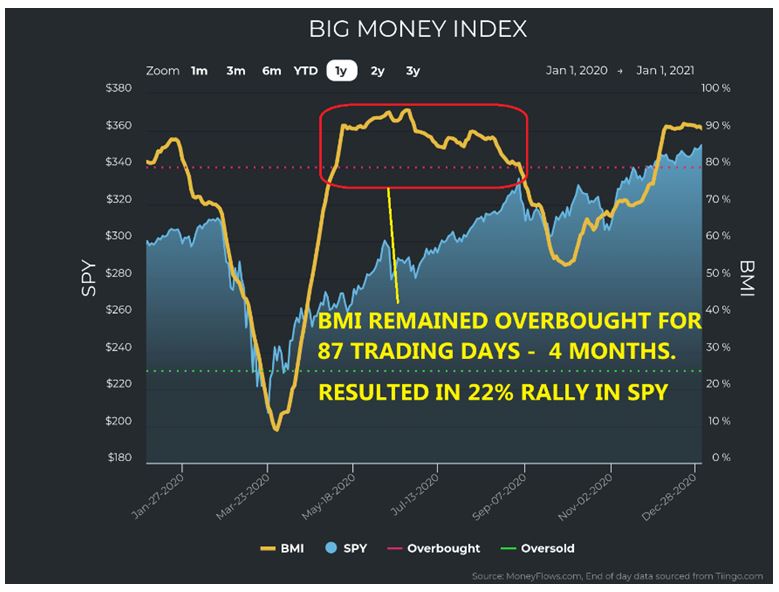
Don’t mistake this for a sign to exit stocks out of any panic. The BMI can stay overbought for a protracted period. This is what happened post-COVID, when it remained overbought for 87-trading days – 4 months!
This is important because, had you exited all stocks when stocks went oversold, you would have missed a 22% rally in the S&P 500. Some stocks trade with more volatility than others, which creates the concept of “beta.” A simple way of thinking about beta is this: If your portfolio trades with a beta of 2.0 vs. the S&P 500, you would expect your stock to rise or fall twice as much as the index. So, if you owned stocks with a high beta exited too soon, while the market kept rising, you might have left up to 44% on the table!
Graphs are for illustrative and discussion purposes only. Please read important disclosures at the end of this commentary.
The key to sensing when a falling BMI becomes dangerous is to look for intensifying outflows. That’s not something we have seen yet. On both of these charts – of equity and ETF flows – all we observe is a fall-off from intense inflows. We see too few recent “red streaks” in the either chart to sound any alarms.
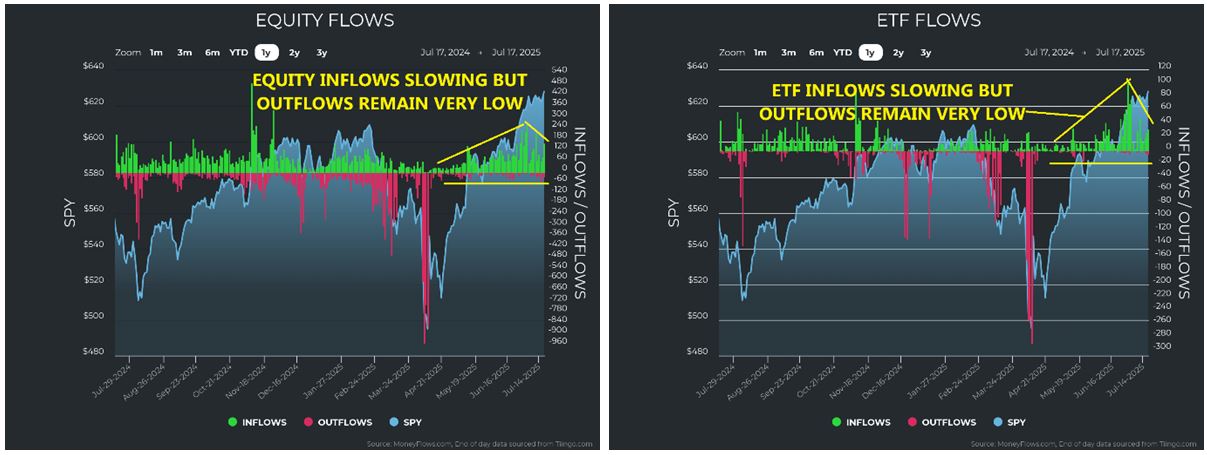
Graphs are for illustrative and discussion purposes only. Please read important disclosures at the end of this commentary.
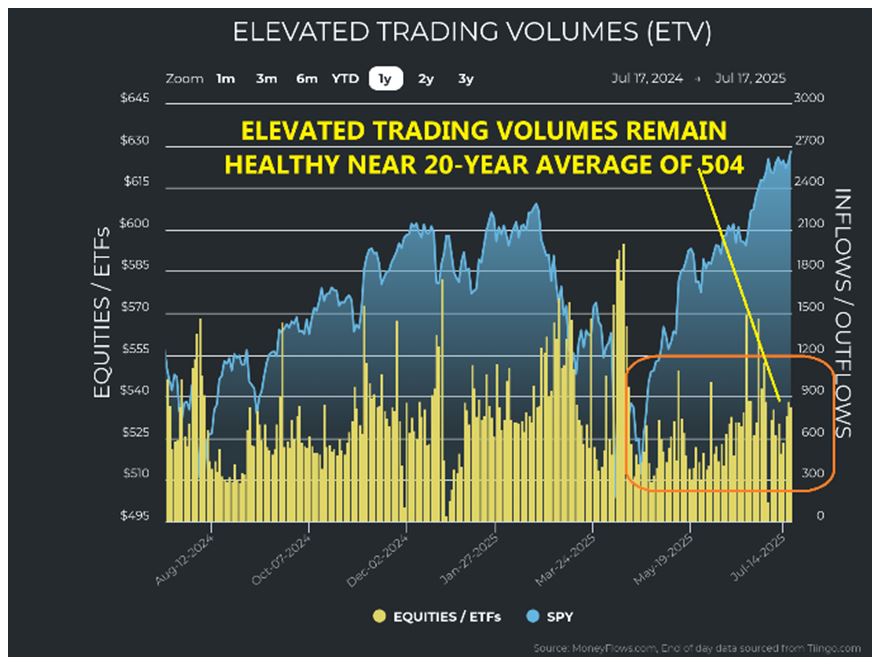
We also observe that volume remains healthy and have not dried up:
Graphs are for illustrative and discussion purposes only. Please read important disclosures at the end of this commentary.
To summarize: the BMI is overbought, but inflows remain healthy, and outflows are nowhere to be seen.
And all this is happening on normal-sized volumes of unusual trades.
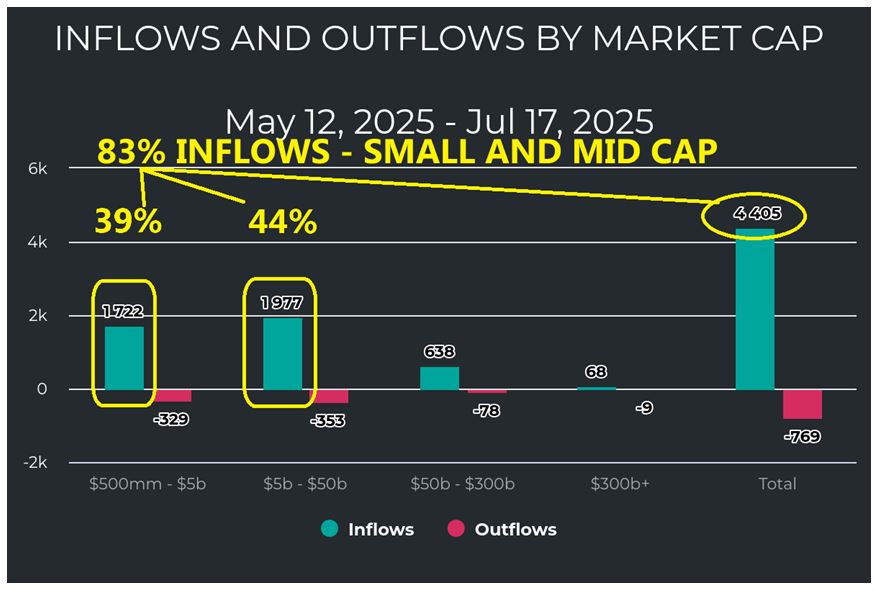
It is also important to know that since May 12th, when President Trump delayed tariffs, inflows have dominated, and when we track where that money has been going, the bullish narrative strengthens: Funds has been flying overwhelmingly into small-cap and mid-cap stocks, which account for 83% of all inflows:
Graphs are for illustrative and discussion purposes only. Please read important disclosures at the end of this commentary.
This reflects aggressive risk-on investor behavior. Normally, during times of fear, investors dump risk and clamor for safety in lower volatility large-cap stocks, but that is not the case here.
Now, when we look at the 11 S&P sectors, we see that money has been moving into traditional growth areas. Looking at sector strength and weakness, we see growth-heavy sectors like technology, industrials, and discretionary have been vaulting to the top of the list from the bottom during the April lows:
![]()
Graphs are for illustrative and discussion purposes only. Please read important disclosures at the end of this commentary.
This becomes crystal clear when we look at money flows in each of the individual sectors. The first thing we see is that all 11-sectors are seeing more inflows than outflows. In some sectors, there seem to be no outflows to speak of. Comparing sectors, we see that the most intense inflows have been in 8 of the 11: Industrials, Technology, Financials, Communications, Discretionary, Materials, Energy, and Real Estate.
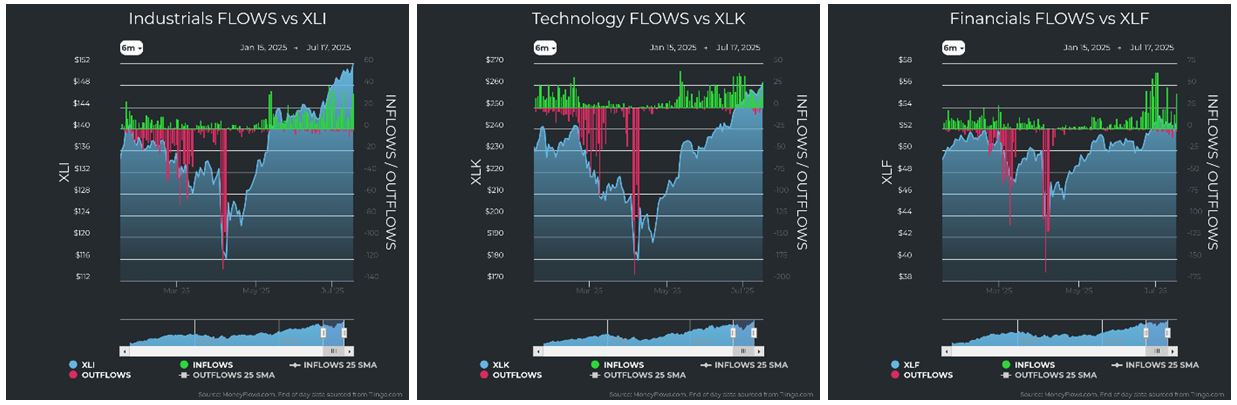
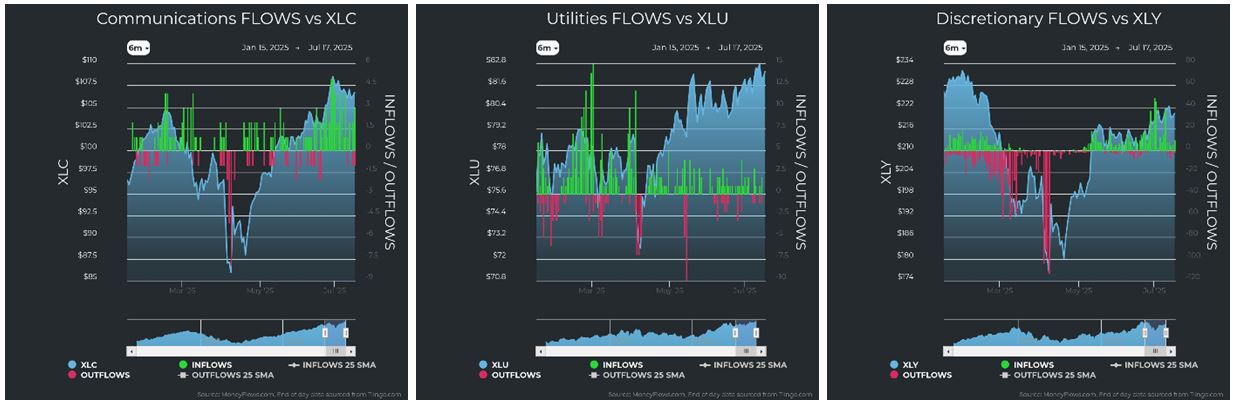
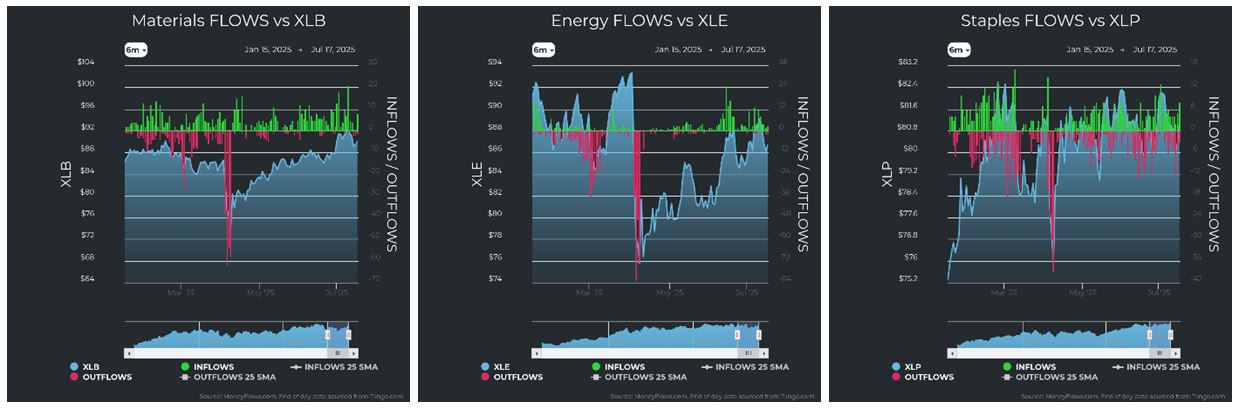
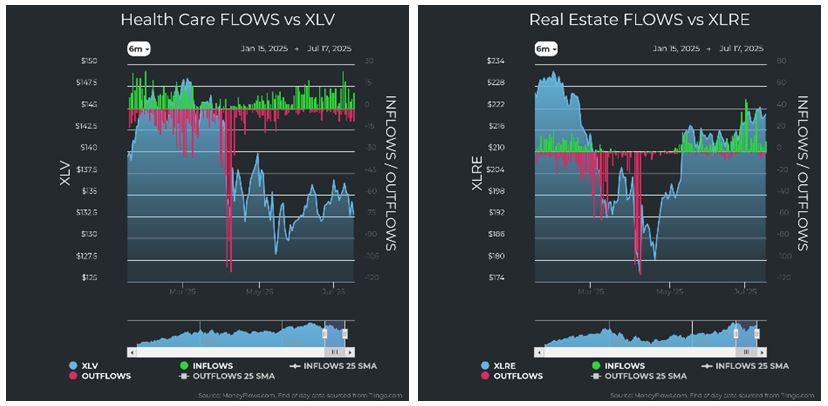
Graphs are for illustrative and discussion purposes only. Please read important disclosures at the end of this commentary.
Finally, I looked at all of the past third-quarter months (all Julys, Augusts and Septembers) since 1990. The charts below may resemble hieroglyphics at first glance, but what is important is the patterns. The main pattern is that July often has more inflows than outflows. July also has more green than August or September. That makes sense: July has more inflows, since it is a strong month, historically speaking:
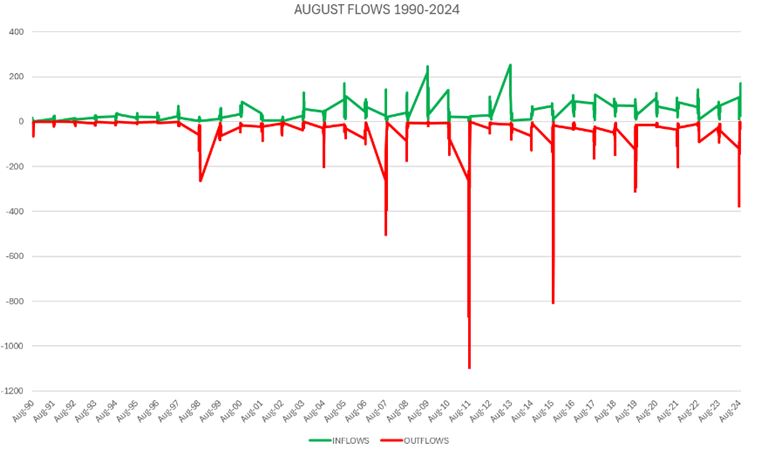
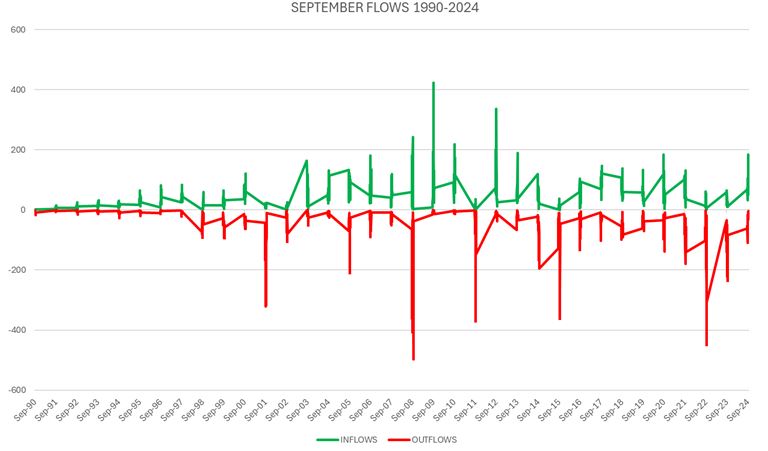
Graphs are for illustrative and discussion purposes only. Please read important disclosures at the end of this commentary.
Augusts and Septembers show more red than July, and August clearly has more red than green, on balance, so as a quantitative analyst and part-time stock market weatherman, here is my summer forecast:
The weather is beautiful now and, if nothing changes, we should see two more weeks of sunny skies and low humidity. It’s perfectly sweet summer weather, but August and September are at the start of hurricane season, when storms tend to increase, so let’s be prepared. I am trimming some positions in the final weeks of July. I am taking profits on old and stalling positions and taking some small losses, using profits to offset losses and exit positions for a net profit. I am raising cash and reducing any portfolio “bloat” in order to have some fresh capital to buy into seasonal market weakness, fully expecting the fourth quarter to show us historical strength – which it has been doing since 1990.
This analysis confirms the fact that the data often tell different stories than the news. But don’t miss the great weather now by worrying about tomorrow. History says we will be fine, either way.
Or, as Marcus Aurelius said, “Never let the future disturb you. You will meet it, if you have to, with the same weapons of reason which today arm you against the present.”
All content above represents the opinion of Jason Bodner of Navellier & Associates, Inc.
Also In This Issue
A Look Ahead by Louis Navellier
Inflation Rates Remain Low, But the Fed Fears “Phantom Inflation”
Income Mail by Bryan Perry
An Eventful 10-Days Await Both Bulls and Bears
Growth Mail by Gary Alexander
More Investment Lessons after Nearly 60-Years in the Game (Part 2)
Global Mail by Ivan Martchev
Too Many Irons Remain in the Trade War Fire
Sector Spotlight by Jason Bodner
Making Time “Slow Down” in a Fast-Moving Market
View Full Archive
Read Past Issues Here

Jason Bodner
MARKETMAIL EDITOR FOR SECTOR SPOTLIGHT
Jason Bodner writes Sector Spotlight in the weekly Marketmail publication and has authored several white papers for the company. He is also Co-Founder of Macro Analytics for Professionals which produces proprietary equity accumulation and distribution research for its clients. Previously, Mr. Bodner served as Director of European Equity Derivatives for Cantor Fitzgerald Europe in London, then moved to the role of Head of Equity Derivatives North America for the same company in New York. He also served as S.V.P. Equity Derivatives for Jefferies, LLC. He received a B.S. in business administration in 1996, with honors, from Skidmore College as a member of the Periclean Honors Society. All content of “Sector Spotlight” represents the opinion of Jason Bodner
Important Disclosures:
Jason Bodner is a co-founder and co-owner of Mapsignals. Mr. Bodner is an independent contractor who is occasionally hired by Navellier & Associates to write an article and or provide opinions for possible use in articles that appear in Navellier & Associates weekly Market Mail. Mr. Bodner is not employed or affiliated with Louis Navellier, Navellier & Associates, Inc., or any other Navellier owned entity. The opinions and statements made here are those of Mr. Bodner and not necessarily those of any other persons or entities. This is not an endorsement, or solicitation or testimonial or investment advice regarding the BMI Index or any statements or recommendations or analysis in the article or the BMI Index or Mapsignals or its products or strategies.
Although information in these reports has been obtained from and is based upon sources that Navellier believes to be reliable, Navellier does not guarantee its accuracy and it may be incomplete or condensed. All opinions and estimates constitute Navellier’s judgment as of the date the report was created and are subject to change without notice. These reports are for informational purposes only and are not a solicitation for the purchase or sale of a security. Any decision to purchase securities mentioned in these reports must take into account existing public information on such securities or any registered prospectus.To the extent permitted by law, neither Navellier & Associates, Inc., nor any of its affiliates, agents, or service providers assumes any liability or responsibility nor owes any duty of care for any consequences of any person acting or refraining to act in reliance on the information contained in this communication or for any decision based on it.
Past performance is no indication of future results. Investment in securities involves significant risk and has the potential for partial or complete loss of funds invested. It should not be assumed that any securities recommendations made by Navellier. in the future will be profitable or equal the performance of securities made in this report. Dividend payments are not guaranteed. The amount of a dividend payment, if any, can vary over time and issuers may reduce dividends paid on securities in the event of a recession or adverse event affecting a specific industry or issuer.
None of the stock information, data, and company information presented herein constitutes a recommendation by Navellier or a solicitation to buy or sell any securities. Any specific securities identified and described do not represent all of the securities purchased, sold, or recommended for advisory clients. The holdings identified do not represent all of the securities purchased, sold, or recommended for advisory clients and the reader should not assume that investments in the securities identified and discussed were or will be profitable.
Information presented is general information that does not take into account your individual circumstances, financial situation, or needs, nor does it present a personalized recommendation to you. Individual stocks presented may not be suitable for every investor. Investment in securities involves significant risk and has the potential for partial or complete loss of funds invested. Investment in fixed income securities has the potential for the investment return and principal value of an investment to fluctuate so that an investor’s holdings, when redeemed, may be worth less than their original cost.
One cannot invest directly in an index. Index is unmanaged and index performance does not reflect deduction of fees, expenses, or taxes. Presentation of Index data does not reflect a belief by Navellier that any stock index constitutes an investment alternative to any Navellier equity strategy or is necessarily comparable to such strategies. Among the most important differences between the Indices and Navellier strategies are that the Navellier equity strategies may (1) incur material management fees, (2) concentrate its investments in relatively few stocks, industries, or sectors, (3) have significantly greater trading activity and related costs, and (4) be significantly more or less volatile than the Indices.
ETF Risk: We may invest in exchange traded funds (“ETFs”) and some of our investment strategies are generally fully invested in ETFs. Like traditional mutual funds, ETFs charge asset-based fees, but they generally do not charge initial sales charges or redemption fees and investors typically pay only customary brokerage fees to buy and sell ETF shares. The fees and costs charged by ETFs held in client accounts will not be deducted from the compensation the client pays Navellier. ETF prices can fluctuate up or down, and a client account could lose money investing in an ETF if the prices of the securities owned by the ETF go down. ETFs are subject to additional risks:
- ETF shares may trade above or below their net asset value;
- An active trading market for an ETF’s shares may not develop or be maintained;
- The value of an ETF may be more volatile than the underlying portfolio of securities the ETF is designed to track;
- The cost of owning shares of the ETF may exceed those a client would incur by directly investing in the underlying securities and;
- Trading of an ETF’s shares may be halted if the listing exchange’s officials deem it appropriate, the shares are delisted from the exchange, or the activation of market-wide “circuit breakers” (which are tied to large decreases in stock prices) halts stock trading generally.
Grader Disclosures: Investment in equity strategies involves substantial risk and has the potential for partial or complete loss of funds invested. The sample portfolio and any accompanying charts are for informational purposes only and are not to be construed as a solicitation to buy or sell any financial instrument and should not be relied upon as the sole factor in an investment making decision. As a matter of normal and important disclosures to you, as a potential investor, please consider the following: The performance presented is not based on any actual securities trading, portfolio, or accounts, and the reported performance of the A, B, C, D, and F portfolios (collectively the “model portfolios”) should be considered mere “paper” or pro forma performance results based on Navellier’s research.
Investors evaluating any of Navellier & Associates, Inc.’s, (or its affiliates’) Investment Products must not use any information presented here, including the performance figures of the model portfolios, in their evaluation of any Navellier Investment Products. Navellier Investment Products include the firm’s mutual funds and managed accounts. The model portfolios, charts, and other information presented do not represent actual funded trades and are not actual funded portfolios. There are material differences between Navellier Investment Products’ portfolios and the model portfolios, research, and performance figures presented here. The model portfolios and the research results (1) may contain stocks or ETFs that are illiquid and difficult to trade; (2) may contain stock or ETF holdings materially different from actual funded Navellier Investment Product portfolios; (3) include the reinvestment of all dividends and other earnings, estimated trading costs, commissions, or management fees; and, (4) may not reflect prices obtained in an actual funded Navellier Investment Product portfolio. For these and other reasons, the reported performances of model portfolios do not reflect the performance results of Navellier’s actually funded and traded Investment Products. In most cases, Navellier’s Investment Products have materially lower performance results than the performances of the model portfolios presented.
This report contains statements that are, or may be considered to be, forward-looking statements. All statements that are not historical facts, including statements about our beliefs or expectations, are “forward-looking statements” within the meaning of The U.S. Private Securities Litigation Reform Act of 1995. These statements may be identified by such forward-looking terminology as “expect,” “estimate,” “plan,” “intend,” “believe,” “anticipate,” “may,” “will,” “should,” “could,” “continue,” “project,” or similar statements or variations of such terms. Our forward-looking statements are based on a series of expectations, assumptions, and projections, are not guarantees of future results or performance, and involve substantial risks and uncertainty as described in Form ADV Part 2A of our filing with the Securities and Exchange Commission (SEC), which is available at www.adviserinfo.sec.gov or by requesting a copy by emailing info@navellier.com. All of our forward-looking statements are as of the date of this report only. We can give no assurance that such expectations or forward-looking statements will prove to be correct. Actual results may differ materially. You are urged to carefully consider all such factors.
FEDERAL TAX ADVICE DISCLAIMER: As required by U.S. Treasury Regulations, you are informed that, to the extent this presentation includes any federal tax advice, the presentation is not written by Navellier to be used, and cannot be used, for the purpose of avoiding federal tax penalties. Navellier does not advise on any income tax requirements or issues. Use of any information presented by Navellier is for general information only and does not represent tax advice either express or implied. You are encouraged to seek professional tax advice for income tax questions and assistance.
IMPORTANT NEWSLETTER DISCLOSURE:The hypothetical performance results for investment newsletters that are authored or edited by Louis Navellier, including Louis Navellier’s Growth Investor, Louis Navellier’s Breakthrough Stocks, Louis Navellier’s Accelerated Profits, and Louis Navellier’s Platinum Club, are not based on any actual securities trading, portfolio, or accounts, and the newsletters’ reported hypothetical performances should be considered mere “paper” or proforma hypothetical performance results and are not actual performance of real world trades. Navellier & Associates, Inc. does not have any relation to or affiliation with the owner of these newsletters. There are material differences between Navellier Investment Products’ portfolios and the InvestorPlace Media, LLC newsletter portfolios authored by Louis Navellier. The InvestorPlace Media, LLC newsletters contain hypothetical performance that do not include transaction costs, advisory fees, or other fees a client might incur if actual investments and trades were being made by an investor. As a result, newsletter performance should not be used to evaluate Navellier Investment services which are separate and different from the newsletters. The owner of the newsletters is InvestorPlace Media, LLC and any questions concerning the newsletters, including any newsletter advertising or hypothetical Newsletter performance claims, (which are calculated solely by Investor Place Media and not Navellier) should be referred to InvestorPlace Media, LLC at (800) 718-8289.
Please note that Navellier & Associates and the Navellier Private Client Group are managed completely independent of the newsletters owned and published by InvestorPlace Media, LLC and written and edited by Louis Navellier, and investment performance of the newsletters should in no way be considered indicative of potential future investment performance for any Navellier & Associates separately managed account portfolio. Potential investors should consult with their financial advisor before investing in any Navellier Investment Product.
Navellier claims compliance with Global Investment Performance Standards (GIPS). To receive a complete list and descriptions of Navellier’s composites and/or a presentation that adheres to the GIPS standards, please contact Navellier or click here. It should not be assumed that any securities recommendations made by Navellier & Associates, Inc. in the future will be profitable or equal the performance of securities made in this report.
FactSet Disclosure: Navellier does not independently calculate the statistical information included in the attached report. The calculation and the information are provided by FactSet, a company not related to Navellier. Although information contained in the report has been obtained from FactSet and is based on sources Navellier believes to be reliable, Navellier does not guarantee its accuracy, and it may be incomplete or condensed. The report and the related FactSet sourced information are provided on an “as is” basis. The user assumes the entire risk of any use made of this information. Investors should consider the report as only a single factor in making their investment decision. The report is for informational purposes only and is not intended as an offer or solicitation for the purchase or sale of a security. FactSet sourced information is the exclusive property of FactSet. Without prior written permission of FactSet, this information may not be reproduced, disseminated or used to create any financial products. All indices are unmanaged and performance of the indices include reinvestment of dividends and interest income, unless otherwise noted, are not illustrative of any particular investment and an investment cannot be made in any index. Past performance is no guarantee of future results.