by Jason Bodner
April 29, 2025
Survival is encoded into our DNA and affects everything we do at a deep subconscious level.
Some animals have wild ways of reacting to life-or-death situations. Opossums fake their death out of fright. They go full catatonic when threatened. A carpenter ant, when all hope seems lost, will suck in its abdomen and explode toxins out toward their predator – the ultimate self-destructive last act of defiance.
Eels use electricity. Skunks use odor. Humans, however, often don’t know what to do. Sometimes we lash out in an emotional rage. Other times we freeze in indecision. Most of the time we overthink the crisis.
Markets are a great arena for facing other, more serious, life-or-death situations. That’s because our emotions are so deeply entangled with our money. Anyone reading this knows that when portfolios go down, we logically think that’s a buying opportunity, but emotionally we feel defeated. We’re confused.
So far this year, we’ve been confused quite a lot of the time.
The headlines seem to contradict each other, sometimes within the very same minute. Trade deals are imminent, or tariffs are raised, depending on the time of day. Businesses are failing or poised for success.
Markets are just as turbulent, and seeing through the thick fog of uncertainty seems impossible. This wicked new form of volatility is unsettling, uncomfortable, and at the top of the minds of most investors.
Will the future be bleak or bright? Stormy or serene?
It’s hard to not act according to our emotions – by the heart or the gut – in stomach-churning situations like now, but I find that our emotions are a reactionary survival instinct, a relic of our evolutionary past.
It has never worked for me. In fact, decision making using my gut has almost always led me to lose.
When I look for answers, I look at unemotional data. I prefer analysis and letting history be a possible — even probable – guide to what might come next.
I know this is an unpopular position, but my forecast is for sunny skies. Looking to the horizon I see:
- Higher equity prices
- Trade and tariff resolution
- Lower interest rates
- Lower taxes
- …and I see all of this happening by the fall, if not earlier
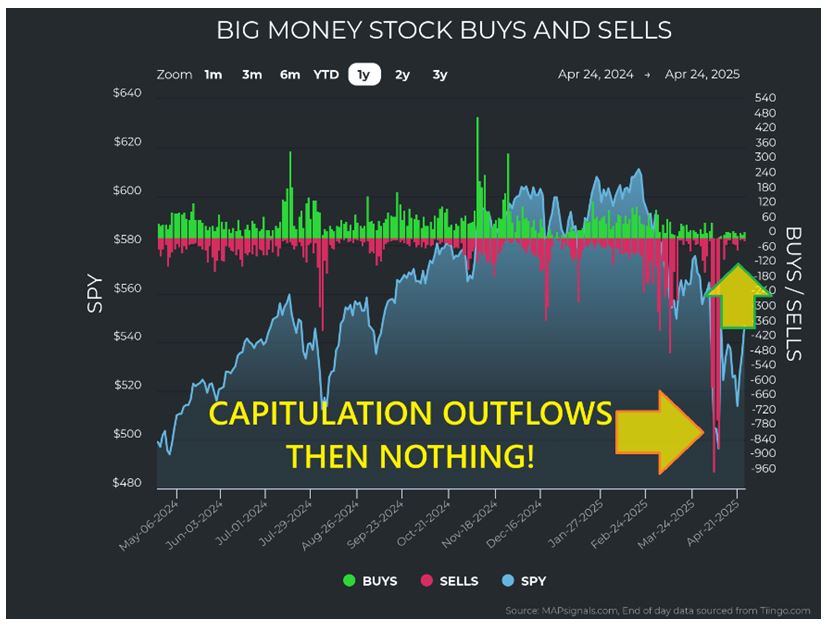
First let’s visit the data: What caused the market destruction from mid-February to early April is painfully obvious to me. I’ll show you what capitulation looks like, and why it was fueled by margin calls.
First, let’s check in on the Big Money Index (BMI). It plummeted hard. But before it could go “over-sold” on us, the storm suddenly passed and those elevated out-flows just vanished, like a tornado passing by.

Graphs are for illustrative and discussion purposes only. Please read important disclosures at the end of this commentary.
This becomes obvious when we look at daily outflows and inflows: Red bars explode and then vanish:
Graphs are for illustrative and discussion purposes only. Please read important disclosures at the end of this commentary.
Now here comes the practical angle: Should we sell and buy during these rapid swings? Perhaps some geniuses can time these short switches, but I didn’t sell. Nor did my family, neighbors, friends, or anyone I know. I’m willing to bet most of you didn’t sell, either. So, who did? The answer lies in margin calls.
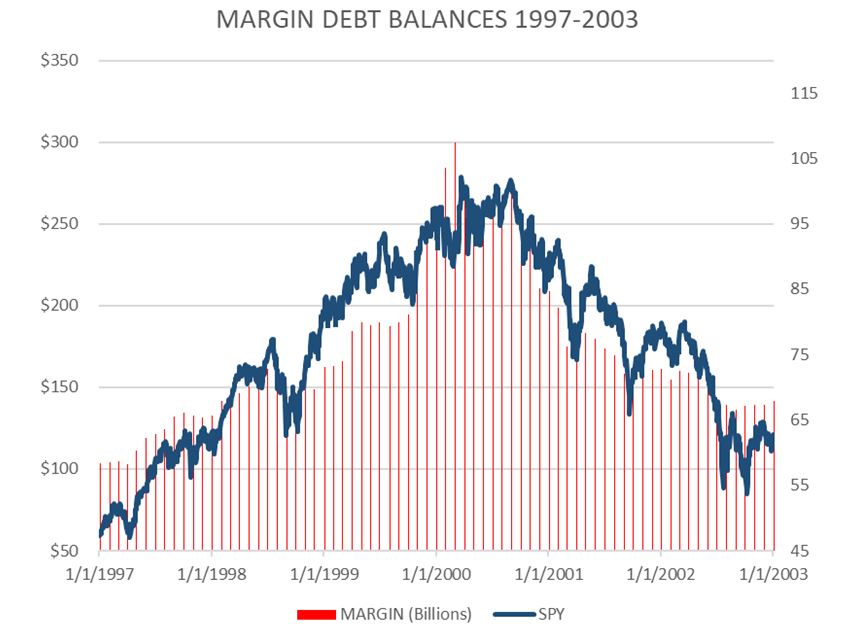
We historically see a pattern in margin debt balances correlated with market performance.
Here is how debt unwinding looked three times, first when the late 1990s internet-bubble popped:
Graphs are for illustrative and discussion purposes only. Please read important disclosures at the end of this commentary.
The blue line is the SPY (S&P 500 tracking ETF) and the red line is the dollar amount of credit extended to clients by broker in the form of margin. Notice as it rises, the market rises? And when it falls – so too does the market in lockstep? Here is a second chart, this time from the 2008 Great Financial Crisis:

Graphs are for illustrative and discussion purposes only. Please read important disclosures at the end of this commentary.
As uncertainty wanes, the market recovers. It looks almost fueled by the extension of additional margin. This happened starting in 2003, fueling the long bull-run until 2008. Then it picked up again in 2009.
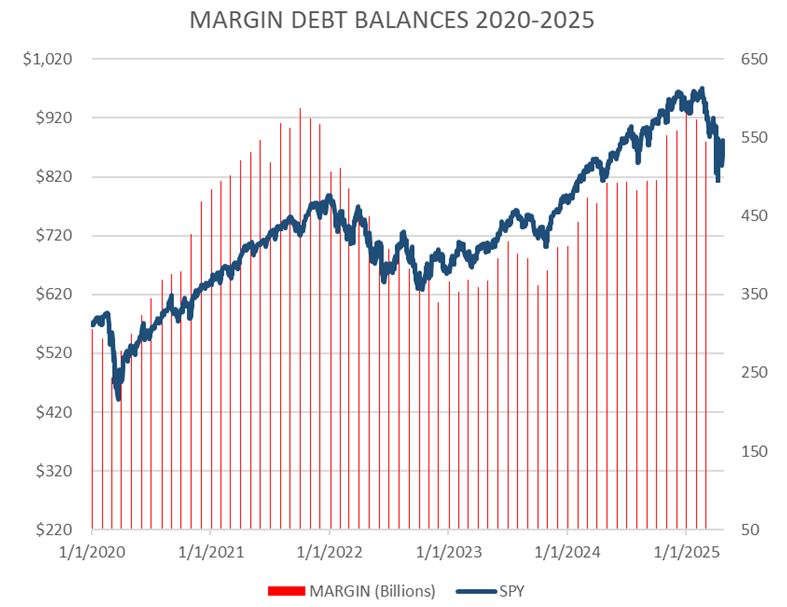
Now we come to the latest example. You can see COVID-19 on the left of the chart. It was a swift collapse of equity prices, almost certainly correlated to margin calls. Then to the right, you can see the latest equity land-slide occurred with a reduction in margin retreating from record levels in January.
Graphs are for illustrative and discussion purposes only. Please read important disclosures at the end of this commentary.
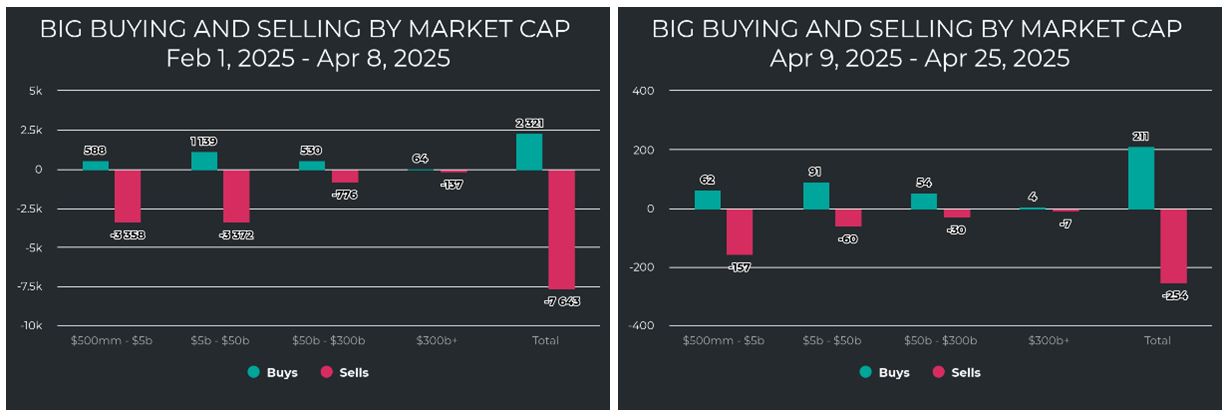
Margin fell 6% from January 2025’s all-time high of $937-billion to March’s $880-billion. Certainly, April’s will show a lower number. That is what “forced-selling” looks like. Hedge funds and other investors use leverage to try and beat markets. Tariffs threw an un-modelled wrench into the works, which caused brokers to quickly tighten the credit spigot. This forced liquidations – like it or not. We clearly see the difference comparing outflows from February through the market low compared to after:”
Graphs are for illustrative and discussion purposes only. Please read important disclosures at the end of this commentary.
I have already supplied many studies in this column showing why we should expect positive returns for stocks from here on out, based on similar past market conditions. Volatility should subside and current uncertainty should resolve. Wall Street will eventually find a new fear, but let’s summarize those studies:


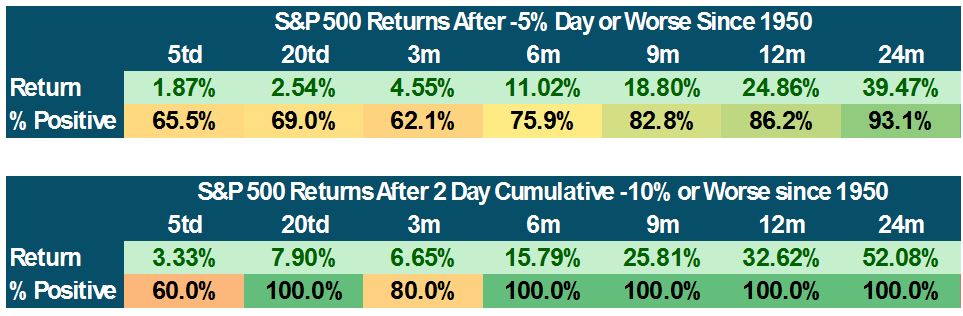

Graphs are for illustrative and discussion purposes only. Please read important disclosures at the end of this commentary.
These studies of past similar situations tell us that markets similar to now look great going forward.
We can say: “This time it’s different”, but every time was different. A global pandemic, housing market collapse, and terrorist attack were each very different circumstances, but also very similar, emotionally.
We already see signs of a broad-based recovery in a market bouncing back from its lows, and we also see a very welcome recovery in every S&P sector:
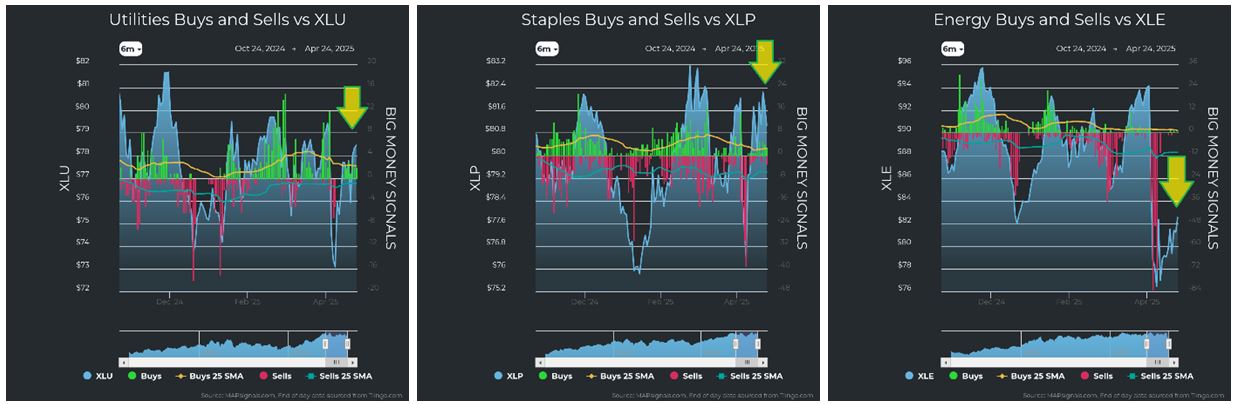
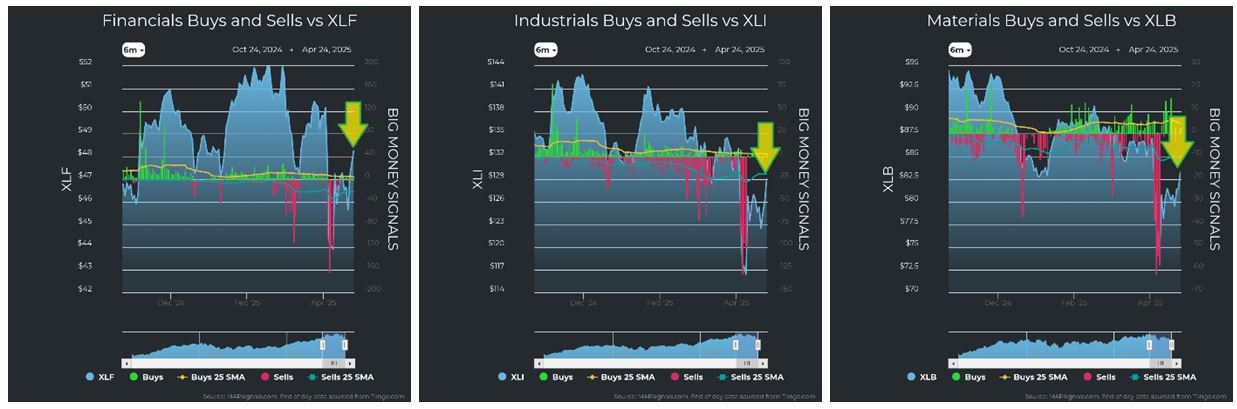
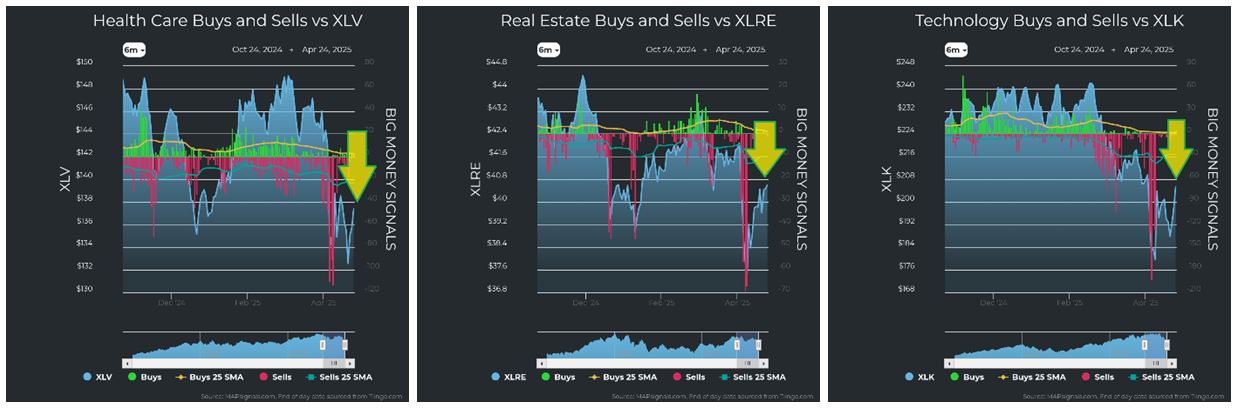

Graphs are for illustrative and discussion purposes only. Please read important disclosures at the end of this commentary.
That uniformity of recovery is further indication of a margin-based correction. My belief is that President Trump must wrap up this whole trade restructuring within the next few months – this year, before mid-term election campaigning begins. He can’t risk losing Republican control of the House or Senate.
We already have indications that most countries are willing to negotiate. I saw headlines that India will lower tariffs and more importantly China is easing some tariffs and introduced some exemptions. This is simultaneous to reading that China won’t deal at all until the US lifts reciprocal tariffs! It’s all confusing.
Which brings us to my first point. The best thing we can do now is not run for the hills. Cashing out and waiting for better times is counter-intuitive and could be destructive. Instead, identify great businesses trading at lower prices. Buy low and reap the rewards years from now. That is the basis of investing.
“Success is survival.” – Leonard Cohen
All content above represents the opinion of Jason Bodner of Navellier & Associates, Inc.
Also In This Issue
A Look Ahead by Louis Navellier
Tariffs Are Melting Away, But China Remains Stubborn
Income Mail by Bryan Perry
The Fed Should Act Next Week, With a Preemptive Rate Cut
Growth Mail by Gary Alexander
Downbeat Sentiment (and Magazine Covers) are Contrarian Buy Signals
Global Mail by Ivan Martchev
The Stock Market is Sniffing Out More Trade Deals
Sector Spotlight by Jason Bodner
Survival Techniques in a Confusing Market Year
View Full Archive
Read Past Issues Here

Jason Bodner
MARKETMAIL EDITOR FOR SECTOR SPOTLIGHT
Jason Bodner writes Sector Spotlight in the weekly Marketmail publication and has authored several white papers for the company. He is also Co-Founder of Macro Analytics for Professionals which produces proprietary equity accumulation and distribution research for its clients. Previously, Mr. Bodner served as Director of European Equity Derivatives for Cantor Fitzgerald Europe in London, then moved to the role of Head of Equity Derivatives North America for the same company in New York. He also served as S.V.P. Equity Derivatives for Jefferies, LLC. He received a B.S. in business administration in 1996, with honors, from Skidmore College as a member of the Periclean Honors Society. All content of “Sector Spotlight” represents the opinion of Jason Bodner
Important Disclosures:
Jason Bodner is a co-founder and co-owner of Mapsignals. Mr. Bodner is an independent contractor who is occasionally hired by Navellier & Associates to write an article and or provide opinions for possible use in articles that appear in Navellier & Associates weekly Market Mail. Mr. Bodner is not employed or affiliated with Louis Navellier, Navellier & Associates, Inc., or any other Navellier owned entity. The opinions and statements made here are those of Mr. Bodner and not necessarily those of any other persons or entities. This is not an endorsement, or solicitation or testimonial or investment advice regarding the BMI Index or any statements or recommendations or analysis in the article or the BMI Index or Mapsignals or its products or strategies.
Although information in these reports has been obtained from and is based upon sources that Navellier believes to be reliable, Navellier does not guarantee its accuracy and it may be incomplete or condensed. All opinions and estimates constitute Navellier’s judgment as of the date the report was created and are subject to change without notice. These reports are for informational purposes only and are not a solicitation for the purchase or sale of a security. Any decision to purchase securities mentioned in these reports must take into account existing public information on such securities or any registered prospectus.To the extent permitted by law, neither Navellier & Associates, Inc., nor any of its affiliates, agents, or service providers assumes any liability or responsibility nor owes any duty of care for any consequences of any person acting or refraining to act in reliance on the information contained in this communication or for any decision based on it.
Past performance is no indication of future results. Investment in securities involves significant risk and has the potential for partial or complete loss of funds invested. It should not be assumed that any securities recommendations made by Navellier. in the future will be profitable or equal the performance of securities made in this report. Dividend payments are not guaranteed. The amount of a dividend payment, if any, can vary over time and issuers may reduce dividends paid on securities in the event of a recession or adverse event affecting a specific industry or issuer.
None of the stock information, data, and company information presented herein constitutes a recommendation by Navellier or a solicitation to buy or sell any securities. Any specific securities identified and described do not represent all of the securities purchased, sold, or recommended for advisory clients. The holdings identified do not represent all of the securities purchased, sold, or recommended for advisory clients and the reader should not assume that investments in the securities identified and discussed were or will be profitable.
Information presented is general information that does not take into account your individual circumstances, financial situation, or needs, nor does it present a personalized recommendation to you. Individual stocks presented may not be suitable for every investor. Investment in securities involves significant risk and has the potential for partial or complete loss of funds invested. Investment in fixed income securities has the potential for the investment return and principal value of an investment to fluctuate so that an investor’s holdings, when redeemed, may be worth less than their original cost.
One cannot invest directly in an index. Index is unmanaged and index performance does not reflect deduction of fees, expenses, or taxes. Presentation of Index data does not reflect a belief by Navellier that any stock index constitutes an investment alternative to any Navellier equity strategy or is necessarily comparable to such strategies. Among the most important differences between the Indices and Navellier strategies are that the Navellier equity strategies may (1) incur material management fees, (2) concentrate its investments in relatively few stocks, industries, or sectors, (3) have significantly greater trading activity and related costs, and (4) be significantly more or less volatile than the Indices.
ETF Risk: We may invest in exchange traded funds (“ETFs”) and some of our investment strategies are generally fully invested in ETFs. Like traditional mutual funds, ETFs charge asset-based fees, but they generally do not charge initial sales charges or redemption fees and investors typically pay only customary brokerage fees to buy and sell ETF shares. The fees and costs charged by ETFs held in client accounts will not be deducted from the compensation the client pays Navellier. ETF prices can fluctuate up or down, and a client account could lose money investing in an ETF if the prices of the securities owned by the ETF go down. ETFs are subject to additional risks:
- ETF shares may trade above or below their net asset value;
- An active trading market for an ETF’s shares may not develop or be maintained;
- The value of an ETF may be more volatile than the underlying portfolio of securities the ETF is designed to track;
- The cost of owning shares of the ETF may exceed those a client would incur by directly investing in the underlying securities and;
- Trading of an ETF’s shares may be halted if the listing exchange’s officials deem it appropriate, the shares are delisted from the exchange, or the activation of market-wide “circuit breakers” (which are tied to large decreases in stock prices) halts stock trading generally.
Grader Disclosures: Investment in equity strategies involves substantial risk and has the potential for partial or complete loss of funds invested. The sample portfolio and any accompanying charts are for informational purposes only and are not to be construed as a solicitation to buy or sell any financial instrument and should not be relied upon as the sole factor in an investment making decision. As a matter of normal and important disclosures to you, as a potential investor, please consider the following: The performance presented is not based on any actual securities trading, portfolio, or accounts, and the reported performance of the A, B, C, D, and F portfolios (collectively the “model portfolios”) should be considered mere “paper” or pro forma performance results based on Navellier’s research.
Investors evaluating any of Navellier & Associates, Inc.’s, (or its affiliates’) Investment Products must not use any information presented here, including the performance figures of the model portfolios, in their evaluation of any Navellier Investment Products. Navellier Investment Products include the firm’s mutual funds and managed accounts. The model portfolios, charts, and other information presented do not represent actual funded trades and are not actual funded portfolios. There are material differences between Navellier Investment Products’ portfolios and the model portfolios, research, and performance figures presented here. The model portfolios and the research results (1) may contain stocks or ETFs that are illiquid and difficult to trade; (2) may contain stock or ETF holdings materially different from actual funded Navellier Investment Product portfolios; (3) include the reinvestment of all dividends and other earnings, estimated trading costs, commissions, or management fees; and, (4) may not reflect prices obtained in an actual funded Navellier Investment Product portfolio. For these and other reasons, the reported performances of model portfolios do not reflect the performance results of Navellier’s actually funded and traded Investment Products. In most cases, Navellier’s Investment Products have materially lower performance results than the performances of the model portfolios presented.
This report contains statements that are, or may be considered to be, forward-looking statements. All statements that are not historical facts, including statements about our beliefs or expectations, are “forward-looking statements” within the meaning of The U.S. Private Securities Litigation Reform Act of 1995. These statements may be identified by such forward-looking terminology as “expect,” “estimate,” “plan,” “intend,” “believe,” “anticipate,” “may,” “will,” “should,” “could,” “continue,” “project,” or similar statements or variations of such terms. Our forward-looking statements are based on a series of expectations, assumptions, and projections, are not guarantees of future results or performance, and involve substantial risks and uncertainty as described in Form ADV Part 2A of our filing with the Securities and Exchange Commission (SEC), which is available at www.adviserinfo.sec.gov or by requesting a copy by emailing info@navellier.com. All of our forward-looking statements are as of the date of this report only. We can give no assurance that such expectations or forward-looking statements will prove to be correct. Actual results may differ materially. You are urged to carefully consider all such factors.
FEDERAL TAX ADVICE DISCLAIMER: As required by U.S. Treasury Regulations, you are informed that, to the extent this presentation includes any federal tax advice, the presentation is not written by Navellier to be used, and cannot be used, for the purpose of avoiding federal tax penalties. Navellier does not advise on any income tax requirements or issues. Use of any information presented by Navellier is for general information only and does not represent tax advice either express or implied. You are encouraged to seek professional tax advice for income tax questions and assistance.
IMPORTANT NEWSLETTER DISCLOSURE:The hypothetical performance results for investment newsletters that are authored or edited by Louis Navellier, including Louis Navellier’s Growth Investor, Louis Navellier’s Breakthrough Stocks, Louis Navellier’s Accelerated Profits, and Louis Navellier’s Platinum Club, are not based on any actual securities trading, portfolio, or accounts, and the newsletters’ reported hypothetical performances should be considered mere “paper” or proforma hypothetical performance results and are not actual performance of real world trades. Navellier & Associates, Inc. does not have any relation to or affiliation with the owner of these newsletters. There are material differences between Navellier Investment Products’ portfolios and the InvestorPlace Media, LLC newsletter portfolios authored by Louis Navellier. The InvestorPlace Media, LLC newsletters contain hypothetical performance that do not include transaction costs, advisory fees, or other fees a client might incur if actual investments and trades were being made by an investor. As a result, newsletter performance should not be used to evaluate Navellier Investment services which are separate and different from the newsletters. The owner of the newsletters is InvestorPlace Media, LLC and any questions concerning the newsletters, including any newsletter advertising or hypothetical Newsletter performance claims, (which are calculated solely by Investor Place Media and not Navellier) should be referred to InvestorPlace Media, LLC at (800) 718-8289.
Please note that Navellier & Associates and the Navellier Private Client Group are managed completely independent of the newsletters owned and published by InvestorPlace Media, LLC and written and edited by Louis Navellier, and investment performance of the newsletters should in no way be considered indicative of potential future investment performance for any Navellier & Associates separately managed account portfolio. Potential investors should consult with their financial advisor before investing in any Navellier Investment Product.
Navellier claims compliance with Global Investment Performance Standards (GIPS). To receive a complete list and descriptions of Navellier’s composites and/or a presentation that adheres to the GIPS standards, please contact Navellier or click here. It should not be assumed that any securities recommendations made by Navellier & Associates, Inc. in the future will be profitable or equal the performance of securities made in this report.
FactSet Disclosure: Navellier does not independently calculate the statistical information included in the attached report. The calculation and the information are provided by FactSet, a company not related to Navellier. Although information contained in the report has been obtained from FactSet and is based on sources Navellier believes to be reliable, Navellier does not guarantee its accuracy, and it may be incomplete or condensed. The report and the related FactSet sourced information are provided on an “as is” basis. The user assumes the entire risk of any use made of this information. Investors should consider the report as only a single factor in making their investment decision. The report is for informational purposes only and is not intended as an offer or solicitation for the purchase or sale of a security. FactSet sourced information is the exclusive property of FactSet. Without prior written permission of FactSet, this information may not be reproduced, disseminated or used to create any financial products. All indices are unmanaged and performance of the indices include reinvestment of dividends and interest income, unless otherwise noted, are not illustrative of any particular investment and an investment cannot be made in any index. Past performance is no guarantee of future results.