by Jason Bodner
March 11, 2025
In 1841, Charles Mackay wrote “Extraordinary Popular Delusions and the Madness of Crowds,” a thick read, but important in understanding the human mind’s approach to investing.
One of those delusions is the 1630s Tulip Mania. Tulips became the ultimate status symbol. A single rare bulb was so valuable that it cost as much as a luxurious Amsterdam house. All speculative bubbles pop. Tulip prices crashed virtually overnight, and many investors were left financially ruined:

Not all manias are financial. There’s also the Dancing Mania of 1518, when Frau Troffea, a woman in Strasbourg (in modern-day France) suddenly began dancing in the streets and couldn’t stop. Within days, dozens of people joined her, twisting as if possessed. After a month, there were hundreds of dancers.
Doctors and authorities had no clue as to what was happening. They encouraged more dancing, hiring musicians, thinking it would cure the problem. It didn’t. People collapsed from exhaustion, dehydration, and some even died from heart attacks and strokes—literally dancing themselves to death.
The dancing madness continued for months before finally fading away as mysteriously as it began. Some blamed food poisoning. Others blamed demonic possession. We’ll never know. My point is that these stories highlight the fact that herd mentality can yield unfortunate consequences – even in stock markets.
Investor crowd-think can lead to disastrous consequences. Countless historical bubbles have ruined investors – the internet bubble, the housing bubble, crypto and meme stocks…. The list goes on.
To be clear, I don’t think we are in a bubble right now, or recently, but there has been a sudden shift in sentiment in the last few weeks. The crowd went from giddy to paranoid in just a few days.
Let’s investigate why I think fear has gripped the wheel – but logic will prevail in the end…
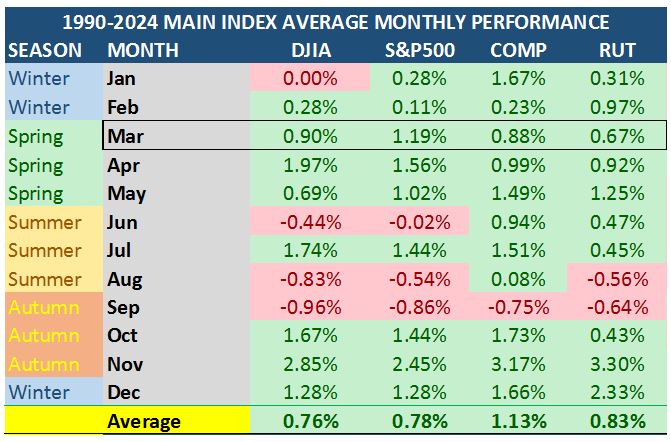
- March is a seasonally strong month. But the market is nearing oversold by traditional breadth metrics, i.e., on March 6th, 66% of the roughly 5300-stocks I monitor daily were trading below their 50-day moving average. Based on March’s positive record, I suspect this level of volatility will pass and we will finish March on a strong note:
Graphs are for illustrative and discussion purposes only. Please read important disclosures at the end of this commentary.
- After hitting all-time highs February 19th, the S&P 500 has fallen by as much as -6.5% since then. While it doesn’t feel nice, it is actually a bullish sign going forward. Here is a study showing strong returns, going forward, after the S&P has fallen by 6% or more in 10-days:

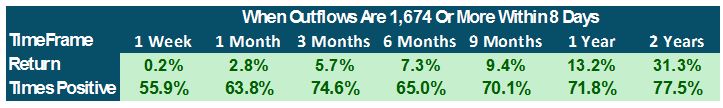
- My data has registered huge outflows of 1674 signals in just eight-days. Again, while ugly, the forward returns from such situations are quite pleasant:
- Digging further, days like last Monday which had only 6.4% of stocks showing inflows, I examined all days like that, and the forward returns are also solid:

- I suspect much of the trade war and tariff talk is just rhetoric. Trump is an aggressive negotiator, so he must show he means business. It’s easier to flex muscles against your friends (like Canada and Mexico) rather than enemies. On that note, he appears to be cozying-up to Russia and thus forcing Zelensky’s hand. The much-publicized ceasefire talks in the Oval Office went south fast. It was a laughing stock on the news, until Zelensky posted to his social media that he is willing to work under Trump’s leadership to secure peace. He is also willing to sign the natural resource deal. That’s an example of how Trump negotiates: He uses strong-arm style. I think the same is happening for tariffs. Canada may vocally oppose tariffs, but 78% of their exports are to the U.S.
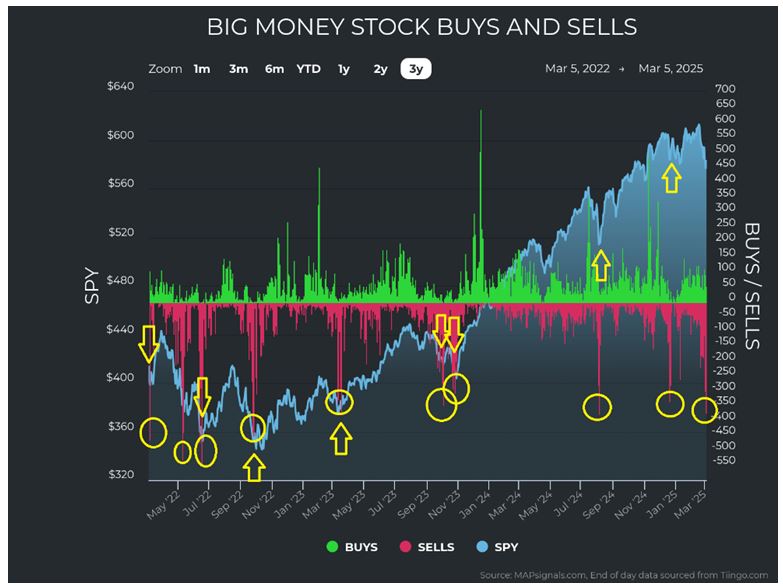
- Furthermore, we can see that, over the last three-years, high outflow days like last Tuesday, March 4th – when we saw 374 outflow signals – typically line up with near-term market troughs:
Graphs are for illustrative and discussion purposes only. Please read important disclosures at the end of this commentary.
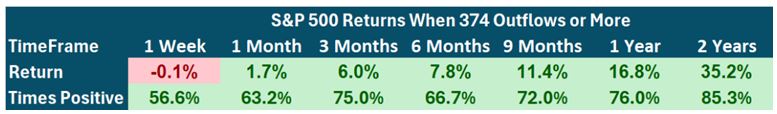
- In fact, the 76 prior times we saw outflows like this showed us positive returns thereafter:
- If we look back 10-years, which excludes the 2008 financial crisis, we see a stronger profile:

- Sales and earnings were stellar for Q1: 75% of companies beat earnings estimates and 63% of companies beat sales estimates. This is right in line with the 10-year average:
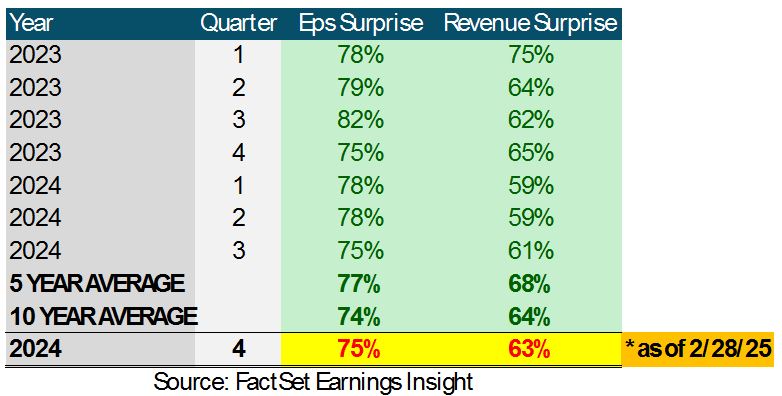
Graphs are for illustrative and discussion purposes only. Please read important disclosures at the end of this commentary.
While guidance was sometimes more tepid than Wall Street wanted, the environment is still strong.
- I expect more rate cuts than the market is pricing in. The United Kingdom and Japan are in recession while Germany, the Euro-zone, and Canada are experiencing economic hardship. Global rates are coming down. I expect three or four rate cuts this year, while the market expects two. But, as pointed out last time, the market almost always gets this wrong. Just look at this chart, where the solid line is reality (the Fed funds rate), and all other lines are pundits’ projections:
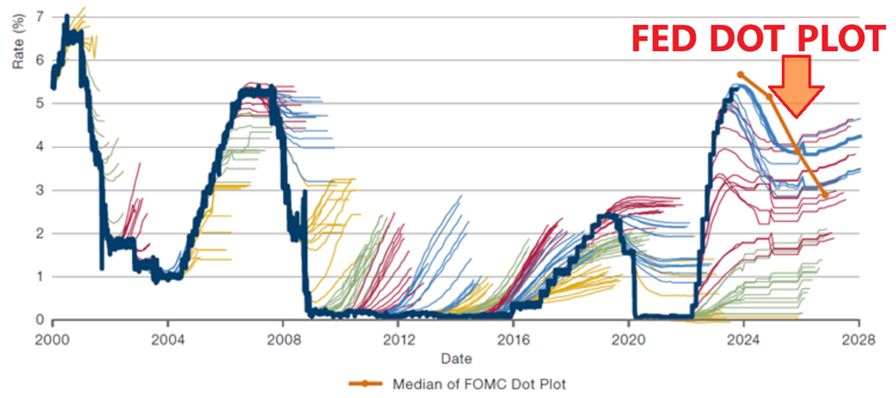
Graphs are for illustrative and discussion purposes only. Please read important disclosures at the end of this commentary.
- Even though the Fed Dot Plot is telling the world that rates will fall, the market expects worse.
- The VIX is elevated, showing it will likely retreat in coming days:
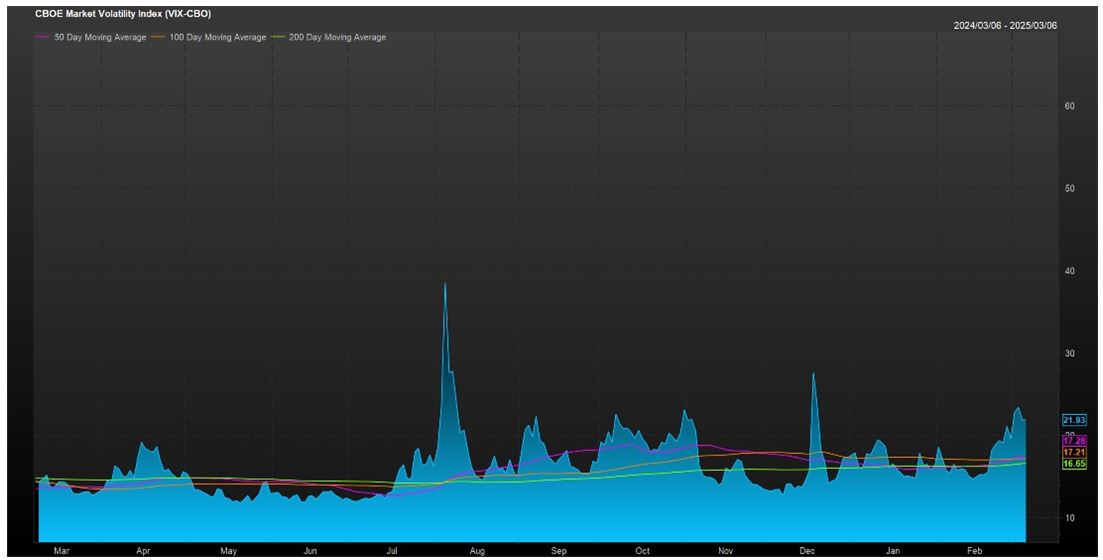
Graphs are for illustrative and discussion purposes only. Please read important disclosures at the end of this commentary.
- NASDAQ has pierced below its 200-day moving average:
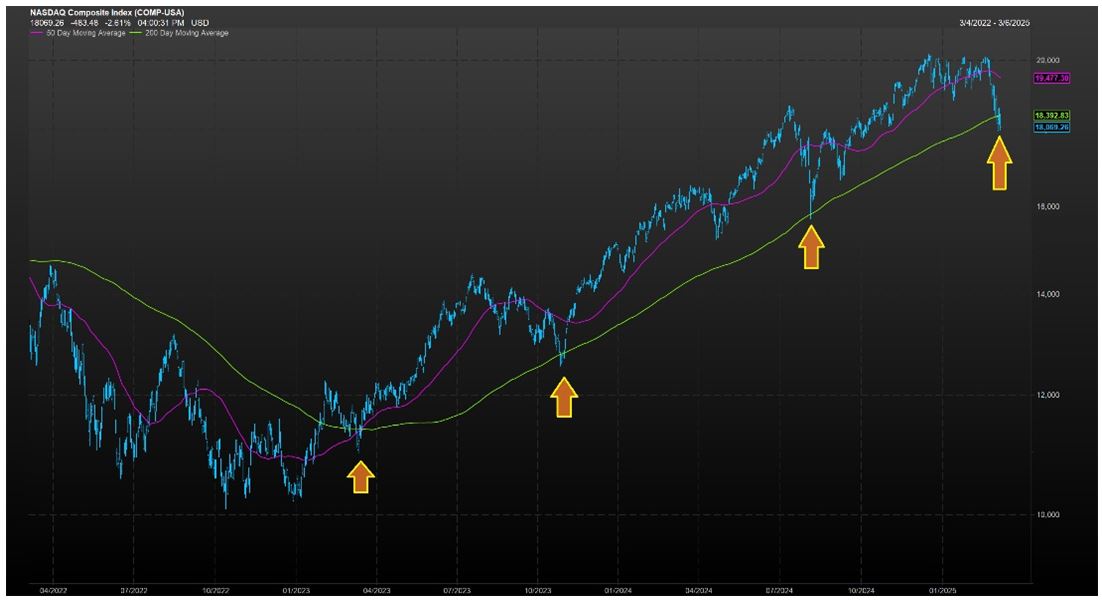
Graphs are for illustrative and discussion purposes only. Please read important disclosures at the end of this commentary.
Since April 2023, each time it did this, it zoomed higher thereafter.
- Since November, P/E ratios have corrected by 17%. The forward 12-month P/E ratio for the S&P 500 is 21.2. This is above the 5-year average (19.8) and 10-year average (18.3):
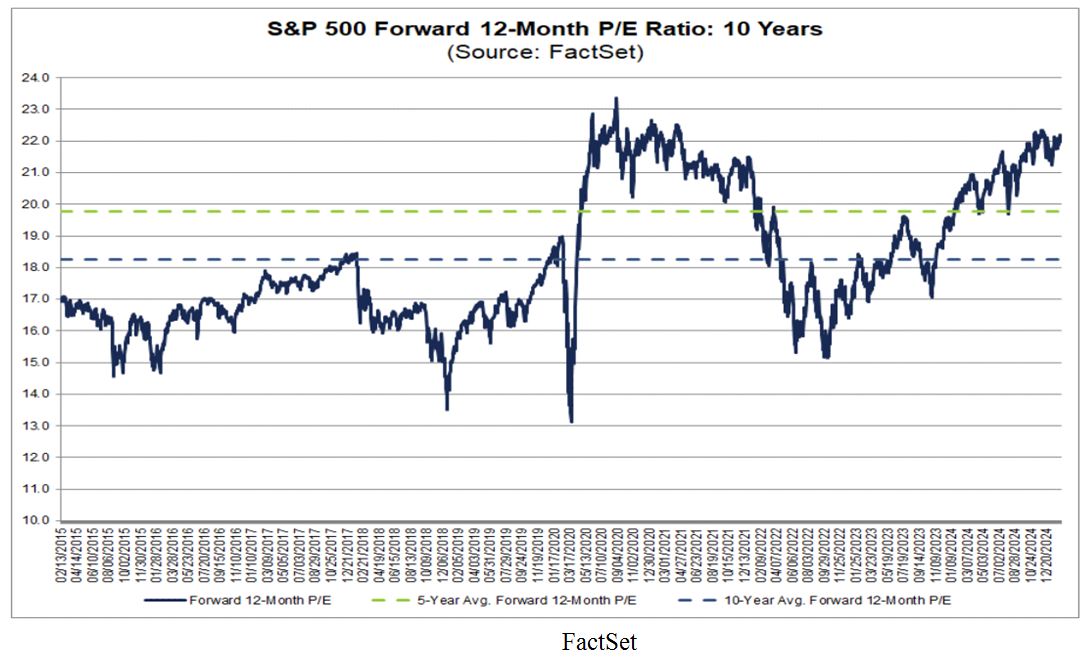
Graphs are for illustrative and discussion purposes only. Please read important disclosures at the end of this commentary.
The trailing 12-month P/E ratio is high as well, but it hardly seems like cause for alarm:
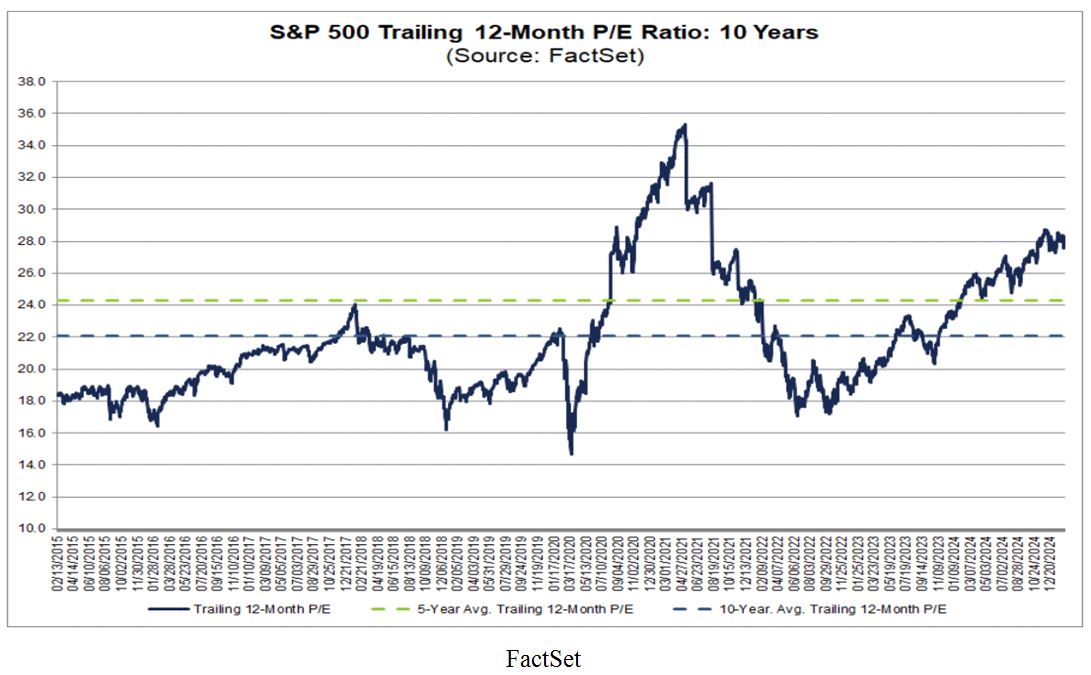
Graphs are for illustrative and discussion purposes only. Please read important disclosures at the end of this commentary.
- The S&P 500 is only part of the picture. The entire market’s breadth (stocks up vs. down) has been deteriorating for some time now in the ~5,500 stocks we score daily, as shown here:
-
- On November 29th (my birthday) only 35% of stocks were trading below their 50-day moving average. The average P/E ratio (trailing 12 Months) was 40.5 – substantially higher than the S&P 500.
- On February 19th, the S&P 500 reached an all-time high, yet 46.9% of our ~5,550 stocks traded below their 50-DMA. The average P/E ratio (TTM) was 38.3. The valuation correction had begun with major indexes making highs.
- On February 27th the S&P 500 reached a year-to-date low with 60.4% of our universe trading below their 50-day moving average. The average P/E ratio (TTM), for our universe was 35.3.
- March 6th had 66% of stocks trading below the 50-DMA and the average P/E as 33.6. This means a valuation correction of -17% has taken place.
Few people like volatility, but it’s part of the game. Ironically, investing opportunity often looks like gloom and doom. Fear paralyzes us, especially when it comes to our wallets and portfolios. But the reality is that there is a correction happening right now, and that is a good time to find great stocks going on sale.
Sales like this don’t usually last very long.
“Men… go mad in herds, while they only recover their senses slowly, one by one.” ― Charles Mackay
All content above represents the opinion of Jason Bodner of Navellier & Associates, Inc.
Also In This Issue
A Look Ahead by Louis Navellier
Most of the Trump Tariffs Will Not Be Inflationary or Permanent
Income Mail by Bryan Perry
Buy When There Is Tariff and DOGE-Cut “Blood in The Streets”
Growth Mail by Gary Alexander
The Magic Formula for Creating Budget Surpluses (Let’s Do It Again!)
Global Mail by Ivan Martchev
U.S. Stocks Are Ripe for a Rebound
Sector Spotlight by Jason Bodner
Are We in the Midst of a Bubble Mania (the Madness of Crowds)?
View Full Archive
Read Past Issues Here

Jason Bodner
MARKETMAIL EDITOR FOR SECTOR SPOTLIGHT
Jason Bodner writes Sector Spotlight in the weekly Marketmail publication and has authored several white papers for the company. He is also Co-Founder of Macro Analytics for Professionals which produces proprietary equity accumulation and distribution research for its clients. Previously, Mr. Bodner served as Director of European Equity Derivatives for Cantor Fitzgerald Europe in London, then moved to the role of Head of Equity Derivatives North America for the same company in New York. He also served as S.V.P. Equity Derivatives for Jefferies, LLC. He received a B.S. in business administration in 1996, with honors, from Skidmore College as a member of the Periclean Honors Society. All content of “Sector Spotlight” represents the opinion of Jason Bodner
Important Disclosures:
Jason Bodner is a co-founder and co-owner of Mapsignals. Mr. Bodner is an independent contractor who is occasionally hired by Navellier & Associates to write an article and or provide opinions for possible use in articles that appear in Navellier & Associates weekly Market Mail. Mr. Bodner is not employed or affiliated with Louis Navellier, Navellier & Associates, Inc., or any other Navellier owned entity. The opinions and statements made here are those of Mr. Bodner and not necessarily those of any other persons or entities. This is not an endorsement, or solicitation or testimonial or investment advice regarding the BMI Index or any statements or recommendations or analysis in the article or the BMI Index or Mapsignals or its products or strategies.
Although information in these reports has been obtained from and is based upon sources that Navellier believes to be reliable, Navellier does not guarantee its accuracy and it may be incomplete or condensed. All opinions and estimates constitute Navellier’s judgment as of the date the report was created and are subject to change without notice. These reports are for informational purposes only and are not a solicitation for the purchase or sale of a security. Any decision to purchase securities mentioned in these reports must take into account existing public information on such securities or any registered prospectus.To the extent permitted by law, neither Navellier & Associates, Inc., nor any of its affiliates, agents, or service providers assumes any liability or responsibility nor owes any duty of care for any consequences of any person acting or refraining to act in reliance on the information contained in this communication or for any decision based on it.
Past performance is no indication of future results. Investment in securities involves significant risk and has the potential for partial or complete loss of funds invested. It should not be assumed that any securities recommendations made by Navellier. in the future will be profitable or equal the performance of securities made in this report. Dividend payments are not guaranteed. The amount of a dividend payment, if any, can vary over time and issuers may reduce dividends paid on securities in the event of a recession or adverse event affecting a specific industry or issuer.
None of the stock information, data, and company information presented herein constitutes a recommendation by Navellier or a solicitation to buy or sell any securities. Any specific securities identified and described do not represent all of the securities purchased, sold, or recommended for advisory clients. The holdings identified do not represent all of the securities purchased, sold, or recommended for advisory clients and the reader should not assume that investments in the securities identified and discussed were or will be profitable.
Information presented is general information that does not take into account your individual circumstances, financial situation, or needs, nor does it present a personalized recommendation to you. Individual stocks presented may not be suitable for every investor. Investment in securities involves significant risk and has the potential for partial or complete loss of funds invested. Investment in fixed income securities has the potential for the investment return and principal value of an investment to fluctuate so that an investor’s holdings, when redeemed, may be worth less than their original cost.
One cannot invest directly in an index. Index is unmanaged and index performance does not reflect deduction of fees, expenses, or taxes. Presentation of Index data does not reflect a belief by Navellier that any stock index constitutes an investment alternative to any Navellier equity strategy or is necessarily comparable to such strategies. Among the most important differences between the Indices and Navellier strategies are that the Navellier equity strategies may (1) incur material management fees, (2) concentrate its investments in relatively few stocks, industries, or sectors, (3) have significantly greater trading activity and related costs, and (4) be significantly more or less volatile than the Indices.
ETF Risk: We may invest in exchange traded funds (“ETFs”) and some of our investment strategies are generally fully invested in ETFs. Like traditional mutual funds, ETFs charge asset-based fees, but they generally do not charge initial sales charges or redemption fees and investors typically pay only customary brokerage fees to buy and sell ETF shares. The fees and costs charged by ETFs held in client accounts will not be deducted from the compensation the client pays Navellier. ETF prices can fluctuate up or down, and a client account could lose money investing in an ETF if the prices of the securities owned by the ETF go down. ETFs are subject to additional risks:
- ETF shares may trade above or below their net asset value;
- An active trading market for an ETF’s shares may not develop or be maintained;
- The value of an ETF may be more volatile than the underlying portfolio of securities the ETF is designed to track;
- The cost of owning shares of the ETF may exceed those a client would incur by directly investing in the underlying securities and;
- Trading of an ETF’s shares may be halted if the listing exchange’s officials deem it appropriate, the shares are delisted from the exchange, or the activation of market-wide “circuit breakers” (which are tied to large decreases in stock prices) halts stock trading generally.
Grader Disclosures: Investment in equity strategies involves substantial risk and has the potential for partial or complete loss of funds invested. The sample portfolio and any accompanying charts are for informational purposes only and are not to be construed as a solicitation to buy or sell any financial instrument and should not be relied upon as the sole factor in an investment making decision. As a matter of normal and important disclosures to you, as a potential investor, please consider the following: The performance presented is not based on any actual securities trading, portfolio, or accounts, and the reported performance of the A, B, C, D, and F portfolios (collectively the “model portfolios”) should be considered mere “paper” or pro forma performance results based on Navellier’s research.
Investors evaluating any of Navellier & Associates, Inc.’s, (or its affiliates’) Investment Products must not use any information presented here, including the performance figures of the model portfolios, in their evaluation of any Navellier Investment Products. Navellier Investment Products include the firm’s mutual funds and managed accounts. The model portfolios, charts, and other information presented do not represent actual funded trades and are not actual funded portfolios. There are material differences between Navellier Investment Products’ portfolios and the model portfolios, research, and performance figures presented here. The model portfolios and the research results (1) may contain stocks or ETFs that are illiquid and difficult to trade; (2) may contain stock or ETF holdings materially different from actual funded Navellier Investment Product portfolios; (3) include the reinvestment of all dividends and other earnings, estimated trading costs, commissions, or management fees; and, (4) may not reflect prices obtained in an actual funded Navellier Investment Product portfolio. For these and other reasons, the reported performances of model portfolios do not reflect the performance results of Navellier’s actually funded and traded Investment Products. In most cases, Navellier’s Investment Products have materially lower performance results than the performances of the model portfolios presented.
This report contains statements that are, or may be considered to be, forward-looking statements. All statements that are not historical facts, including statements about our beliefs or expectations, are “forward-looking statements” within the meaning of The U.S. Private Securities Litigation Reform Act of 1995. These statements may be identified by such forward-looking terminology as “expect,” “estimate,” “plan,” “intend,” “believe,” “anticipate,” “may,” “will,” “should,” “could,” “continue,” “project,” or similar statements or variations of such terms. Our forward-looking statements are based on a series of expectations, assumptions, and projections, are not guarantees of future results or performance, and involve substantial risks and uncertainty as described in Form ADV Part 2A of our filing with the Securities and Exchange Commission (SEC), which is available at www.adviserinfo.sec.gov or by requesting a copy by emailing info@navellier.com. All of our forward-looking statements are as of the date of this report only. We can give no assurance that such expectations or forward-looking statements will prove to be correct. Actual results may differ materially. You are urged to carefully consider all such factors.
FEDERAL TAX ADVICE DISCLAIMER: As required by U.S. Treasury Regulations, you are informed that, to the extent this presentation includes any federal tax advice, the presentation is not written by Navellier to be used, and cannot be used, for the purpose of avoiding federal tax penalties. Navellier does not advise on any income tax requirements or issues. Use of any information presented by Navellier is for general information only and does not represent tax advice either express or implied. You are encouraged to seek professional tax advice for income tax questions and assistance.
IMPORTANT NEWSLETTER DISCLOSURE:The hypothetical performance results for investment newsletters that are authored or edited by Louis Navellier, including Louis Navellier’s Growth Investor, Louis Navellier’s Breakthrough Stocks, Louis Navellier’s Accelerated Profits, and Louis Navellier’s Platinum Club, are not based on any actual securities trading, portfolio, or accounts, and the newsletters’ reported hypothetical performances should be considered mere “paper” or proforma hypothetical performance results and are not actual performance of real world trades. Navellier & Associates, Inc. does not have any relation to or affiliation with the owner of these newsletters. There are material differences between Navellier Investment Products’ portfolios and the InvestorPlace Media, LLC newsletter portfolios authored by Louis Navellier. The InvestorPlace Media, LLC newsletters contain hypothetical performance that do not include transaction costs, advisory fees, or other fees a client might incur if actual investments and trades were being made by an investor. As a result, newsletter performance should not be used to evaluate Navellier Investment services which are separate and different from the newsletters. The owner of the newsletters is InvestorPlace Media, LLC and any questions concerning the newsletters, including any newsletter advertising or hypothetical Newsletter performance claims, (which are calculated solely by Investor Place Media and not Navellier) should be referred to InvestorPlace Media, LLC at (800) 718-8289.
Please note that Navellier & Associates and the Navellier Private Client Group are managed completely independent of the newsletters owned and published by InvestorPlace Media, LLC and written and edited by Louis Navellier, and investment performance of the newsletters should in no way be considered indicative of potential future investment performance for any Navellier & Associates separately managed account portfolio. Potential investors should consult with their financial advisor before investing in any Navellier Investment Product.
Navellier claims compliance with Global Investment Performance Standards (GIPS). To receive a complete list and descriptions of Navellier’s composites and/or a presentation that adheres to the GIPS standards, please contact Navellier or click here. It should not be assumed that any securities recommendations made by Navellier & Associates, Inc. in the future will be profitable or equal the performance of securities made in this report.
FactSet Disclosure: Navellier does not independently calculate the statistical information included in the attached report. The calculation and the information are provided by FactSet, a company not related to Navellier. Although information contained in the report has been obtained from FactSet and is based on sources Navellier believes to be reliable, Navellier does not guarantee its accuracy, and it may be incomplete or condensed. The report and the related FactSet sourced information are provided on an “as is” basis. The user assumes the entire risk of any use made of this information. Investors should consider the report as only a single factor in making their investment decision. The report is for informational purposes only and is not intended as an offer or solicitation for the purchase or sale of a security. FactSet sourced information is the exclusive property of FactSet. Without prior written permission of FactSet, this information may not be reproduced, disseminated or used to create any financial products. All indices are unmanaged and performance of the indices include reinvestment of dividends and interest income, unless otherwise noted, are not illustrative of any particular investment and an investment cannot be made in any index. Past performance is no guarantee of future results.