by Jason Bodner
September 24, 2024
There is a flower that blooms so rarely that it might only bloom once a decade. The Amorphophallus Titanium, better known as the Corpse Flower, blooms for only a few days every few years. Unfortunately, when it finally blooms, it smells like rotting flesh… hence its moniker. It was the basis for a scene in the 1993 movie “Dennis the Menace.” Dennis ruins Mr. Wilson’s party to watch a rare orchid finally bloom.
Since interest rates cratered in early 2020 and then subsequently skyrocketed, investors have been waiting for rates to start their descent back to earth for nearly five years – much like a rare-blooming flower.
Well, it finally happened.
Powell gave us what we wanted when the Fed cut the target rate by 0.50% to a range of 4.75-5.00%.
The Fed’s flower finally bloomed. We knew it was only a matter of time, but like a kid’s punishment with no end date, it seemed like it would go on forever.
More cuts will follow. This chart indicates that we should expect a decline in rates for years to come:
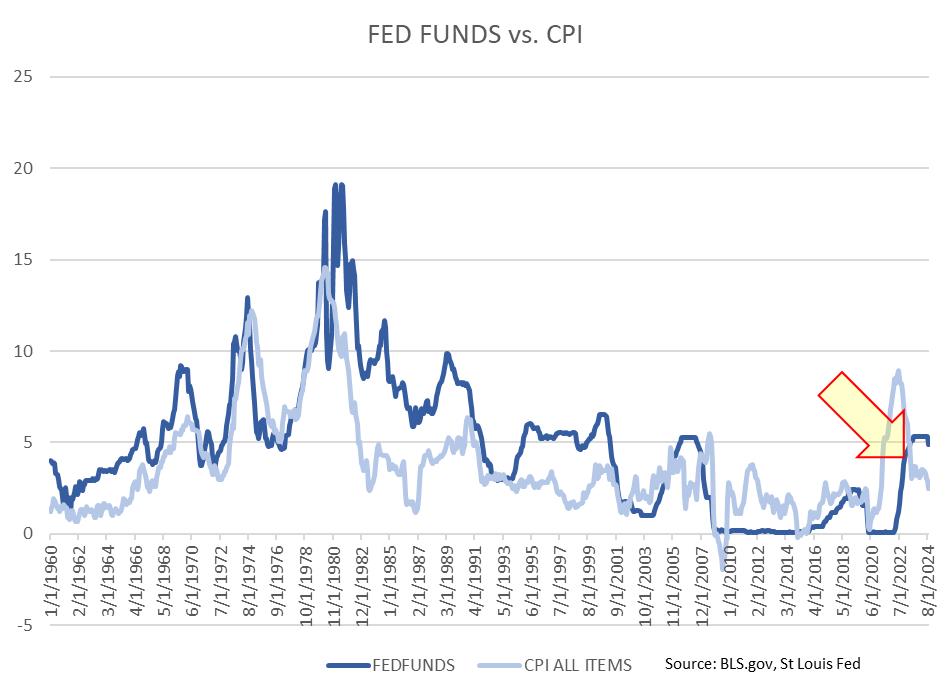
Graphs are for illustrative and discussion purposes only. Please read important disclosures at the end of this commentary.
Most stock investors know that a rate-cutting cycle is great news for stocks. But perma-bears are still out there drawing silly comparisons to 2008 and other historical calamities. They want you to believe that a recession is coming… but it isn’t. At least, not based on the strong economic data that keeps coming in.
Below, I’ve assembled some data points that show a rosy picture going forward, a picture based entirely on data, not on fearmongering or emotional games. Let’s dig in…
First, the low-hanging fruit… I looked back in history for every time there was a drop of 40 basis points or more in the Fed’s effective rate. I chose 40 bps because, while the cut was 50 bps, the rate is a range of 4.75-5.00%, not a single reading. So, the effective Fed funds rate is often in the middle of the range.
There were 70 instances like September 18th since 1960, but my market data only goes back to the late 1970s, so let’s use that as our cutoff. Since then, there were 40 drops out of 549 observances, meaning this occurred about 7.3% of the time. The forward returns of the S&P 500 were strong, looking forward:
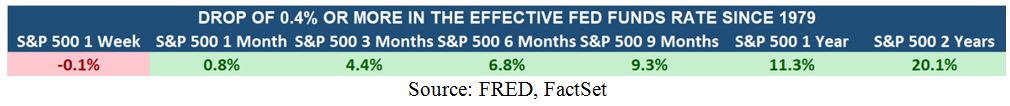
Graphs are for illustrative and discussion purposes only. Please read important disclosures at the end of this commentary.
It’s an important distinction that we are not currently in a recession, because those 40 instances include several recessions and major crises, such as 1981, 2001, and 2008. These periods were associated with some godawful market returns, at least until the contagions worked their way through the system. Today is not like those times at all. So, in this admittedly biased exercise, I wanted to see what happens when we remove recessions and crisis events from the data set. Needless to say, returns improved dramatically:
Graphs are for illustrative and discussion purposes only. Please read important disclosures at the end of this commentary.
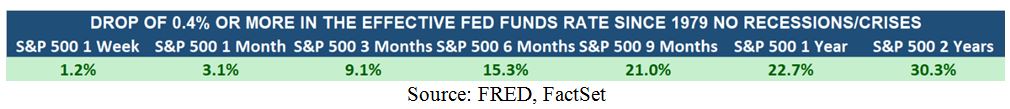
That’s a rosy picture, and it makes sense; as rates fall, borrowing becomes easier, the consumer has more disposable income, and economic growth has the fuel to continue. Therefore, stocks should pop on this news, and pop they did. But what really matters is what big institutional investors are doing. By now, you know that I spend my time tracking unusual in and out flows of institutional stock investments.
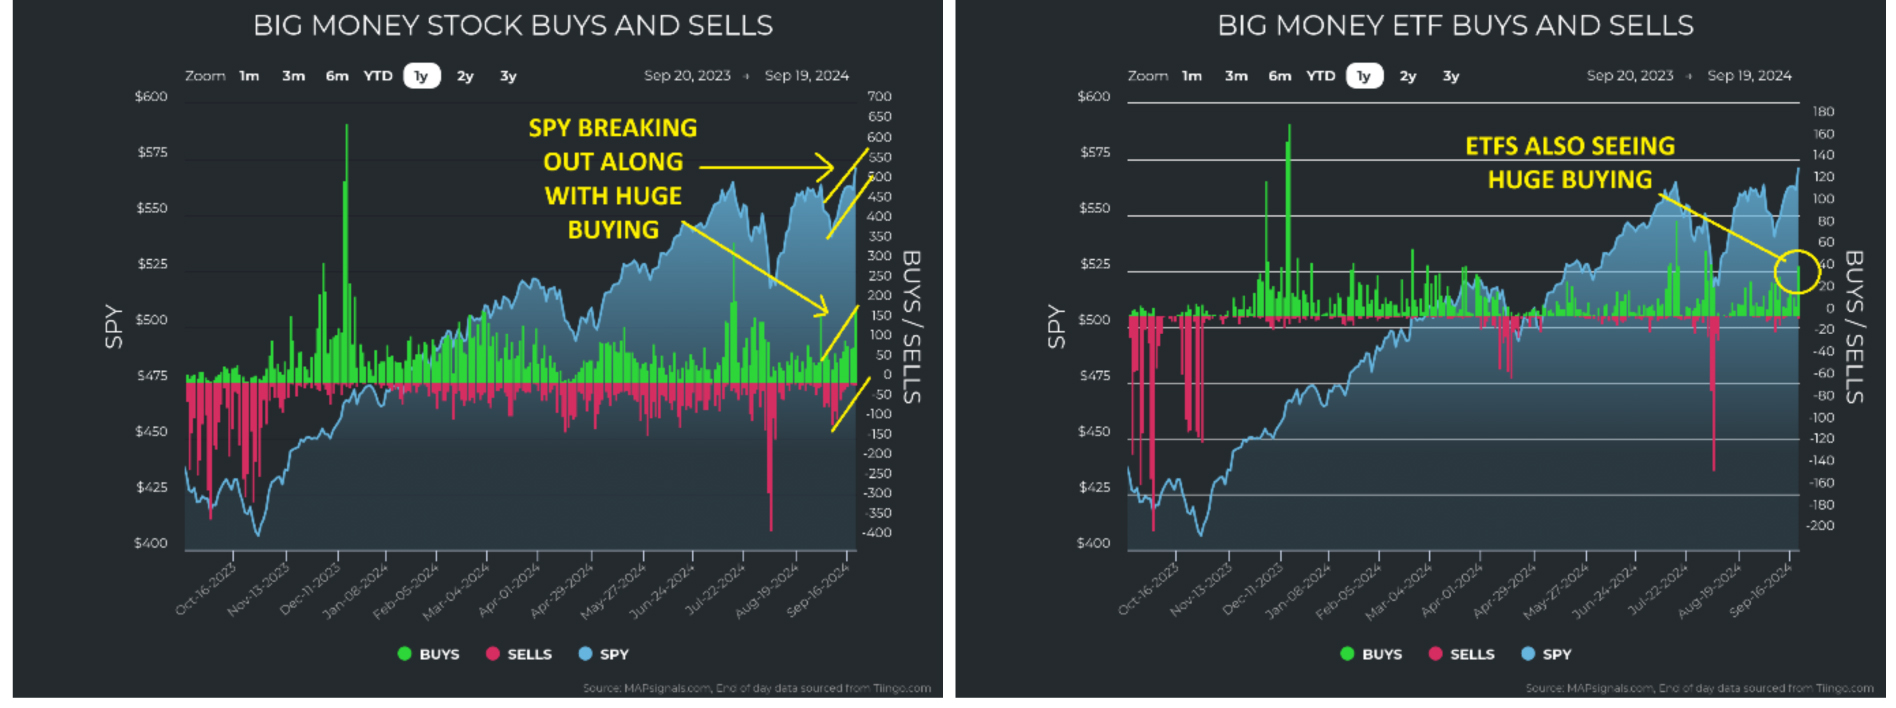
The simplest measure of the trend of money flows is to look at the Big Money Index, a 25-day moving average of unusual money flows in and out of stocks. The BMI just broke out to the upside along with the S&P 500 tracking ETF. Blasting through all-time highs on unusually large volume is great technical news:
![]()
Graphs are for illustrative and discussion purposes only. Please read important disclosures at the end of this commentary.
The unusually large buying we saw on the day after the Fed decision was massive. There were 185 unusually large buys of stocks and ETFs on Thursday, September 19th:
![]()
Graphs are for illustrative and discussion purposes only. Please read important disclosures at the end of this commentary.
The picture is getting rosier. I’ve been harping on the huge upside for small and mid-cap stocks. IWM (the Russell 2000 tracking ETF) blew through highs in July only to collapse and reverse lower. Quietly, it has been climbing higher and sits at a breakout point… again coupled with massive inflows:
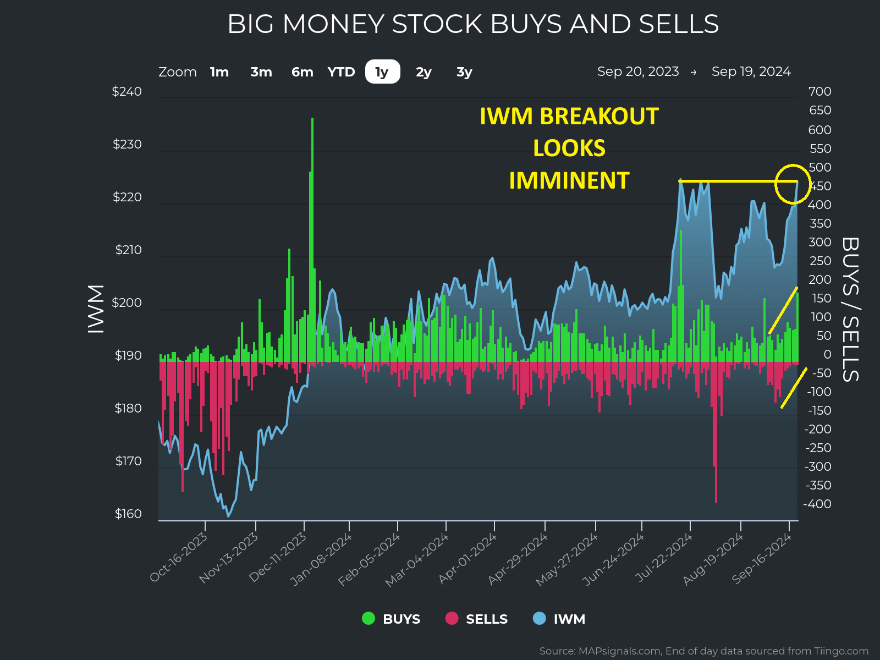
![]()
Graphs are for illustrative and discussion purposes only. Please read important disclosures at the end of this commentary.
If we look through another lens, we can see small and mid-cap buying dominated trading last week:
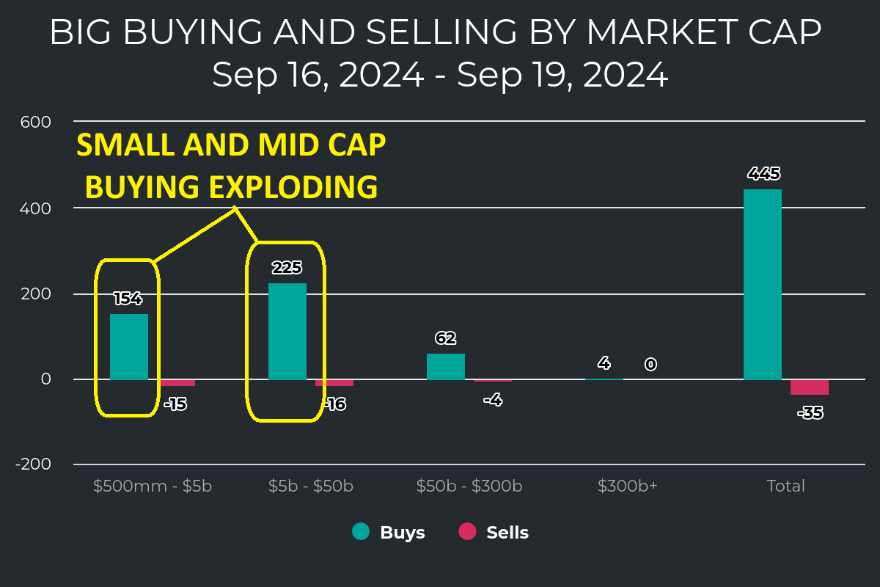
![]()
Graphs are for illustrative and discussion purposes only. Please read important disclosures at the end of this commentary.
We are seeing a great setup. Now let’s compare prior times we saw buying like this. I went back to see days of 185 or more buys since my data began in 1990. This rare flower has only bloomed 166 days out of 8,720 or 1.9% of the time. The forward returns for SPY look great several months from now onward:
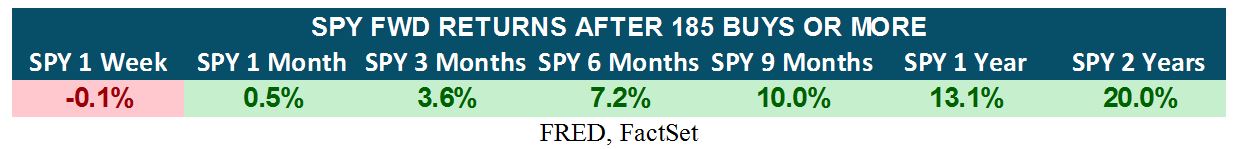
Graphs are for illustrative and discussion purposes only. Please read important disclosures at the end of this commentary.
The 1-week through 1-month returns don’t look so great since the timing window is too short, and also because of seasonality. We are now in September, historically the weakest month of the year. We are also approaching an election, with a tight race, which breeds uncertainty. Wall Street hates uncertainty.
One other major uncertainty, however – over interest rates – is now magically gone.
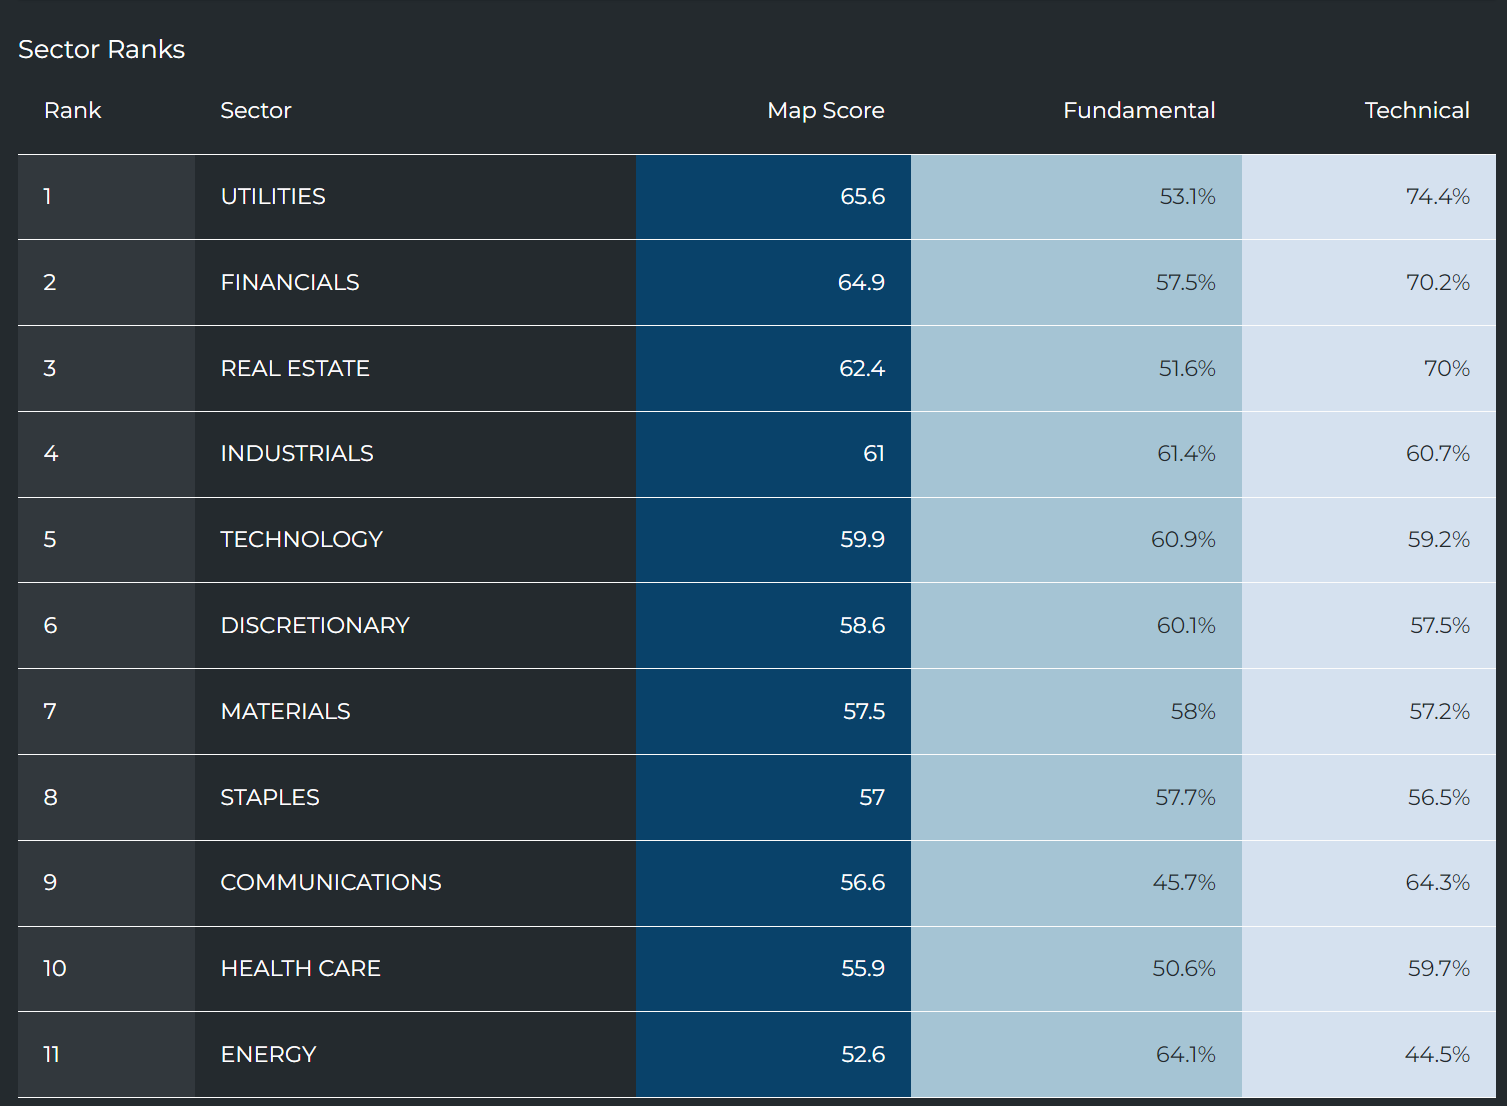
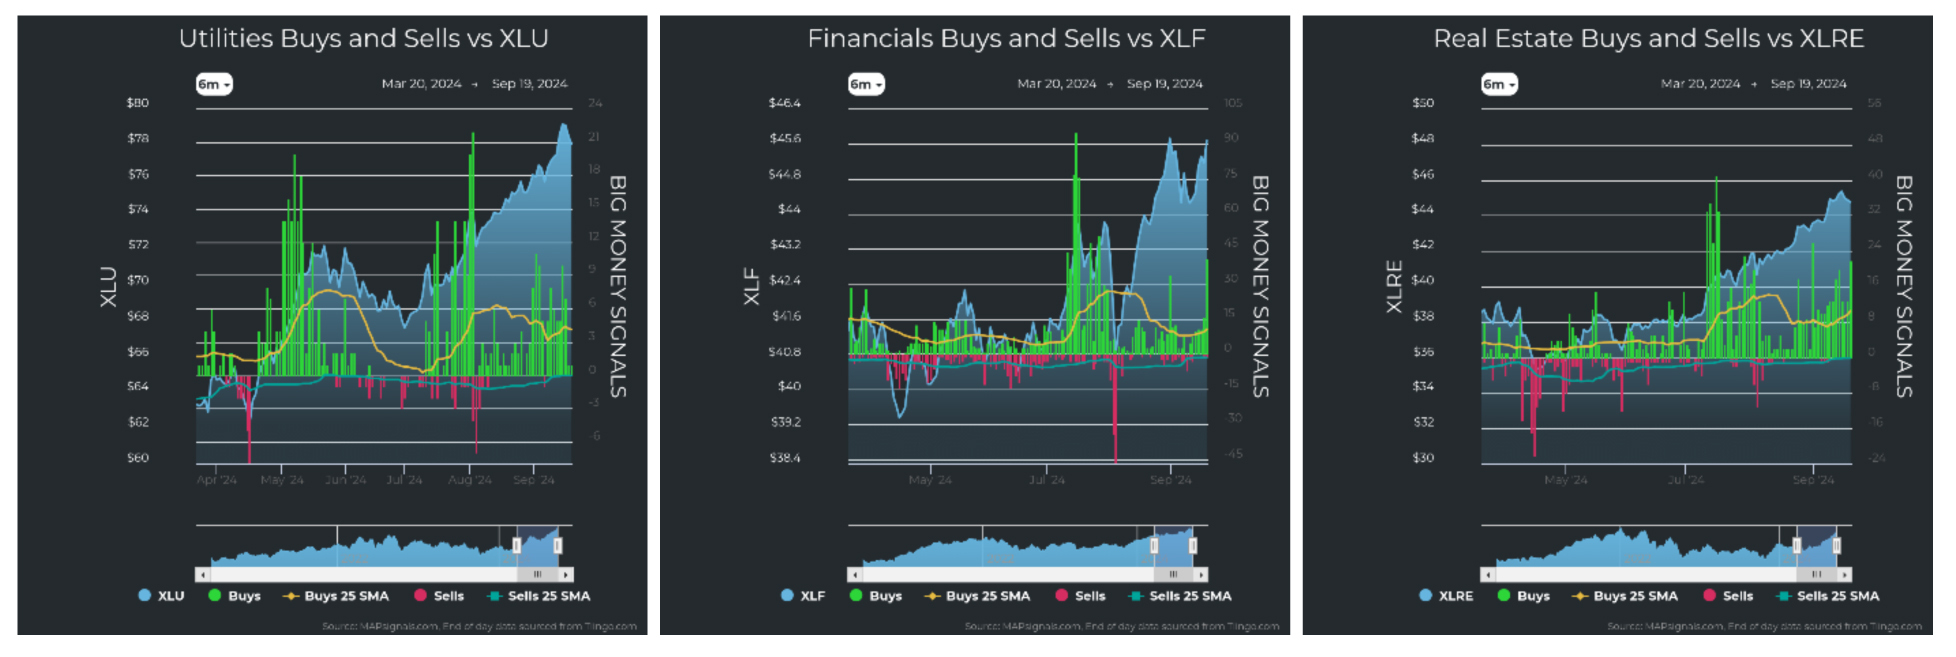
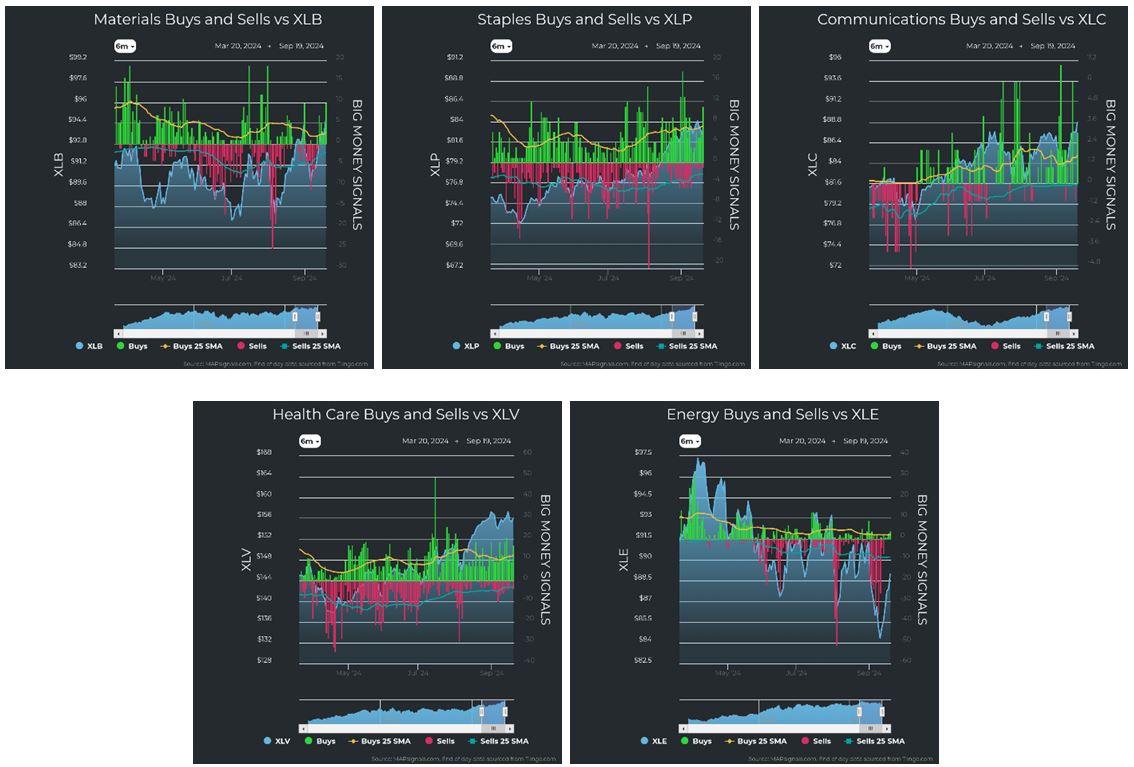
The picture continues to improve when we look at the unusual buying and selling of individual sectors.
Graphs are for illustrative and discussion purposes only. Please read important disclosures at the end of this commentary.
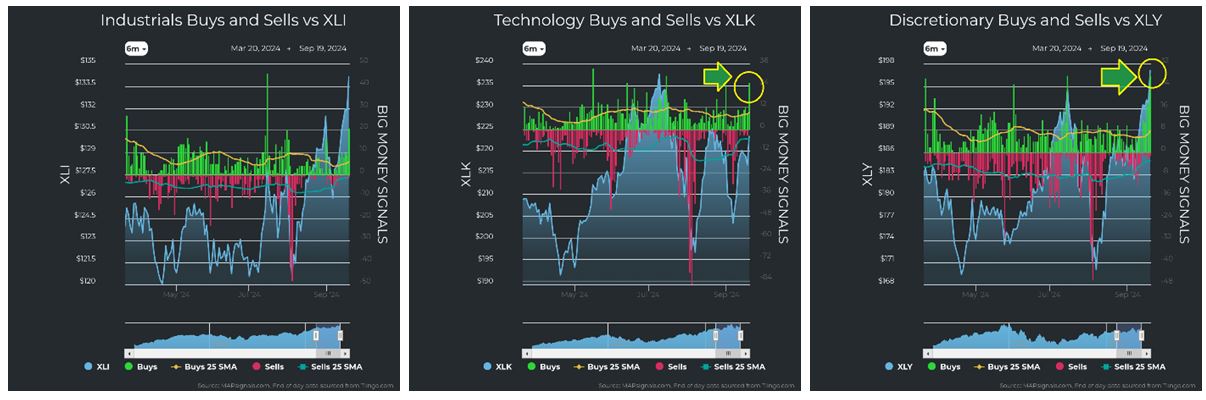
As the charts below show, every sector is trending up, with the exception of Technology and Energy. Both, however, are bouncing substantially off their recent lows, so the price action is constructive.
Graphs are for illustrative and discussion purposes only. Please read important disclosures at the end of this commentary.
What has me even more excited is that there was fresh sizeable buying in Technology and Discretionary stocks. These two sectors are major fuel for past bull markets. I circled them so you can see:
Graphs are for illustrative and discussion purposes only. Please read important disclosures at the end of this commentary.
The stock market picture looks great for the many reasons I listed above. I stress the opportunity in small and mid-cap stocks as new leadership emerges. Focus on stocks with the magic formula of growing sales, earnings, profits, low debt, great management and history. This will substantially narrow the playing field.
No matter what happens, I urge you not to sit too long in cash and watch from the sidelines. As H. Jackson Browne Jr., said: “Nothing is more expensive than a missed opportunity.”
All content above represents the opinion of Jason Bodner of Navellier & Associates, Inc.
Also In This Issue
A Look Ahead by Louis Navellier
The Economy Looks Sound, Favoring the Incumbent Party
Income Mail by Bryan Perry
King Dollar is Looking to Defend a Key Support Level
Growth Mail by Gary Alexander
We Enter Autumn – The Market’s Best Season
Global Mail by Ivan Martchev
Another All-Time High, Now What?
Sector Spotlight by Jason Bodner
The Fed’s Late-Blooming Flower … Finally Blooms
View Full Archive
Read Past Issues Here

Jason Bodner
MARKETMAIL EDITOR FOR SECTOR SPOTLIGHT
Jason Bodner writes Sector Spotlight in the weekly Marketmail publication and has authored several white papers for the company. He is also Co-Founder of Macro Analytics for Professionals which produces proprietary equity accumulation and distribution research for its clients. Previously, Mr. Bodner served as Director of European Equity Derivatives for Cantor Fitzgerald Europe in London, then moved to the role of Head of Equity Derivatives North America for the same company in New York. He also served as S.V.P. Equity Derivatives for Jefferies, LLC. He received a B.S. in business administration in 1996, with honors, from Skidmore College as a member of the Periclean Honors Society. All content of “Sector Spotlight” represents the opinion of Jason Bodner
Important Disclosures:
Jason Bodner is a co-founder and co-owner of Mapsignals. Mr. Bodner is an independent contractor who is occasionally hired by Navellier & Associates to write an article and or provide opinions for possible use in articles that appear in Navellier & Associates weekly Market Mail. Mr. Bodner is not employed or affiliated with Louis Navellier, Navellier & Associates, Inc., or any other Navellier owned entity. The opinions and statements made here are those of Mr. Bodner and not necessarily those of any other persons or entities. This is not an endorsement, or solicitation or testimonial or investment advice regarding the BMI Index or any statements or recommendations or analysis in the article or the BMI Index or Mapsignals or its products or strategies.
Although information in these reports has been obtained from and is based upon sources that Navellier believes to be reliable, Navellier does not guarantee its accuracy and it may be incomplete or condensed. All opinions and estimates constitute Navellier’s judgment as of the date the report was created and are subject to change without notice. These reports are for informational purposes only and are not a solicitation for the purchase or sale of a security. Any decision to purchase securities mentioned in these reports must take into account existing public information on such securities or any registered prospectus.To the extent permitted by law, neither Navellier & Associates, Inc., nor any of its affiliates, agents, or service providers assumes any liability or responsibility nor owes any duty of care for any consequences of any person acting or refraining to act in reliance on the information contained in this communication or for any decision based on it.
Past performance is no indication of future results. Investment in securities involves significant risk and has the potential for partial or complete loss of funds invested. It should not be assumed that any securities recommendations made by Navellier. in the future will be profitable or equal the performance of securities made in this report. Dividend payments are not guaranteed. The amount of a dividend payment, if any, can vary over time and issuers may reduce dividends paid on securities in the event of a recession or adverse event affecting a specific industry or issuer.
None of the stock information, data, and company information presented herein constitutes a recommendation by Navellier or a solicitation to buy or sell any securities. Any specific securities identified and described do not represent all of the securities purchased, sold, or recommended for advisory clients. The holdings identified do not represent all of the securities purchased, sold, or recommended for advisory clients and the reader should not assume that investments in the securities identified and discussed were or will be profitable.
Information presented is general information that does not take into account your individual circumstances, financial situation, or needs, nor does it present a personalized recommendation to you. Individual stocks presented may not be suitable for every investor. Investment in securities involves significant risk and has the potential for partial or complete loss of funds invested. Investment in fixed income securities has the potential for the investment return and principal value of an investment to fluctuate so that an investor’s holdings, when redeemed, may be worth less than their original cost.
One cannot invest directly in an index. Index is unmanaged and index performance does not reflect deduction of fees, expenses, or taxes. Presentation of Index data does not reflect a belief by Navellier that any stock index constitutes an investment alternative to any Navellier equity strategy or is necessarily comparable to such strategies. Among the most important differences between the Indices and Navellier strategies are that the Navellier equity strategies may (1) incur material management fees, (2) concentrate its investments in relatively few stocks, industries, or sectors, (3) have significantly greater trading activity and related costs, and (4) be significantly more or less volatile than the Indices.
ETF Risk: We may invest in exchange traded funds (“ETFs”) and some of our investment strategies are generally fully invested in ETFs. Like traditional mutual funds, ETFs charge asset-based fees, but they generally do not charge initial sales charges or redemption fees and investors typically pay only customary brokerage fees to buy and sell ETF shares. The fees and costs charged by ETFs held in client accounts will not be deducted from the compensation the client pays Navellier. ETF prices can fluctuate up or down, and a client account could lose money investing in an ETF if the prices of the securities owned by the ETF go down. ETFs are subject to additional risks:
- ETF shares may trade above or below their net asset value;
- An active trading market for an ETF’s shares may not develop or be maintained;
- The value of an ETF may be more volatile than the underlying portfolio of securities the ETF is designed to track;
- The cost of owning shares of the ETF may exceed those a client would incur by directly investing in the underlying securities and;
- Trading of an ETF’s shares may be halted if the listing exchange’s officials deem it appropriate, the shares are delisted from the exchange, or the activation of market-wide “circuit breakers” (which are tied to large decreases in stock prices) halts stock trading generally.
Grader Disclosures: Investment in equity strategies involves substantial risk and has the potential for partial or complete loss of funds invested. The sample portfolio and any accompanying charts are for informational purposes only and are not to be construed as a solicitation to buy or sell any financial instrument and should not be relied upon as the sole factor in an investment making decision. As a matter of normal and important disclosures to you, as a potential investor, please consider the following: The performance presented is not based on any actual securities trading, portfolio, or accounts, and the reported performance of the A, B, C, D, and F portfolios (collectively the “model portfolios”) should be considered mere “paper” or pro forma performance results based on Navellier’s research.
Investors evaluating any of Navellier & Associates, Inc.’s, (or its affiliates’) Investment Products must not use any information presented here, including the performance figures of the model portfolios, in their evaluation of any Navellier Investment Products. Navellier Investment Products include the firm’s mutual funds and managed accounts. The model portfolios, charts, and other information presented do not represent actual funded trades and are not actual funded portfolios. There are material differences between Navellier Investment Products’ portfolios and the model portfolios, research, and performance figures presented here. The model portfolios and the research results (1) may contain stocks or ETFs that are illiquid and difficult to trade; (2) may contain stock or ETF holdings materially different from actual funded Navellier Investment Product portfolios; (3) include the reinvestment of all dividends and other earnings, estimated trading costs, commissions, or management fees; and, (4) may not reflect prices obtained in an actual funded Navellier Investment Product portfolio. For these and other reasons, the reported performances of model portfolios do not reflect the performance results of Navellier’s actually funded and traded Investment Products. In most cases, Navellier’s Investment Products have materially lower performance results than the performances of the model portfolios presented.
This report contains statements that are, or may be considered to be, forward-looking statements. All statements that are not historical facts, including statements about our beliefs or expectations, are “forward-looking statements” within the meaning of The U.S. Private Securities Litigation Reform Act of 1995. These statements may be identified by such forward-looking terminology as “expect,” “estimate,” “plan,” “intend,” “believe,” “anticipate,” “may,” “will,” “should,” “could,” “continue,” “project,” or similar statements or variations of such terms. Our forward-looking statements are based on a series of expectations, assumptions, and projections, are not guarantees of future results or performance, and involve substantial risks and uncertainty as described in Form ADV Part 2A of our filing with the Securities and Exchange Commission (SEC), which is available at www.adviserinfo.sec.gov or by requesting a copy by emailing info@navellier.com. All of our forward-looking statements are as of the date of this report only. We can give no assurance that such expectations or forward-looking statements will prove to be correct. Actual results may differ materially. You are urged to carefully consider all such factors.
FEDERAL TAX ADVICE DISCLAIMER: As required by U.S. Treasury Regulations, you are informed that, to the extent this presentation includes any federal tax advice, the presentation is not written by Navellier to be used, and cannot be used, for the purpose of avoiding federal tax penalties. Navellier does not advise on any income tax requirements or issues. Use of any information presented by Navellier is for general information only and does not represent tax advice either express or implied. You are encouraged to seek professional tax advice for income tax questions and assistance.
IMPORTANT NEWSLETTER DISCLOSURE:The hypothetical performance results for investment newsletters that are authored or edited by Louis Navellier, including Louis Navellier’s Growth Investor, Louis Navellier’s Breakthrough Stocks, Louis Navellier’s Accelerated Profits, and Louis Navellier’s Platinum Club, are not based on any actual securities trading, portfolio, or accounts, and the newsletters’ reported hypothetical performances should be considered mere “paper” or proforma hypothetical performance results and are not actual performance of real world trades. Navellier & Associates, Inc. does not have any relation to or affiliation with the owner of these newsletters. There are material differences between Navellier Investment Products’ portfolios and the InvestorPlace Media, LLC newsletter portfolios authored by Louis Navellier. The InvestorPlace Media, LLC newsletters contain hypothetical performance that do not include transaction costs, advisory fees, or other fees a client might incur if actual investments and trades were being made by an investor. As a result, newsletter performance should not be used to evaluate Navellier Investment services which are separate and different from the newsletters. The owner of the newsletters is InvestorPlace Media, LLC and any questions concerning the newsletters, including any newsletter advertising or hypothetical Newsletter performance claims, (which are calculated solely by Investor Place Media and not Navellier) should be referred to InvestorPlace Media, LLC at (800) 718-8289.
Please note that Navellier & Associates and the Navellier Private Client Group are managed completely independent of the newsletters owned and published by InvestorPlace Media, LLC and written and edited by Louis Navellier, and investment performance of the newsletters should in no way be considered indicative of potential future investment performance for any Navellier & Associates separately managed account portfolio. Potential investors should consult with their financial advisor before investing in any Navellier Investment Product.
Navellier claims compliance with Global Investment Performance Standards (GIPS). To receive a complete list and descriptions of Navellier’s composites and/or a presentation that adheres to the GIPS standards, please contact Navellier or click here. It should not be assumed that any securities recommendations made by Navellier & Associates, Inc. in the future will be profitable or equal the performance of securities made in this report.
FactSet Disclosure: Navellier does not independently calculate the statistical information included in the attached report. The calculation and the information are provided by FactSet, a company not related to Navellier. Although information contained in the report has been obtained from FactSet and is based on sources Navellier believes to be reliable, Navellier does not guarantee its accuracy, and it may be incomplete or condensed. The report and the related FactSet sourced information are provided on an “as is” basis. The user assumes the entire risk of any use made of this information. Investors should consider the report as only a single factor in making their investment decision. The report is for informational purposes only and is not intended as an offer or solicitation for the purchase or sale of a security. FactSet sourced information is the exclusive property of FactSet. Without prior written permission of FactSet, this information may not be reproduced, disseminated or used to create any financial products. All indices are unmanaged and performance of the indices include reinvestment of dividends and interest income, unless otherwise noted, are not illustrative of any particular investment and an investment cannot be made in any index. Past performance is no guarantee of future results.