by Bryan Perry
September 4, 2024
Heading into September, the Mag 7 and other leading tech stocks have exhibited extreme volatility. In reviewing the chart action of the Round-Hill Magnificent Seven ETF (MAGS), it peaked on July 7 at nearly $50, then corrected 23% in three weeks and has since recovered roughly half of that loss.
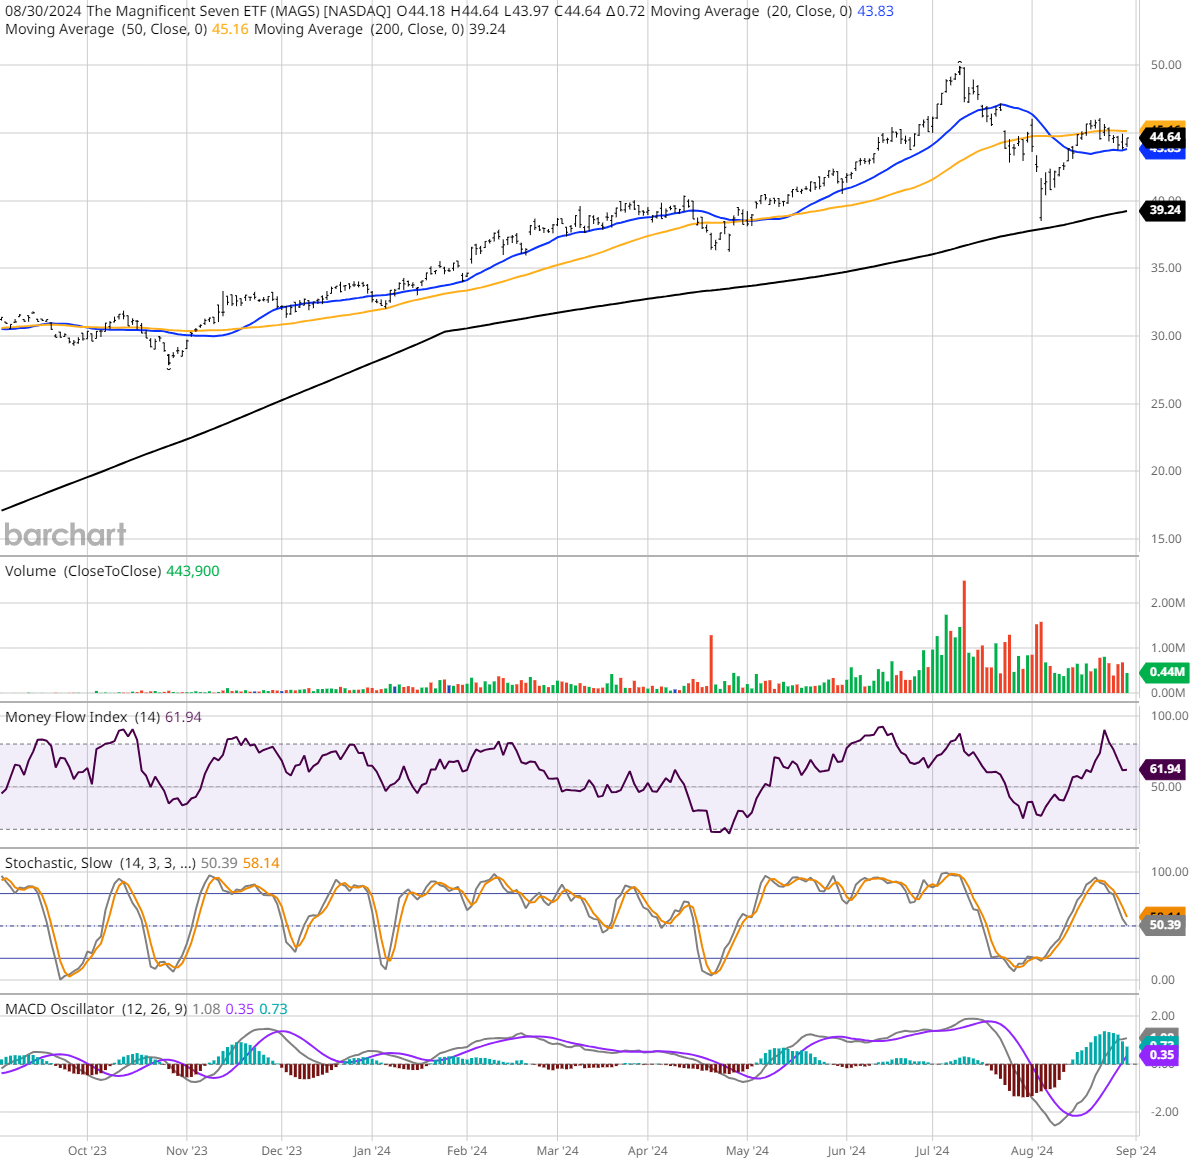
Graphs are for illustrative and discussion purposes only. Please read important disclosures at the end of this commentary.
There was a lot of technical damage done during this sharp and swift selloff, but most of the top seven holdings are showing more constructive price action of late, with the group setting up nicely to enter the fourth quarter, beginning October 1st, poised to retake a market leadership role.
For the past month, there has also been some bullish rotation into utilities (XLU), real estate (XLRE), financials (XLF), industrials (XLI), consumer staples (XLP), defense (ITA), materials (XLB) and gold (GLD). This broadening of the market is hugely constructive as the tech sector consolidates.
The advance/decline line for the S&P 500 has been very impressive during August, validating the broadening out and rotation into other sectors, which is highly supportive of a market that has the potential to rally further while still having to account for risks surrounding the presidential elections, the Middle East, China, and economic data such as this coming Friday’s widely anticipated employment data.
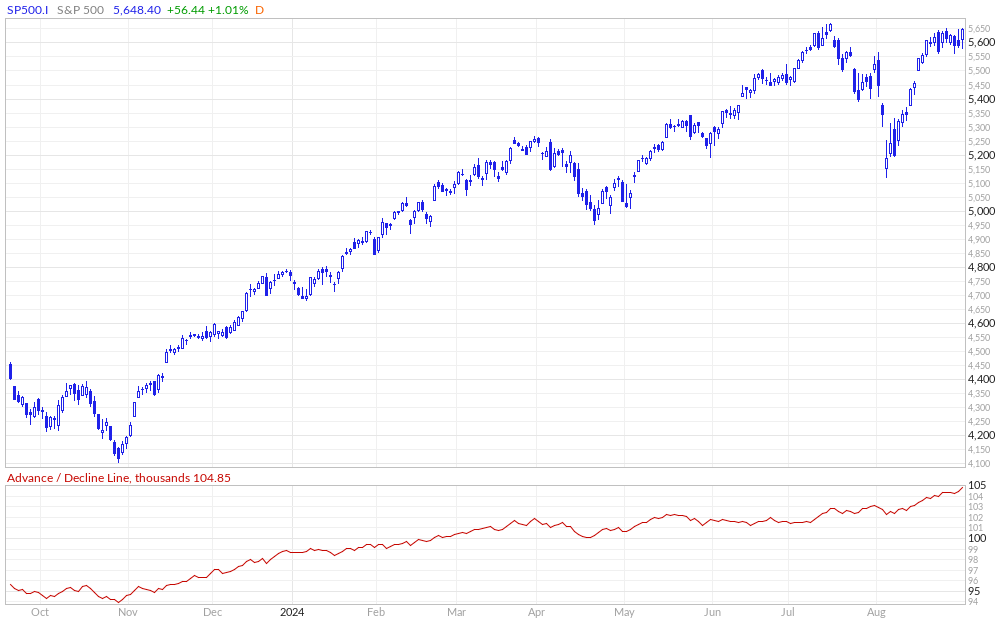
www.marketinout.com
Graphs are for illustrative and discussion purposes only. Please read important disclosures at the end of this commentary.
According to FactSet, for the current third quarter of 2024, 48 S&P 500 companies have issued negative EPS guidance, and 41 S&P 500 companies have issued positive EPS guidance. The S&P is currently trading at a forward P/E of 21x, which is above the 5-year average (19.4) and the 10-year average (17.9).
This premium I believe reflects the concentration of the Magnificent Seven stocks, which still dominate the top ten holdings of the SPDR S&P 500 ETF (SPY), making up 31% of the total assets. The market should continue trading at a premium, as these top holdings generate exceptional top and bottom-line growth.
It should be apparent to investors that the disruptive transformational changes and advancements being brought about by the implementation of Artificial Intelligence (AI) are not some temporary paradigm shift that has a half-life of 12-18 months. Big-name hyper-scalers will continue to spend the greatest aggregate amount of investment capital of all time on this technological revolution.
Even after these companies reported record sales and earnings attributed to AI-driven revenues, many on Wall Street and among investment and market professionals remain skeptical of the spending wave of future AI infrastructure. Therefore, it stands to reason that investors should source one of the soundest authorities in the business of research that covers the most extensive areas of technology cycles.
International Data Corporation (IDC) is a provider of market research data and advisory services focused solely on the technology industry. Founded in 1964, IDC’s analysis and insight helps IT professionals, business executives and the investment community make fact-based technology decisions and achieve their business goals. In a recent report, IDC estimated AI worldwide spending reaching $632 billion:
“Worldwide spending on artificial intelligence (AI), including AI-enabled applications, infrastructure, and related IT and business services, will more than double by 2028 when it is expected to reach $632 billion, according to a new forecast from the International Data Corporation (IDC) Worldwide AI and Generative AI Spending Guide. The rapid incorporation of AI, and generative AI (GenAI) in particular, into a wide range of products will result in a compound annual growth rate (CAGR) of 29.0% over the 2024-2028 forecast period.”
–Computer World, August 19, 2024
Eric Schmidt, co-founder of Schmidt Futures, and former CEO of Google stated, “I’m talking to the big companies and the big companies are telling me that they need $10 billion, $20 billion, $50 billion, $100 billion,” he said. Schmidt said OpenAI’s Sam Altman told him it’s going to take $300 billion to build out the required AI infrastructure. So, the AI train is not even close to reaching the next station.
If these forecasts are accurate, investors have another 3-4 years of leadership for the best-of-breed stocks that are leading the capital investment wave, but more importantly, the stocks of those leading companies providing the infrastructure for the ongoing buildout of AI. These are semiconductor manufacturers, semiconductor equipment manufacturers, semiconductor foundries, and network equipment manufacturers.
The list of these special stocks is not that deep, and they are volatile. One strategy would be selling out-of-the-money covered calls where option premiums are rich. Selling out-of-the-money covered calls on stocks like NVIDIA Inc. (NVDA) on short-term price spikes, investors can theoretically take advantage of the volatility in the stock price.
With good timing – and it’s all about timing – one can sell 30–45-day calls into selected rallies and take full advantage of this volatile market. Long-term investors might consider selling calls on half positions so as not to risk having one’s entire position called away. This 5-6 year AI spending boom should provide opportunity found in no other sector of today’s market.
Navellier & Associates owns Nvidia Corp (NVDA), and Alphabet Inc. Class A (GOOGL), in managed accounts. Bryan Perry does not own Nvidia Corp (NVDA), or Alphabet Inc. Class A (GOOGL), personally.
All content above represents the opinion of Bryan Perry of Navellier & Associates, Inc.
Also In This Issue
A Look Ahead by Louis Navellier
Nvidia Delivers Spectacular Earnings Report
Income Mail by Bryan Perry
Turning Volatility Into AI-Related Covered Call Trading Strategy
Growth Mail by Gary Alexander
A 1949 Book Provides a Key to Puncturing Political Panaceas
Global Mail by Ivan Martchev
Will This be a September to Remember?
Sector Spotlight by Jason Bodner
August is Mercifully Over – Will the Market Return to Reality?
View Full Archive
Read Past Issues Here

Bryan Perry
SENIOR DIRECTOR
Bryan Perry is a Senior Director with Navellier Private Client Group, advising and facilitating high net worth investors in the pursuit of their financial goals.
Bryan’s financial services career spanning the past three decades includes over 20-years of wealth management experience with Wall Street firms that include Bear Stearns, Lehman Brothers and Paine Webber, working with both retail and institutional clients. Bryan earned a B.A. in Political Science from Virginia Polytechnic Institute & State University and currently holds a Series 65 license. All content of “Income Mail” represents the opinion of Bryan Perry
Important Disclosures:
Although information in these reports has been obtained from and is based upon sources that Navellier believes to be reliable, Navellier does not guarantee its accuracy and it may be incomplete or condensed. All opinions and estimates constitute Navellier’s judgment as of the date the report was created and are subject to change without notice. These reports are for informational purposes only and are not a solicitation for the purchase or sale of a security. Any decision to purchase securities mentioned in these reports must take into account existing public information on such securities or any registered prospectus.To the extent permitted by law, neither Navellier & Associates, Inc., nor any of its affiliates, agents, or service providers assumes any liability or responsibility nor owes any duty of care for any consequences of any person acting or refraining to act in reliance on the information contained in this communication or for any decision based on it.
Past performance is no indication of future results. Investment in securities involves significant risk and has the potential for partial or complete loss of funds invested. It should not be assumed that any securities recommendations made by Navellier. in the future will be profitable or equal the performance of securities made in this report. Dividend payments are not guaranteed. The amount of a dividend payment, if any, can vary over time and issuers may reduce dividends paid on securities in the event of a recession or adverse event affecting a specific industry or issuer.
None of the stock information, data, and company information presented herein constitutes a recommendation by Navellier or a solicitation to buy or sell any securities. Any specific securities identified and described do not represent all of the securities purchased, sold, or recommended for advisory clients. The holdings identified do not represent all of the securities purchased, sold, or recommended for advisory clients and the reader should not assume that investments in the securities identified and discussed were or will be profitable.
Information presented is general information that does not take into account your individual circumstances, financial situation, or needs, nor does it present a personalized recommendation to you. Individual stocks presented may not be suitable for every investor. Investment in securities involves significant risk and has the potential for partial or complete loss of funds invested. Investment in fixed income securities has the potential for the investment return and principal value of an investment to fluctuate so that an investor’s holdings, when redeemed, may be worth less than their original cost.
One cannot invest directly in an index. Index is unmanaged and index performance does not reflect deduction of fees, expenses, or taxes. Presentation of Index data does not reflect a belief by Navellier that any stock index constitutes an investment alternative to any Navellier equity strategy or is necessarily comparable to such strategies. Among the most important differences between the Indices and Navellier strategies are that the Navellier equity strategies may (1) incur material management fees, (2) concentrate its investments in relatively few stocks, industries, or sectors, (3) have significantly greater trading activity and related costs, and (4) be significantly more or less volatile than the Indices.
ETF Risk: We may invest in exchange traded funds (“ETFs”) and some of our investment strategies are generally fully invested in ETFs. Like traditional mutual funds, ETFs charge asset-based fees, but they generally do not charge initial sales charges or redemption fees and investors typically pay only customary brokerage fees to buy and sell ETF shares. The fees and costs charged by ETFs held in client accounts will not be deducted from the compensation the client pays Navellier. ETF prices can fluctuate up or down, and a client account could lose money investing in an ETF if the prices of the securities owned by the ETF go down. ETFs are subject to additional risks:
- ETF shares may trade above or below their net asset value;
- An active trading market for an ETF’s shares may not develop or be maintained;
- The value of an ETF may be more volatile than the underlying portfolio of securities the ETF is designed to track;
- The cost of owning shares of the ETF may exceed those a client would incur by directly investing in the underlying securities; and
- Trading of an ETF’s shares may be halted if the listing exchange’s officials deem it appropriate, the shares are delisted from the exchange, or the activation of market-wide “circuit breakers” (which are tied to large decreases in stock prices) halts stock trading generally.
Grader Disclosures: Investment in equity strategies involves substantial risk and has the potential for partial or complete loss of funds invested. The sample portfolio and any accompanying charts are for informational purposes only and are not to be construed as a solicitation to buy or sell any financial instrument and should not be relied upon as the sole factor in an investment making decision. As a matter of normal and important disclosures to you, as a potential investor, please consider the following: The performance presented is not based on any actual securities trading, portfolio, or accounts, and the reported performance of the A, B, C, D, and F portfolios (collectively the “model portfolios”) should be considered mere “paper” or pro forma performance results based on Navellier’s research.
Investors evaluating any of Navellier & Associates, Inc.’s, (or its affiliates’) Investment Products must not use any information presented here, including the performance figures of the model portfolios, in their evaluation of any Navellier Investment Products. Navellier Investment Products include the firm’s mutual funds and managed accounts. The model portfolios, charts, and other information presented do not represent actual funded trades and are not actual funded portfolios. There are material differences between Navellier Investment Products’ portfolios and the model portfolios, research, and performance figures presented here. The model portfolios and the research results (1) may contain stocks or ETFs that are illiquid and difficult to trade; (2) may contain stock or ETF holdings materially different from actual funded Navellier Investment Product portfolios; (3) include the reinvestment of all dividends and other earnings, estimated trading costs, commissions, or management fees; and, (4) may not reflect prices obtained in an actual funded Navellier Investment Product portfolio. For these and other reasons, the reported performances of model portfolios do not reflect the performance results of Navellier’s actually funded and traded Investment Products. In most cases, Navellier’s Investment Products have materially lower performance results than the performances of the model portfolios presented.
This report contains statements that are, or may be considered to be, forward-looking statements. All statements that are not historical facts, including statements about our beliefs or expectations, are “forward-looking statements” within the meaning of The U.S. Private Securities Litigation Reform Act of 1995. These statements may be identified by such forward-looking terminology as “expect,” “estimate,” “plan,” “intend,” “believe,” “anticipate,” “may,” “will,” “should,” “could,” “continue,” “project,” or similar statements or variations of such terms. Our forward-looking statements are based on a series of expectations, assumptions, and projections, are not guarantees of future results or performance, and involve substantial risks and uncertainty as described in Form ADV Part 2A of our filing with the Securities and Exchange Commission (SEC), which is available at www.adviserinfo.sec.gov or by requesting a copy by emailing info@navellier.com. All of our forward-looking statements are as of the date of this report only. We can give no assurance that such expectations or forward-looking statements will prove to be correct. Actual results may differ materially. You are urged to carefully consider all such factors.
FEDERAL TAX ADVICE DISCLAIMER: As required by U.S. Treasury Regulations, you are informed that, to the extent this presentation includes any federal tax advice, the presentation is not written by Navellier to be used, and cannot be used, for the purpose of avoiding federal tax penalties. Navellier does not advise on any income tax requirements or issues. Use of any information presented by Navellier is for general information only and does not represent tax advice either express or implied. You are encouraged to seek professional tax advice for income tax questions and assistance.
IMPORTANT NEWSLETTER DISCLOSURE:The hypothetical performance results for investment newsletters that are authored or edited by Louis Navellier, including Louis Navellier’s Growth Investor, Louis Navellier’s Breakthrough Stocks, Louis Navellier’s Accelerated Profits, and Louis Navellier’s Platinum Club, are not based on any actual securities trading, portfolio, or accounts, and the newsletters’ reported hypothetical performances should be considered mere “paper” or proforma hypothetical performance results and are not actual performance of real world trades. Navellier & Associates, Inc. does not have any relation to or affiliation with the owner of these newsletters. There are material differences between Navellier Investment Products’ portfolios and the InvestorPlace Media, LLC newsletter portfolios authored by Louis Navellier. The InvestorPlace Media, LLC newsletters contain hypothetical performance that do not include transaction costs, advisory fees, or other fees a client might incur if actual investments and trades were being made by an investor. As a result, newsletter performance should not be used to evaluate Navellier Investment services which are separate and different from the newsletters. The owner of the newsletters is InvestorPlace Media, LLC and any questions concerning the newsletters, including any newsletter advertising or hypothetical Newsletter performance claims, (which are calculated solely by Investor Place Media and not Navellier) should be referred to InvestorPlace Media, LLC at (800) 718-8289.
Please note that Navellier & Associates and the Navellier Private Client Group are managed completely independent of the newsletters owned and published by InvestorPlace Media, LLC and written and edited by Louis Navellier, and investment performance of the newsletters should in no way be considered indicative of potential future investment performance for any Navellier & Associates separately managed account portfolio. Potential investors should consult with their financial advisor before investing in any Navellier Investment Product.
Navellier claims compliance with Global Investment Performance Standards (GIPS). To receive a complete list and descriptions of Navellier’s composites and/or a presentation that adheres to the GIPS standards, please contact Navellier or click here. It should not be assumed that any securities recommendations made by Navellier & Associates, Inc. in the future will be profitable or equal the performance of securities made in this report.
FactSet Disclosure: Navellier does not independently calculate the statistical information included in the attached report. The calculation and the information are provided by FactSet, a company not related to Navellier. Although information contained in the report has been obtained from FactSet and is based on sources Navellier believes to be reliable, Navellier does not guarantee its accuracy, and it may be incomplete or condensed. The report and the related FactSet sourced information are provided on an “as is” basis. The user assumes the entire risk of any use made of this information. Investors should consider the report as only a single factor in making their investment decision. The report is for informational purposes only and is not intended as an offer or solicitation for the purchase or sale of a security. FactSet sourced information is the exclusive property of FactSet. Without prior written permission of FactSet, this information may not be reproduced, disseminated or used to create any financial products. All indices are unmanaged and performance of the indices include reinvestment of dividends and interest income, unless otherwise noted, are not illustrative of any particular investment and an investment cannot be made in any index. Past performance is no guarantee of future results.