by Jason Bodner
August 27, 2024
“3,2,1… Lift-off!”

When I was a kid, I loved the hoopla around rocket launches. Imagine hurtling upward at up to 25,000 miles per hour – seven miles per second – the speed required for escape velocity.
The energy pent up in rocket fuel makes this happen, but nothing begins until we hear that countdown.
Investors have been waiting for forever to hear some sort of countdown leading to a “lift-off” for stocks.
Well, we just heard it… Fed Chair Powell just said: “the time has come for policy to adjust.”
Those are the sexiest words any stock investors could hear… the same as “lift-off” for rocket fans.
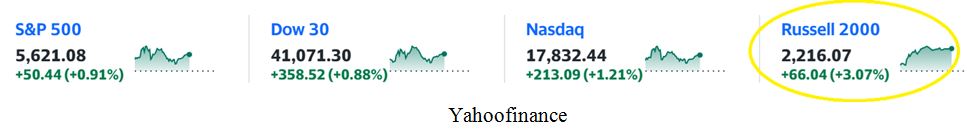
Stocks, especially small cap stocks, are set to explode higher. As I write this, just after Powell’s proclamation, markets are already zooming. This list shows small cap stocks rising the most:
Graphs are for illustrative and discussion purposes only. Please read important disclosures at the end of this commentary.
If you think you’ve missed your opportunity, think again.
Stocks should rocket higher in the coming months, and even years. Let me show you why …
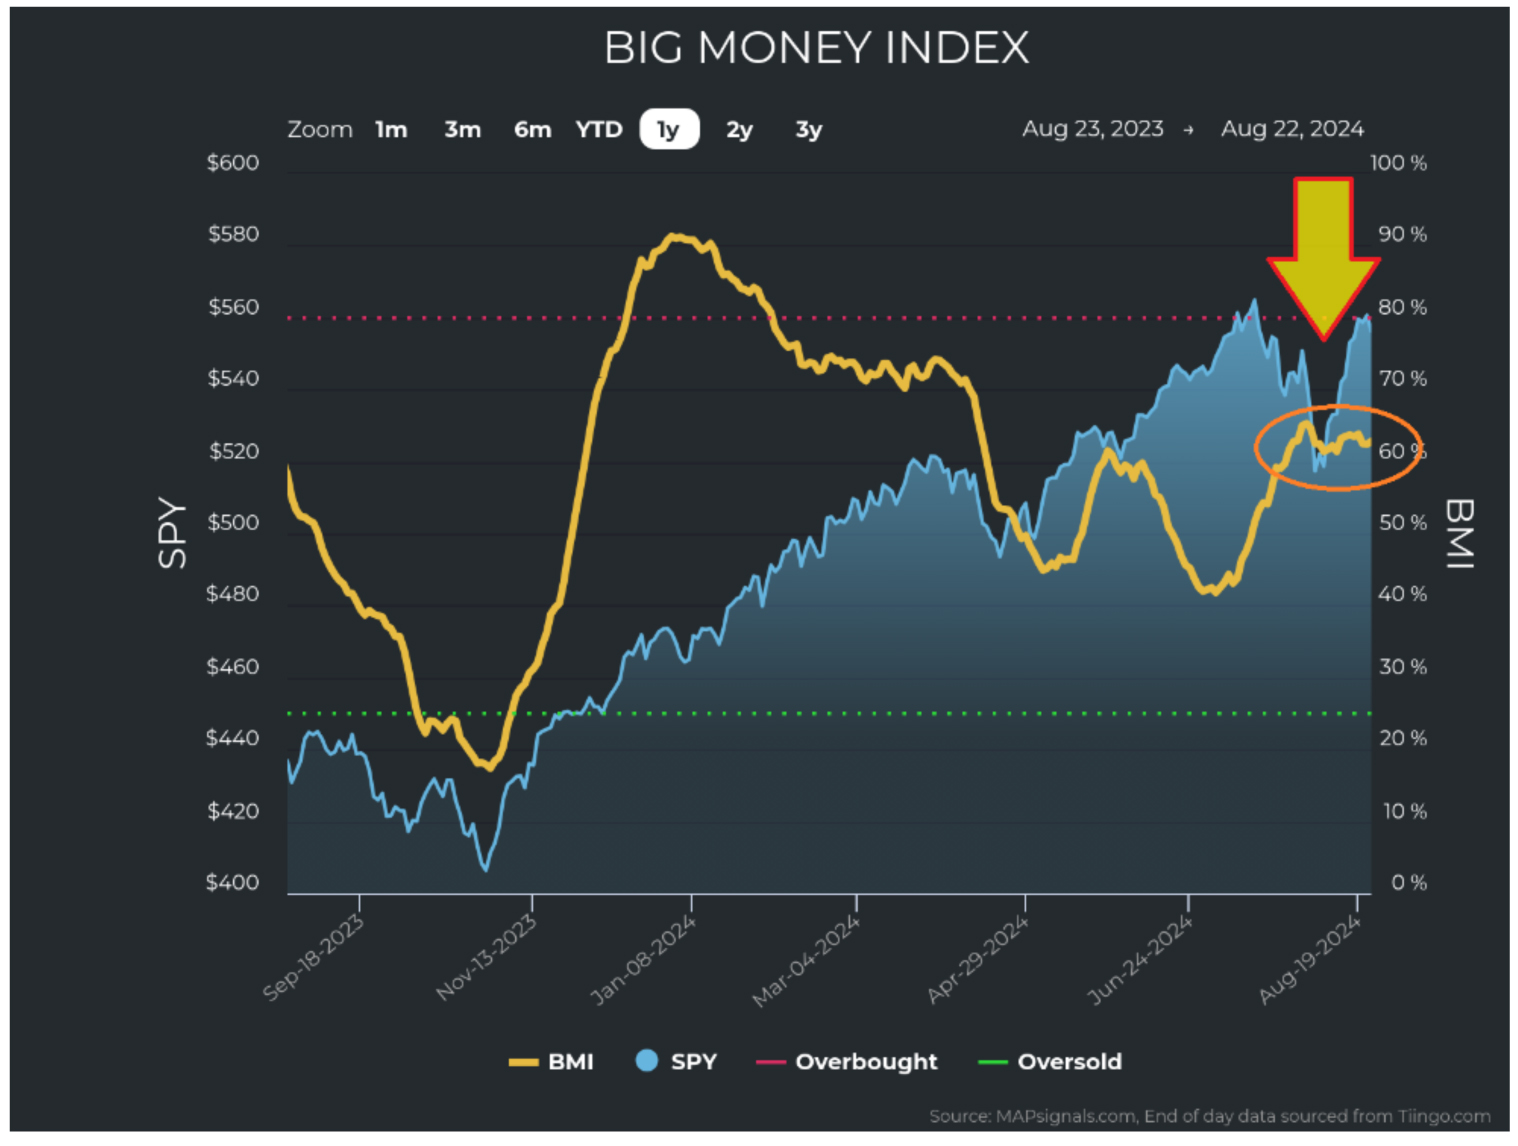
First, let’s recap the head fake in the first week of August. Recession fears were in the air, and low-liquidity markets can easily swoon in August. The Japanese carry trade unwound wickedly fast. Selling reached fever-pitch levels without warning. The result was an 8% drop in the S&P 500. And then, before the market had a chance to react, it vanished. The S&P rebounded 8.6%, as if nothing ever happened.
The Big Money Index (BMI) couldn’t even digest the violent selling, as it is calculated on a 25-day moving average basis. Notice that, as the market sank, the BMI barely flinched:
Graphs are for illustrative and discussion purposes only. Please read important disclosures at the end of this commentary.
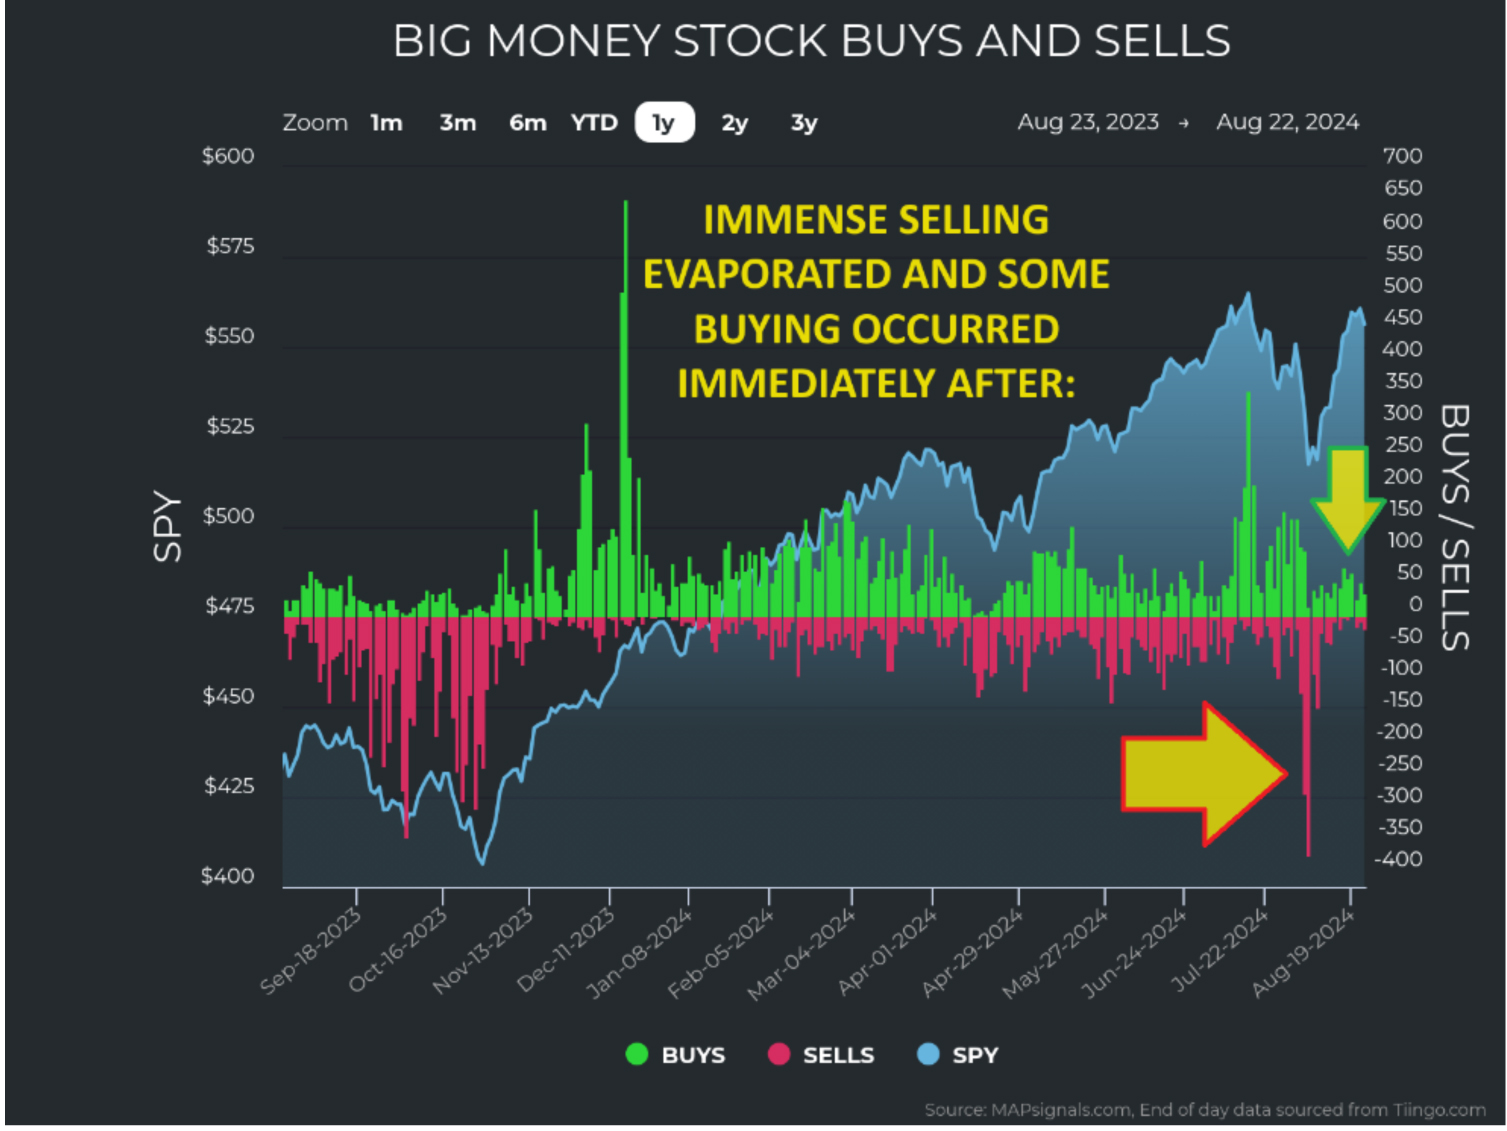
Also notice how selling immediately dissipated and gave way to unusually large buying (green shoots):
Graphs are for illustrative and discussion purposes only. Please read important disclosures at the end of this commentary.
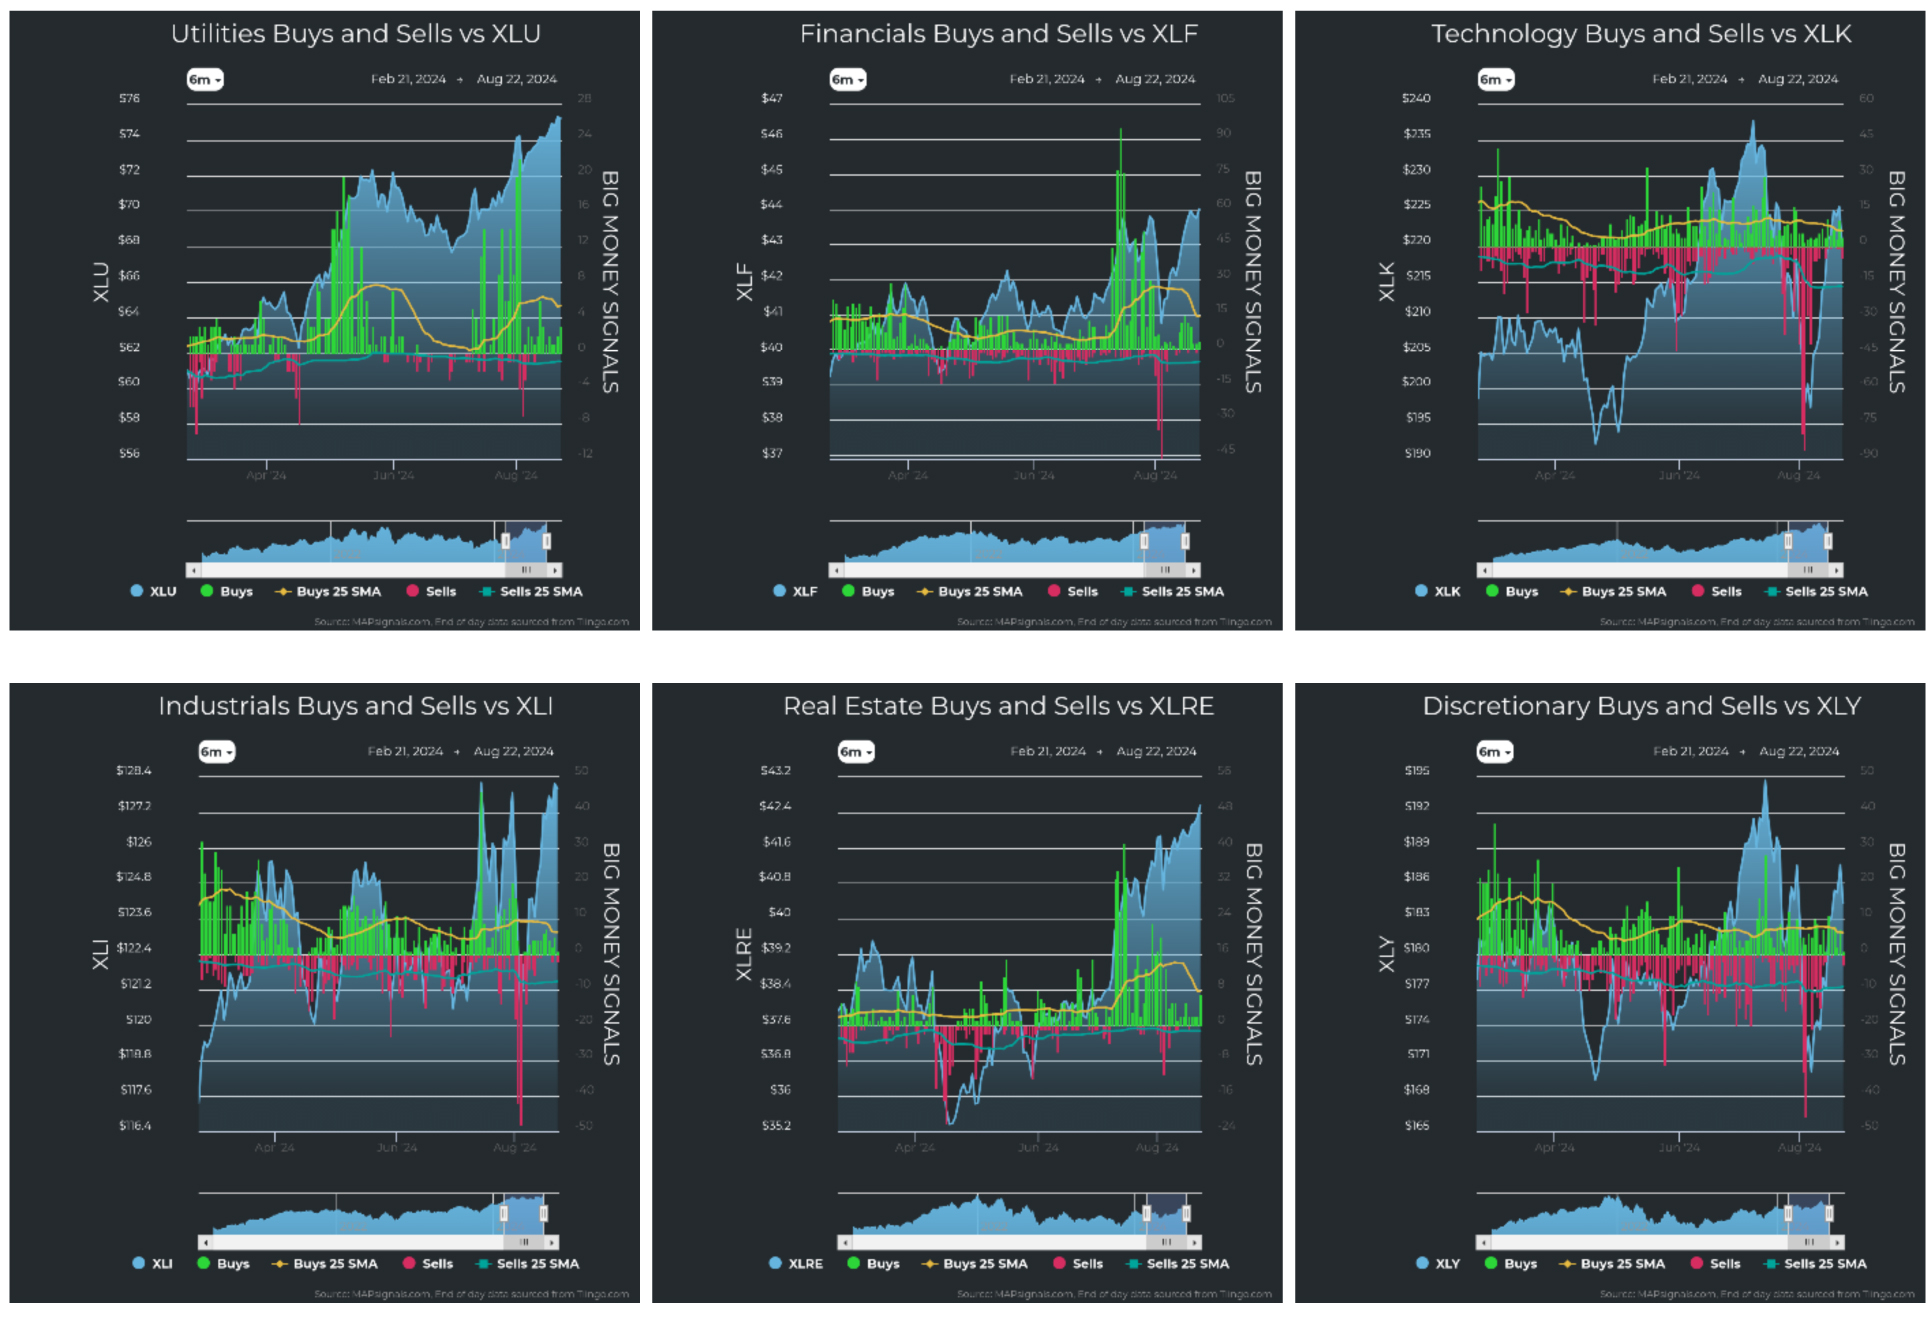
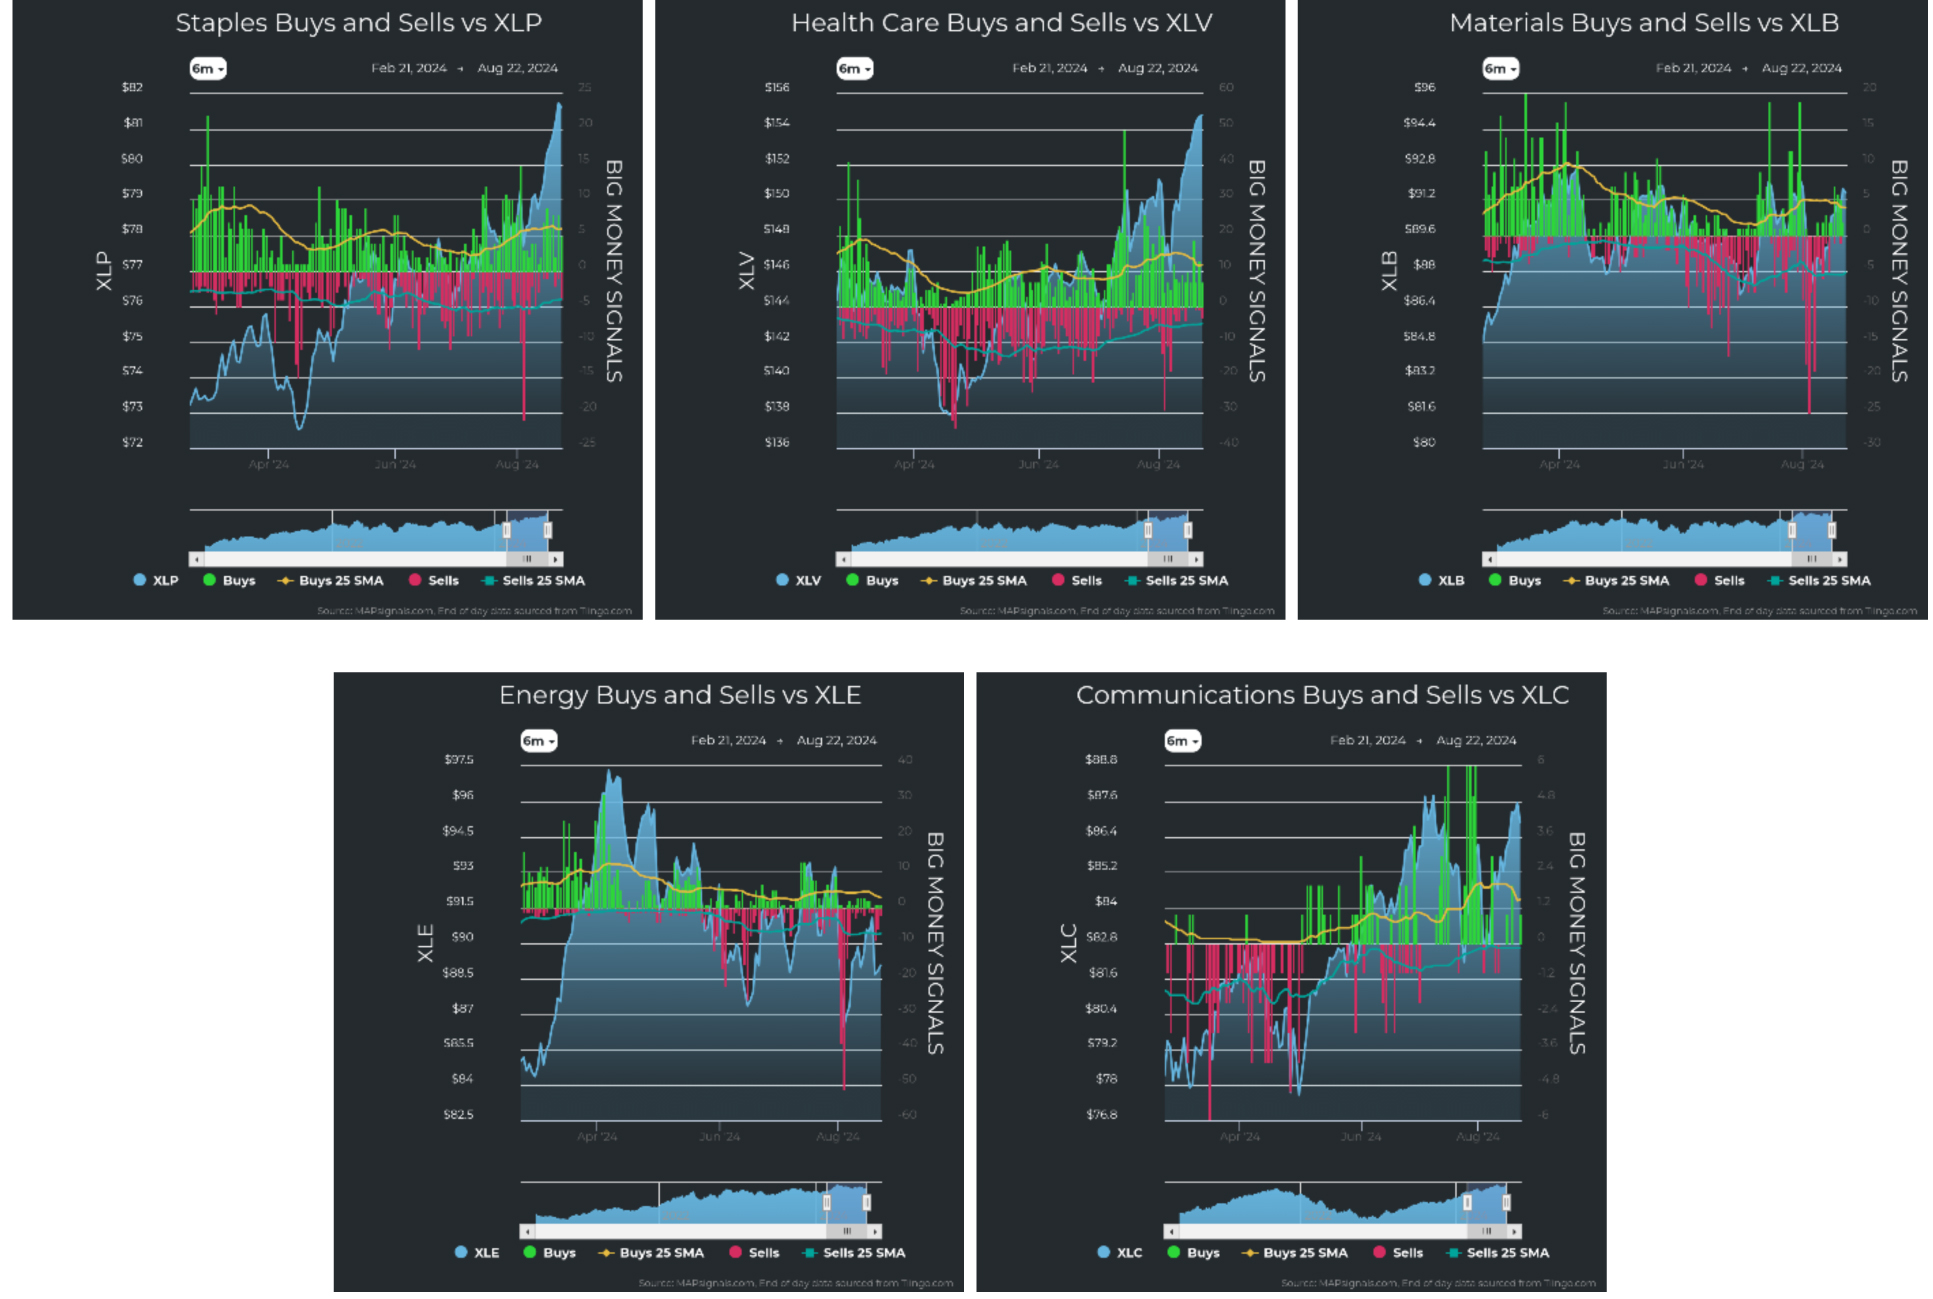
Selling hit some sectors harder than others. We saw Technology, Industrials, Discretionary, Materials, and Energy hit hard. But each of those sectors also bounced equally hard for a lightning-fast recovery:
Graphs are for illustrative and discussion purposes only. Please read important disclosures at the end of this commentary.
Sector strength and weakness remains in an unusual place, historically speaking. Bull markets of recent years are often led by tech and discretionary. Tech has been slowly climbing the ranks, but Utilities and Financials are sector leaders now. One school of thought is that banks will thrive in a falling rate environment as they facilitate more lending and handle more transactions in a prospering economy, and utilities offer high yields in a falling yield environment. This also explains Real Estate’s recent resiliency:
![]()
Graphs are for illustrative and discussion purposes only. Please read important disclosures at the end of this commentary.
Before we get into why Powell’s short statement could unleash a torrent of money into stocks, let’s quickly check on where we are now. Below are some charts that show the state of the market. The chart on the left, in green, shows days in which there are more buys than sells, when buying is greater than 50% of each day’s signals. That’s been most of the time since 2020. The red chart on the right shows days on which buying is less than 50%. That’s when sellers are in control. Clearly, that happens less of the time. (COVID was particularly heavy in early 2020, and the selling in 2022 was particularly heavy too).
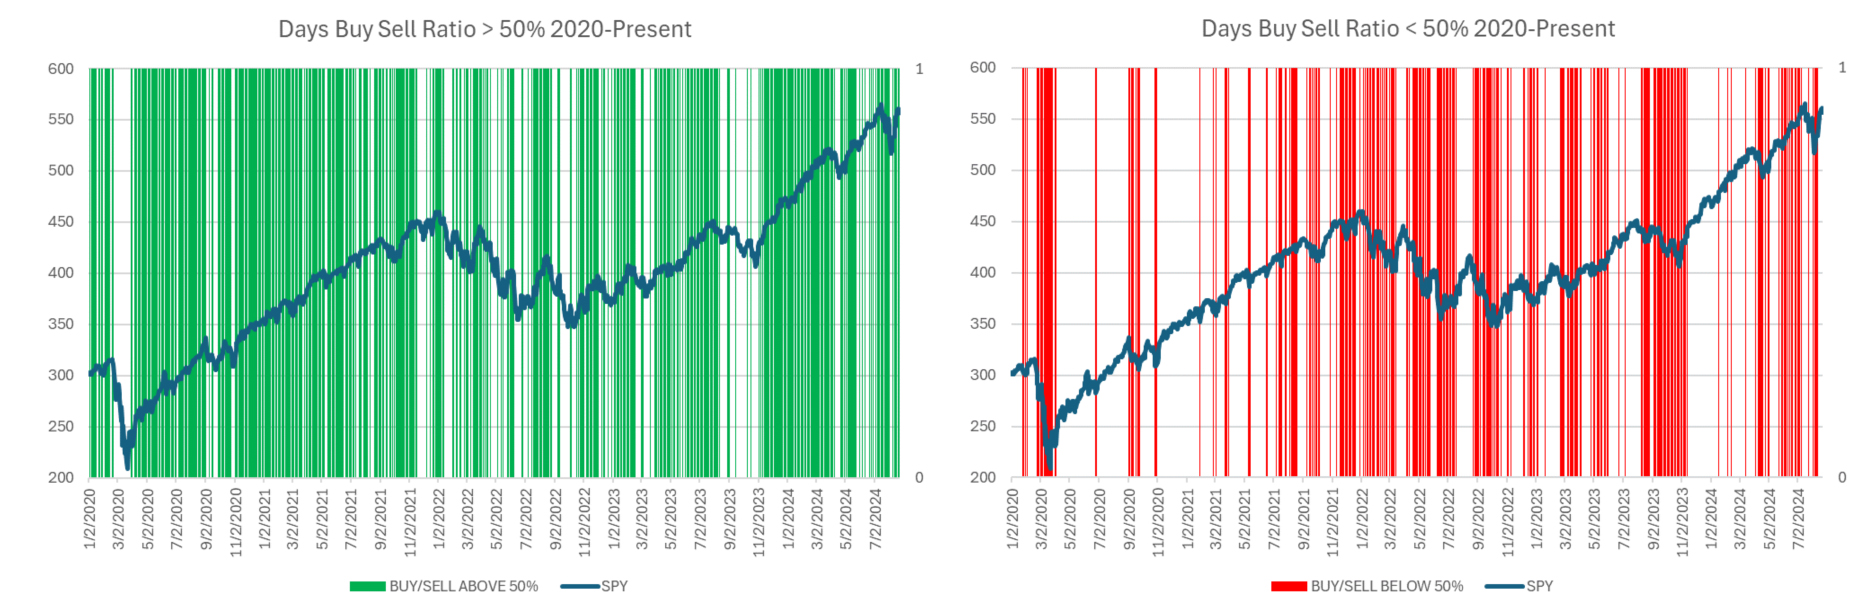
Graphs are for illustrative and discussion purposes only. Please read important disclosures at the end of this commentary.
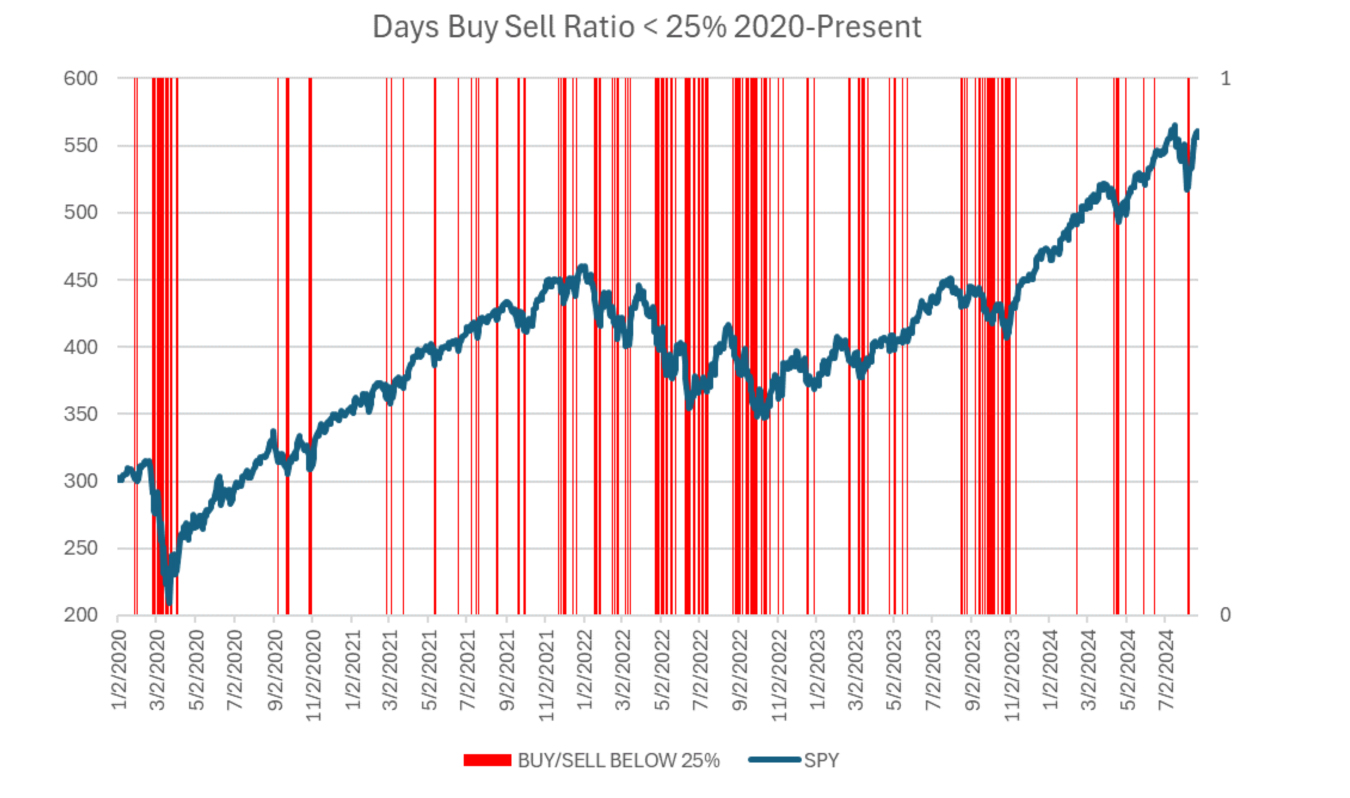
Below, we see extreme selling, when buying was below 25%. They often highlight troughs and don’t last particularly long. The latest instances of that happening was in early August, 2024:
Graphs are for illustrative and discussion purposes only. Please read important disclosures at the end of this commentary.
That natural state of the market is to see more buying than selling. And much of the recent few years’ volatility stems from uncertainty over interest rates.
Perhaps it would have been better if we had slept or vacationed through the first two weeks of August. Because it’s almost as if nothing happened. Only now, we have those eight wonderful words uttered by Jerome Powell, perhaps the most influential person on earth now. Powell said it: rates are about to fall.
When rates have fallen in the past, the rate-cutting cycle has often overlapped with a recession. That is – looser monetary policy is instituted to stimulate the economy. But that is not always the case… like right now. There is no recession. The latest recessionary fears from two weeks ago vanished into the ether. And most S&P 500 CEOs are not even talking about a recession anymore. In fact, Bank of America has removed recession from the base cases of their research models, according to the bank’s CEO.
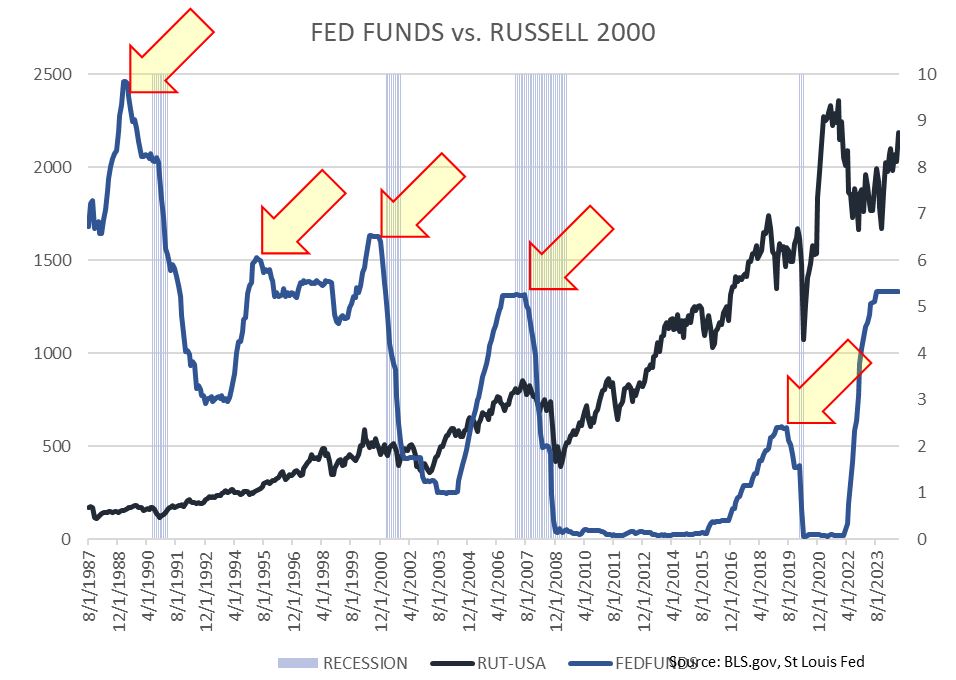
Here are rate cuts charted to the Russell 2000 index, with rate cuts often correlated with a small-cap rally.
Source: BLS.gov, St. Louis Fed
Graphs are for illustrative and discussion purposes only. Please read important disclosures at the end of this commentary.
I found 1995 particularly interesting, because rates fell when there was no recession. The forward returns for the Russell 2000 were superb, especially looking 12 and 24 months out:
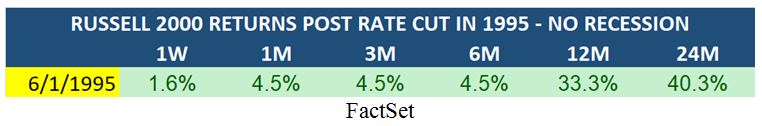
Graphs are for illustrative and discussion purposes only. Please read important disclosures at the end of this commentary.
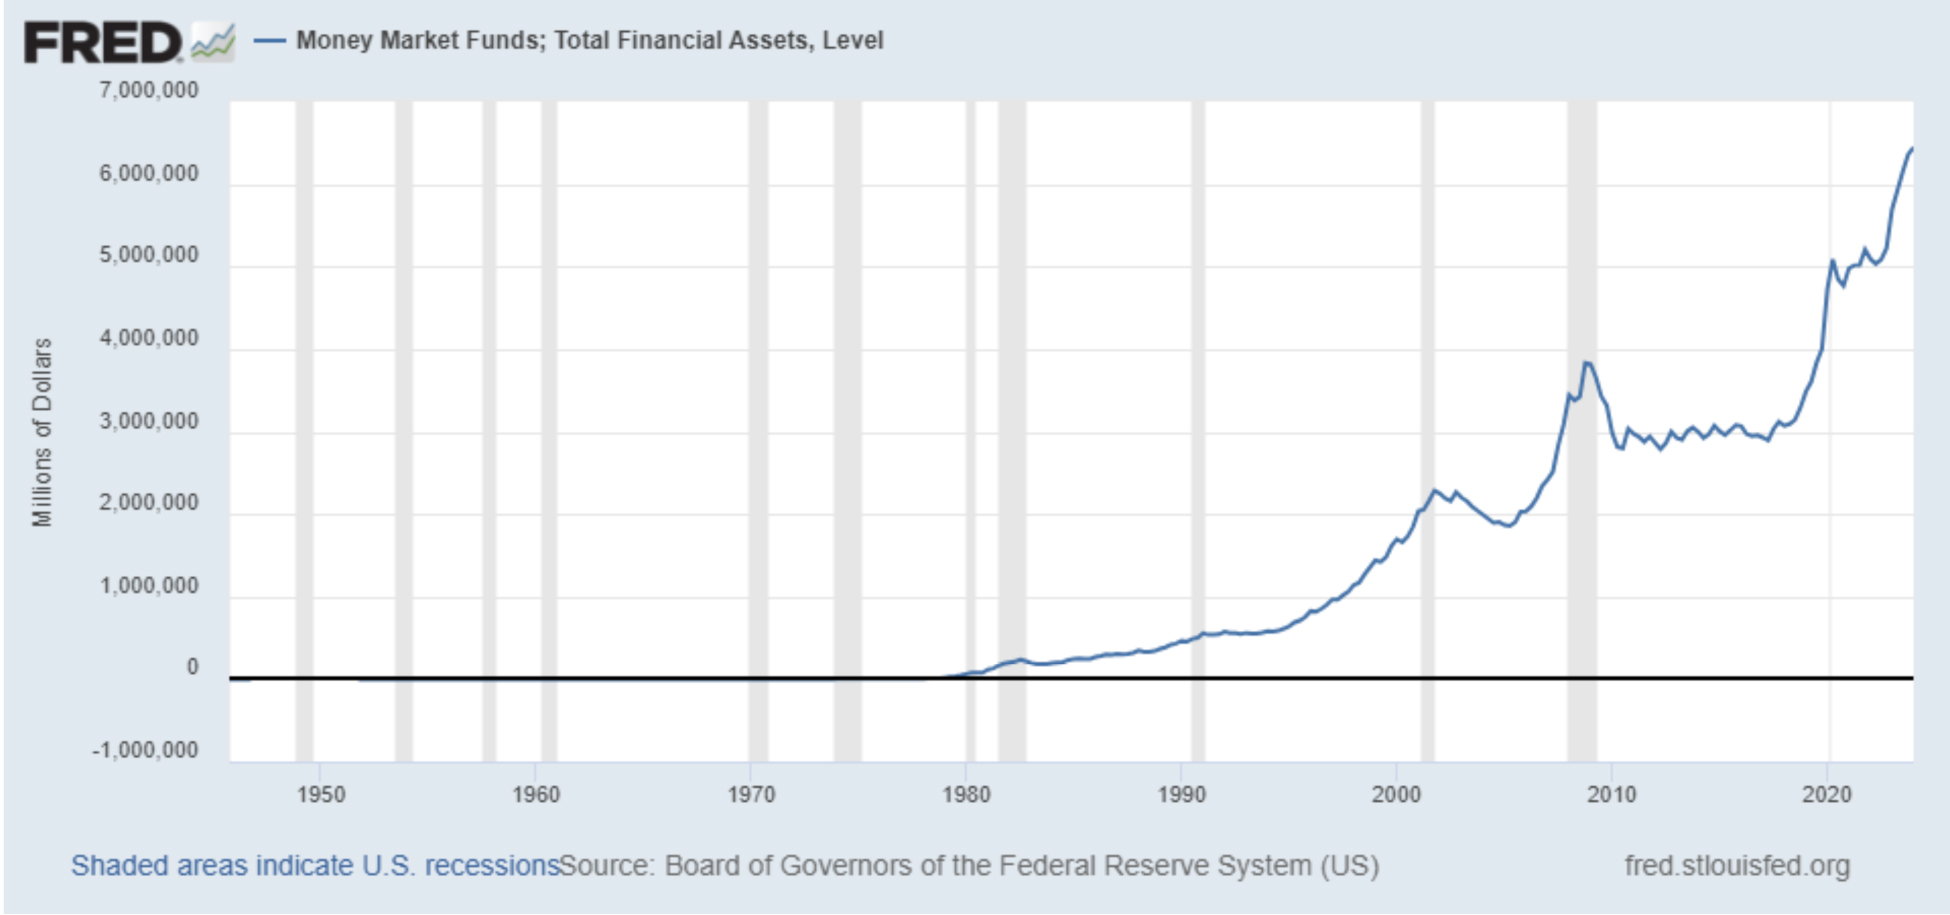
Now, here’s what makes this time different: The record stockpile of cash sitting in money market accounts is huge, and still rising. According to “FRED,” the St Louis Fed website, there is an astonishing $6.44 trillion sitting in money markets – the highest on record… ever, by a long shot:
Graphs are for illustrative and discussion purposes only. Please read important disclosures at the end of this commentary.
And holding money in cash makes sense to a lot of investors with high short-term rates. Fidelity’s Government Money Market Fund SPAXX has a yield of 4.98%. With the Fed Funds Effective Rate of 5.33%, you can park your money in money market funds and earn 5%. It’s a no-brainer, but no longer.
With September 18th bringing the first of three possible rate cuts for 2024, and more on the horizon for 2025, stocks are going to offer more enticing returns than plummeting yields in money market accounts.
And with small caps historically rising with falling rates, there will be oodles of opportunity to exploit. The key, of course, is knowing which stocks to buy. That happens to be our specialty, but I would suggest starting with a few simple strict criteria to help you narrow the playing field. I find stocks by looking for:
- Growing 1- & 3-year sales and earnings
- Expanding profit margins
- Low debt/equity ratios
- Strong institutional support
I just performed a screen filtering 5,535 stocks for those criteria and was left with 215, weeding out over 96% of stocks in the process. It pays to be choosy.
Rates cuts are finally here. The cash bubble will finally pop, and stocks should lift off in the process.
Life’s too short to always worry about bad times that will likely not come.
In the words of Jack Nicholson: “My motto is: More good times.”

All content above represents the opinion of Jason Bodner of Navellier & Associates, Inc.
Also In This Issue
A Look Ahead by Louis Navellier
The Fed Finally Joins the “Rate Cut” Party
Income Mail by Bryan Perry
What the Massive Job Revisions Reveal
Growth Mail by Gary Alexander
Deciphering Our Deceptive Jobs Data over Labor Day Weekend
Global Mail by Ivan Martchev
The “Nvidia Danger” is They Sell the Good News
Sector Spotlight by Jason Bodner
Is It Market Blast-off Time Yet?
View Full Archive
Read Past Issues Here

Jason Bodner
MARKETMAIL EDITOR FOR SECTOR SPOTLIGHT
Jason Bodner writes Sector Spotlight in the weekly Marketmail publication and has authored several white papers for the company. He is also Co-Founder of Macro Analytics for Professionals which produces proprietary equity accumulation and distribution research for its clients. Previously, Mr. Bodner served as Director of European Equity Derivatives for Cantor Fitzgerald Europe in London, then moved to the role of Head of Equity Derivatives North America for the same company in New York. He also served as S.V.P. Equity Derivatives for Jefferies, LLC. He received a B.S. in business administration in 1996, with honors, from Skidmore College as a member of the Periclean Honors Society. All content of “Sector Spotlight” represents the opinion of Jason Bodner
Important Disclosures:
Jason Bodner is a co-founder and co-owner of Mapsignals. Mr. Bodner is an independent contractor who is occasionally hired by Navellier & Associates to write an article and or provide opinions for possible use in articles that appear in Navellier & Associates weekly Market Mail. Mr. Bodner is not employed or affiliated with Louis Navellier, Navellier & Associates, Inc., or any other Navellier owned entity. The opinions and statements made here are those of Mr. Bodner and not necessarily those of any other persons or entities. This is not an endorsement, or solicitation or testimonial or investment advice regarding the BMI Index or any statements or recommendations or analysis in the article or the BMI Index or Mapsignals or its products or strategies.
Although information in these reports has been obtained from and is based upon sources that Navellier believes to be reliable, Navellier does not guarantee its accuracy and it may be incomplete or condensed. All opinions and estimates constitute Navellier’s judgment as of the date the report was created and are subject to change without notice. These reports are for informational purposes only and are not a solicitation for the purchase or sale of a security. Any decision to purchase securities mentioned in these reports must take into account existing public information on such securities or any registered prospectus.To the extent permitted by law, neither Navellier & Associates, Inc., nor any of its affiliates, agents, or service providers assumes any liability or responsibility nor owes any duty of care for any consequences of any person acting or refraining to act in reliance on the information contained in this communication or for any decision based on it.
Past performance is no indication of future results. Investment in securities involves significant risk and has the potential for partial or complete loss of funds invested. It should not be assumed that any securities recommendations made by Navellier. in the future will be profitable or equal the performance of securities made in this report. Dividend payments are not guaranteed. The amount of a dividend payment, if any, can vary over time and issuers may reduce dividends paid on securities in the event of a recession or adverse event affecting a specific industry or issuer.
None of the stock information, data, and company information presented herein constitutes a recommendation by Navellier or a solicitation to buy or sell any securities. Any specific securities identified and described do not represent all of the securities purchased, sold, or recommended for advisory clients. The holdings identified do not represent all of the securities purchased, sold, or recommended for advisory clients and the reader should not assume that investments in the securities identified and discussed were or will be profitable.
Information presented is general information that does not take into account your individual circumstances, financial situation, or needs, nor does it present a personalized recommendation to you. Individual stocks presented may not be suitable for every investor. Investment in securities involves significant risk and has the potential for partial or complete loss of funds invested. Investment in fixed income securities has the potential for the investment return and principal value of an investment to fluctuate so that an investor’s holdings, when redeemed, may be worth less than their original cost.
One cannot invest directly in an index. Index is unmanaged and index performance does not reflect deduction of fees, expenses, or taxes. Presentation of Index data does not reflect a belief by Navellier that any stock index constitutes an investment alternative to any Navellier equity strategy or is necessarily comparable to such strategies. Among the most important differences between the Indices and Navellier strategies are that the Navellier equity strategies may (1) incur material management fees, (2) concentrate its investments in relatively few stocks, industries, or sectors, (3) have significantly greater trading activity and related costs, and (4) be significantly more or less volatile than the Indices.
ETF Risk: We may invest in exchange traded funds (“ETFs”) and some of our investment strategies are generally fully invested in ETFs. Like traditional mutual funds, ETFs charge asset-based fees, but they generally do not charge initial sales charges or redemption fees and investors typically pay only customary brokerage fees to buy and sell ETF shares. The fees and costs charged by ETFs held in client accounts will not be deducted from the compensation the client pays Navellier. ETF prices can fluctuate up or down, and a client account could lose money investing in an ETF if the prices of the securities owned by the ETF go down. ETFs are subject to additional risks:
- ETF shares may trade above or below their net asset value;
- An active trading market for an ETF’s shares may not develop or be maintained;
- The value of an ETF may be more volatile than the underlying portfolio of securities the ETF is designed to track;
- The cost of owning shares of the ETF may exceed those a client would incur by directly investing in the underlying securities and;
- Trading of an ETF’s shares may be halted if the listing exchange’s officials deem it appropriate, the shares are delisted from the exchange, or the activation of market-wide “circuit breakers” (which are tied to large decreases in stock prices) halts stock trading generally.
Grader Disclosures: Investment in equity strategies involves substantial risk and has the potential for partial or complete loss of funds invested. The sample portfolio and any accompanying charts are for informational purposes only and are not to be construed as a solicitation to buy or sell any financial instrument and should not be relied upon as the sole factor in an investment making decision. As a matter of normal and important disclosures to you, as a potential investor, please consider the following: The performance presented is not based on any actual securities trading, portfolio, or accounts, and the reported performance of the A, B, C, D, and F portfolios (collectively the “model portfolios”) should be considered mere “paper” or pro forma performance results based on Navellier’s research.
Investors evaluating any of Navellier & Associates, Inc.’s, (or its affiliates’) Investment Products must not use any information presented here, including the performance figures of the model portfolios, in their evaluation of any Navellier Investment Products. Navellier Investment Products include the firm’s mutual funds and managed accounts. The model portfolios, charts, and other information presented do not represent actual funded trades and are not actual funded portfolios. There are material differences between Navellier Investment Products’ portfolios and the model portfolios, research, and performance figures presented here. The model portfolios and the research results (1) may contain stocks or ETFs that are illiquid and difficult to trade; (2) may contain stock or ETF holdings materially different from actual funded Navellier Investment Product portfolios; (3) include the reinvestment of all dividends and other earnings, estimated trading costs, commissions, or management fees; and, (4) may not reflect prices obtained in an actual funded Navellier Investment Product portfolio. For these and other reasons, the reported performances of model portfolios do not reflect the performance results of Navellier’s actually funded and traded Investment Products. In most cases, Navellier’s Investment Products have materially lower performance results than the performances of the model portfolios presented.
This report contains statements that are, or may be considered to be, forward-looking statements. All statements that are not historical facts, including statements about our beliefs or expectations, are “forward-looking statements” within the meaning of The U.S. Private Securities Litigation Reform Act of 1995. These statements may be identified by such forward-looking terminology as “expect,” “estimate,” “plan,” “intend,” “believe,” “anticipate,” “may,” “will,” “should,” “could,” “continue,” “project,” or similar statements or variations of such terms. Our forward-looking statements are based on a series of expectations, assumptions, and projections, are not guarantees of future results or performance, and involve substantial risks and uncertainty as described in Form ADV Part 2A of our filing with the Securities and Exchange Commission (SEC), which is available at www.adviserinfo.sec.gov or by requesting a copy by emailing info@navellier.com. All of our forward-looking statements are as of the date of this report only. We can give no assurance that such expectations or forward-looking statements will prove to be correct. Actual results may differ materially. You are urged to carefully consider all such factors.
FEDERAL TAX ADVICE DISCLAIMER: As required by U.S. Treasury Regulations, you are informed that, to the extent this presentation includes any federal tax advice, the presentation is not written by Navellier to be used, and cannot be used, for the purpose of avoiding federal tax penalties. Navellier does not advise on any income tax requirements or issues. Use of any information presented by Navellier is for general information only and does not represent tax advice either express or implied. You are encouraged to seek professional tax advice for income tax questions and assistance.
IMPORTANT NEWSLETTER DISCLOSURE:The hypothetical performance results for investment newsletters that are authored or edited by Louis Navellier, including Louis Navellier’s Growth Investor, Louis Navellier’s Breakthrough Stocks, Louis Navellier’s Accelerated Profits, and Louis Navellier’s Platinum Club, are not based on any actual securities trading, portfolio, or accounts, and the newsletters’ reported hypothetical performances should be considered mere “paper” or proforma hypothetical performance results and are not actual performance of real world trades. Navellier & Associates, Inc. does not have any relation to or affiliation with the owner of these newsletters. There are material differences between Navellier Investment Products’ portfolios and the InvestorPlace Media, LLC newsletter portfolios authored by Louis Navellier. The InvestorPlace Media, LLC newsletters contain hypothetical performance that do not include transaction costs, advisory fees, or other fees a client might incur if actual investments and trades were being made by an investor. As a result, newsletter performance should not be used to evaluate Navellier Investment services which are separate and different from the newsletters. The owner of the newsletters is InvestorPlace Media, LLC and any questions concerning the newsletters, including any newsletter advertising or hypothetical Newsletter performance claims, (which are calculated solely by Investor Place Media and not Navellier) should be referred to InvestorPlace Media, LLC at (800) 718-8289.
Please note that Navellier & Associates and the Navellier Private Client Group are managed completely independent of the newsletters owned and published by InvestorPlace Media, LLC and written and edited by Louis Navellier, and investment performance of the newsletters should in no way be considered indicative of potential future investment performance for any Navellier & Associates separately managed account portfolio. Potential investors should consult with their financial advisor before investing in any Navellier Investment Product.
Navellier claims compliance with Global Investment Performance Standards (GIPS). To receive a complete list and descriptions of Navellier’s composites and/or a presentation that adheres to the GIPS standards, please contact Navellier or click here. It should not be assumed that any securities recommendations made by Navellier & Associates, Inc. in the future will be profitable or equal the performance of securities made in this report.
FactSet Disclosure: Navellier does not independently calculate the statistical information included in the attached report. The calculation and the information are provided by FactSet, a company not related to Navellier. Although information contained in the report has been obtained from FactSet and is based on sources Navellier believes to be reliable, Navellier does not guarantee its accuracy, and it may be incomplete or condensed. The report and the related FactSet sourced information are provided on an “as is” basis. The user assumes the entire risk of any use made of this information. Investors should consider the report as only a single factor in making their investment decision. The report is for informational purposes only and is not intended as an offer or solicitation for the purchase or sale of a security. FactSet sourced information is the exclusive property of FactSet. Without prior written permission of FactSet, this information may not be reproduced, disseminated or used to create any financial products. All indices are unmanaged and performance of the indices include reinvestment of dividends and interest income, unless otherwise noted, are not illustrative of any particular investment and an investment cannot be made in any index. Past performance is no guarantee of future results.