by Jason Bodner
August 13, 2024
We think that life is stable, but over the last 450 million years, there have been five mass extinctions:
- End Ordovician (444-million years ago)
- Late Devonian (360-million years ago)
- End Permian (250-million years ago)
- End Triassic (200-million years ago)
- End Cretaceous (65-million years ago) – the event that killed off the dinosaurs.
We expect life to continue, to be smooth and predictable, but life doesn’t always just “go on…and on.”
If this feels familiar, it’s probably because we just got rocked with market volatility. Last week was the most volatile week of the year. According to my research, August 1-8 it was the most volatile six trading sessions since November of 2022.
Despite that volatility, the S&P 500 closed Friday right where it closed on Friday, August 2nd. After losing 2.9% on Monday and gaining 2.3% Thursday, the S&P changed a total of 2.4 points (-0.05%) last week.
First, let’s look into the volatility, what it tells us about the future, and why we shouldn’t panic.
We’ll start by breaking down stock volatility since August began. I’ve told you that August and September are the most volatile months for stocks since 1990. This August so far hasn’t deviated from the norm. The good news is that the fourth quarter has been historically exceptional for stocks:
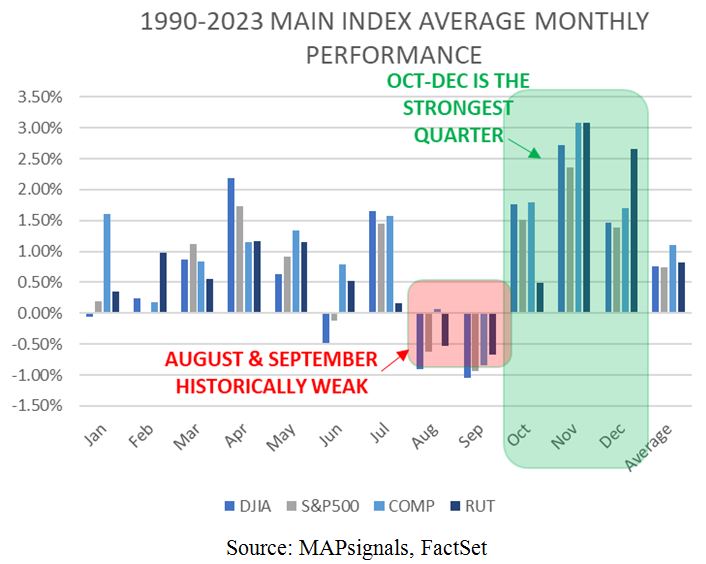
Graphs are for illustrative and discussion purposes only. Please read important disclosures at the end of this commentary.
Breaking down daily performances since August began, we see a wild ride.
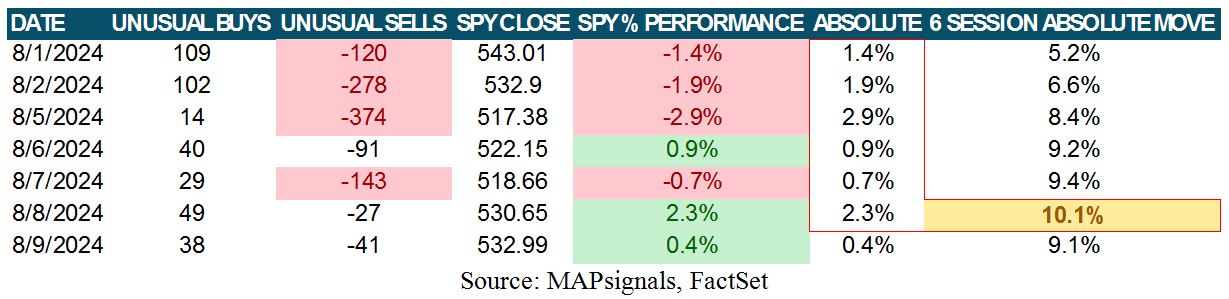
Graphs are for illustrative and discussion purposes only. Please read important disclosures at the end of this commentary.
What caught my eye, looking at the “absolute moves,” was the sum total of volatility. The six sessions from August 1-8 summed to 10.1%, averaging 1.7% per day. Given the S&P 500’s market capitalization of $44.6 trillion dollars, that means the index swung a total of about $4.5 trillion over 6 trading sessions.
We also see in the table above that unusual selling hit fever levels in a very short time, and the selling rocked small and mid-caps, which were July’s Angels, the hardest:
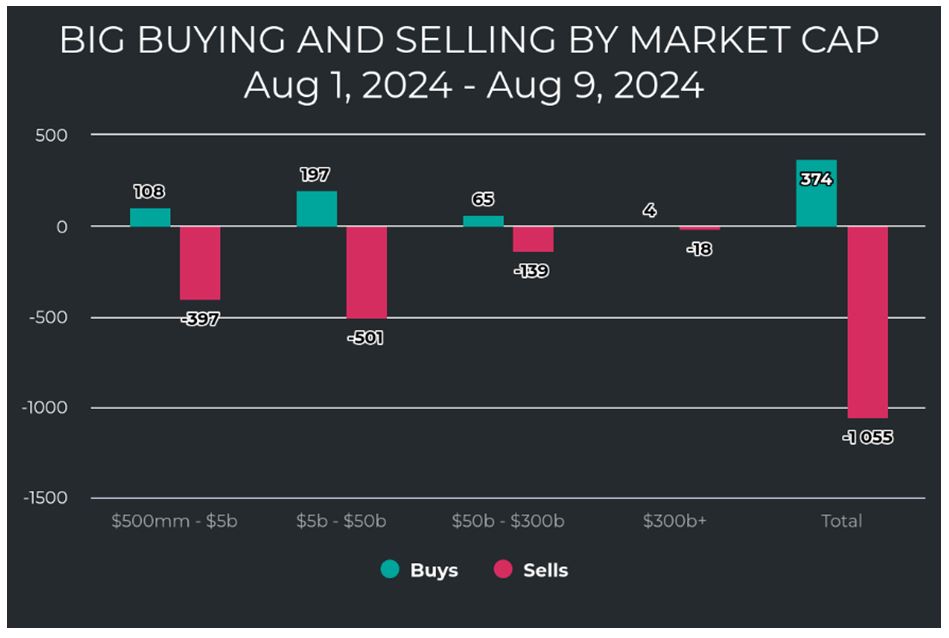
Graphs are for illustrative and discussion purposes only. Please read important disclosures at the end of this commentary.
We haven’t seen selling this intense since November 2022, when volatility was also this high.
I’ll elaborate on that combination in just a moment. But first, visually, I want you to see how all similar selling episodes in the last three years compare. The orange line in the chart below shows the last time selling eclipsed last week, namely November 2022. The yellow lines show similar huge selling episodes.
Notice how they all mark immediate market bottoms? Significant bounces always followed:
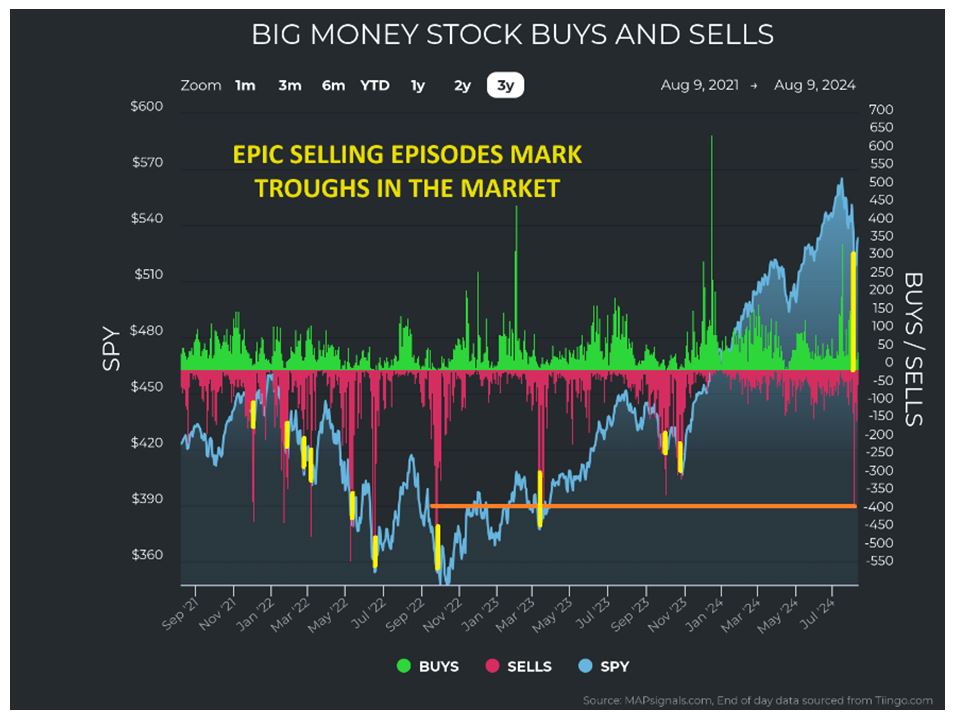
Graphs are for illustrative and discussion purposes only. Please read important disclosures at the end of this commentary.
I said I’d elaborate on this volatility. I went back to look at similar instances of volatility to last week. I looked for any other six-session periods of absolute moves 10% or greater. Here’s what I found:
There were 439 prior instances of 10% or greater absolute moves within six days of trading. Including August 1st-8th, the 440 instances (out of 8,690 trading days since January 1st, 1990) translate to about 5% of the time. That’s rare. In other words, markets aren’t this volatile 95% of the time.
So, what did history tell us about these volatile times and forward returns? It’s quite bullish.
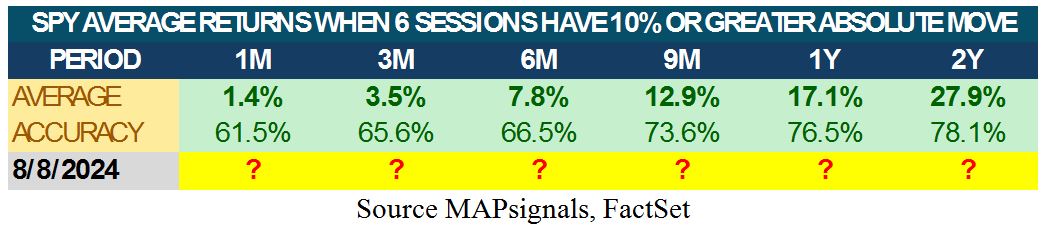
Graphs are for illustrative and discussion purposes only. Please read important disclosures at the end of this commentary.
Markets were higher 1, 3, 6, 9, 12, and 24 months later. And with high accuracy too: ranging from 61.5% of the time higher after one month to 78.1% of the time after two years. That’s the good news! The bad news is that history also says volatility is likely to continue from August through the November election.
Volatility is causing heavy rotation. The tables below compare sector shifts from July 1st to last Friday:
July 1st, 2024 August 9th, 2024
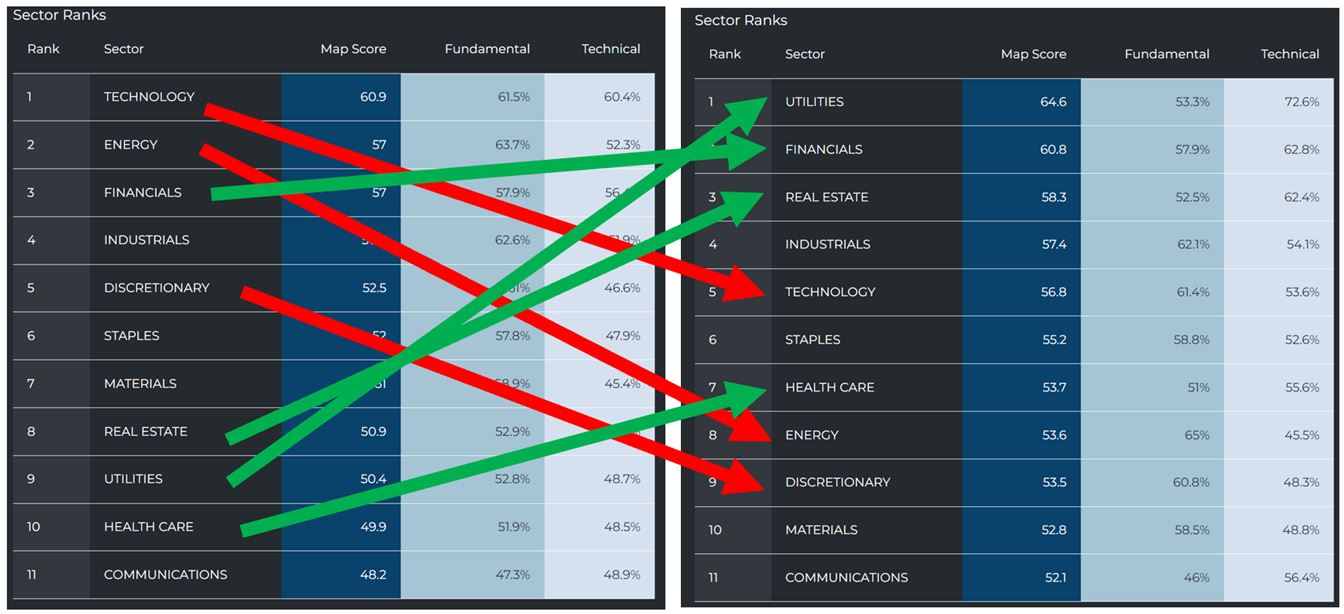
Graphs are for illustrative and discussion purposes only. Please read important disclosures at the end of this commentary.
Yes, it looks like an air-traffic-control grid. Utilities, Financials, Real Estate, and Health Care all made meaningful strides, while Technology, Energy, and Discretionary dropped.
Next, we look at unusually large buying and selling since July 1st… the pattern is clear:
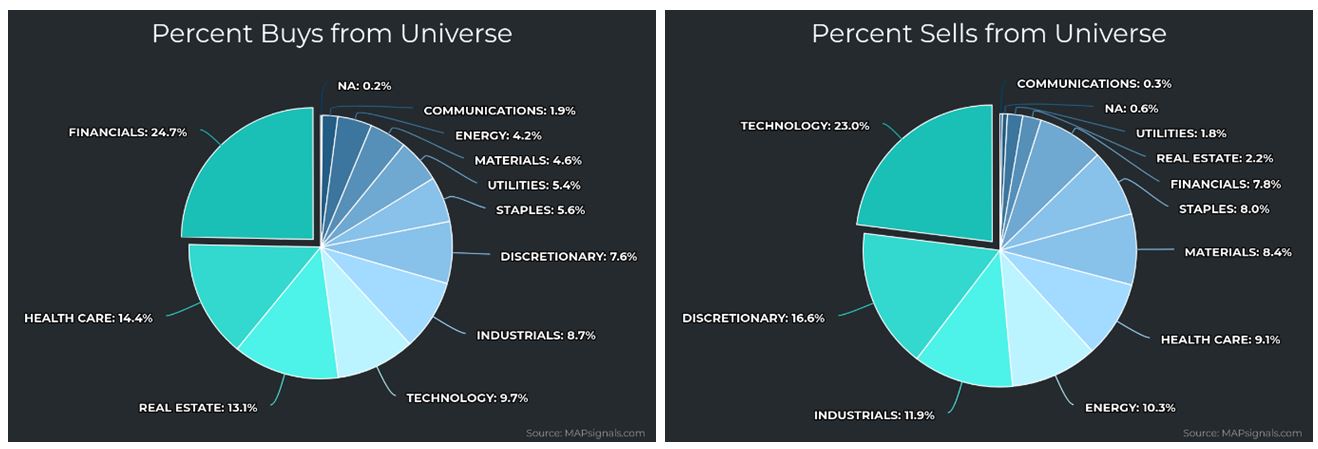
Graphs are for illustrative and discussion purposes only. Please read important disclosures at the end of this commentary.
It’s always interesting to visualize the rotation in terms of unusual buying and selling within each sector. Again, we see recent buying in Utilities, Financials, Real Estate, and Health Care, and we see selling in Technology, Energy, Industrials, and Discretionary. Yesterday’s leaders are today’s laggards:
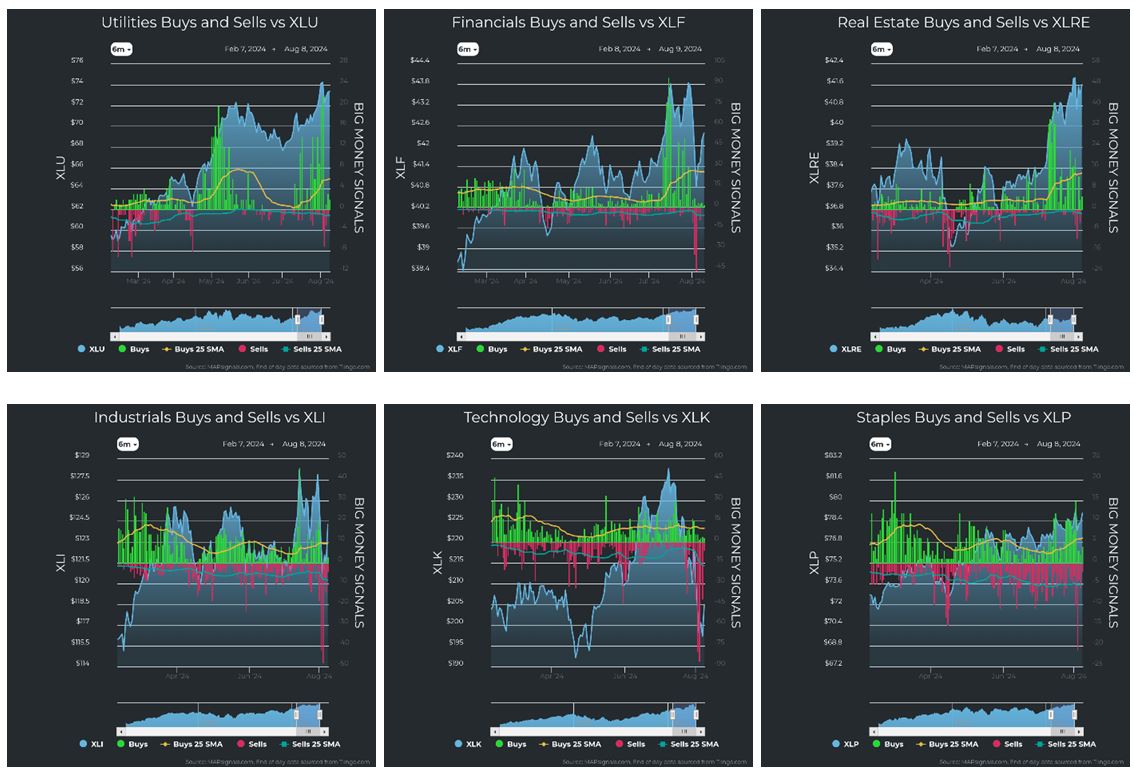
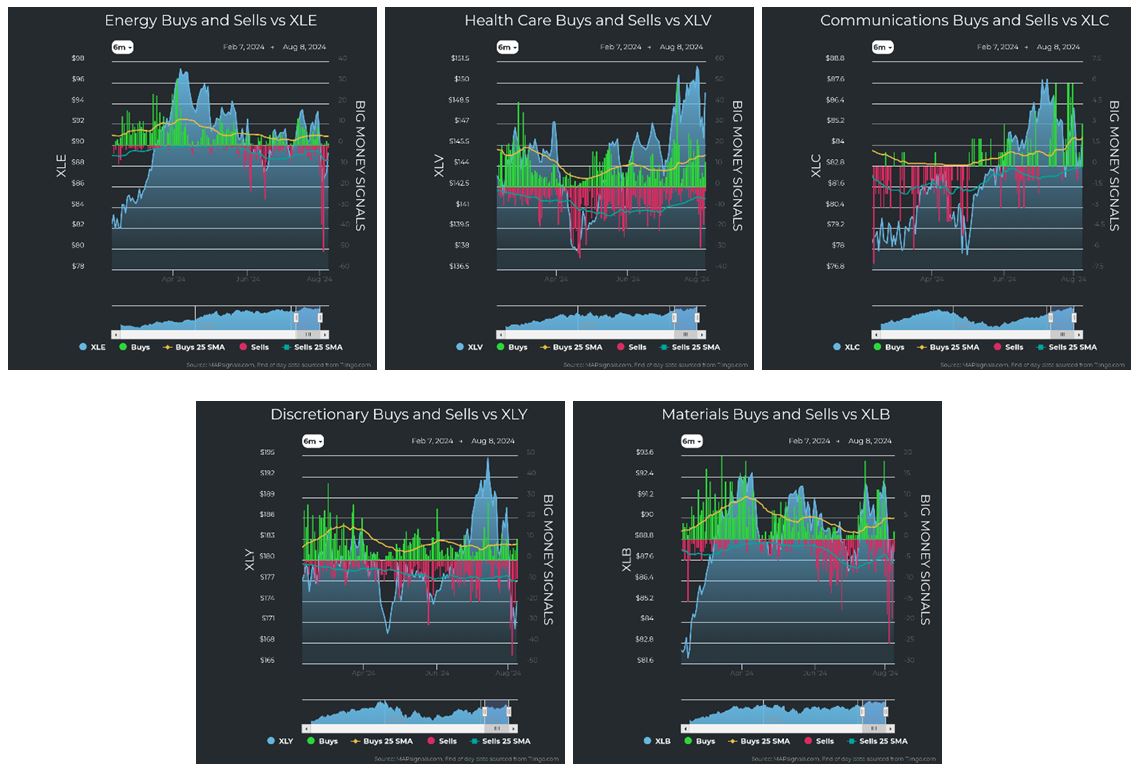
Graphs are for illustrative and discussion purposes only. Please read important disclosures at the end of this commentary.
But what is causing this volatility? As you may have heard me say, up to 90% of all daily trading volume is institutional, according to both JP Morgan and Morgan Stanley. Of that 90% of trading, a vast amount is quantatative-trading or algorithmic-trading. The machines are in control. And machines love it when liquidity dries up because that means the machines, all by themselves, can amp-up volatility.
Here’s one of many scenarios that algorithmic firms exploit: Daily options (those that expire at the end of the day) are the algorithmic trader’s favorite toys. When liquidity thins out, like in August, price movements can become exaggerated. Due to uncertainty (volatility) being part of an option’s premium calculation, when a stock or index tanks, the options premiums naturally inflate. An algorithmic-trader will then short the index, pushing down the price and spiking the volatility. They will then short the option with the inflated premium. Next, they buy back the index, which then makes the options premiums fall. All that’s left now is to cover the option short position. They make money on both ends: coming and going.
It’s like owning a printing press that prints money.
Algorithims also copy each other, which intensifies the phenomenon. Add in low liquidity and a lot of uncertainty and you get a powder keg. High-frequency-trading (HFT) firms can make all their annual money during events like these. Therefore, I forecast this will happen more. Easy money is hard to resist!
That means the ridiculousness of last week will happen again.
We perceive life as stable and predictable. Earth’s 4.5 billion years were actually quite volatile, but only for a small percentage of the time. Markets have their own wild volatility, and last week was an event that has happened only 5% of the time since 1990. The good news is that the future looks bright, so when volatility rears its ugly head remember what Marcus Aurelius said:
“You have power over your mind – not outside events. Realize this, and you will find strength.”
All content above represents the opinion of Jason Bodner of Navellier & Associates, Inc.
Also In This Issue
A Look Ahead by Louis Navellier
Look to Japan for the Cause of the Latest Volatility
Income Mail by Bryan Perry
A Rotation into Corporate Debt is Underway
Growth Mail by Gary Alexander
The Perma-Bears are Roaring Again
Global Mail by Ivan Martchev
A Dramatic Increase in Yen Correlations
Sector Spotlight by Jason Bodner
August is Market Extinction Month
View Full Archive
Read Past Issues Here

Jason Bodner
MARKETMAIL EDITOR FOR SECTOR SPOTLIGHT
Jason Bodner writes Sector Spotlight in the weekly Marketmail publication and has authored several white papers for the company. He is also Co-Founder of Macro Analytics for Professionals which produces proprietary equity accumulation/distribution research for its clients. Previously, Mr. Bodner served as Director of European Equity Derivatives for Cantor Fitzgerald Europe in London, then moved to the role of Head of Equity Derivatives North America for the same company in New York. He also served as S.V.P. Equity Derivatives for Jefferies, LLC. He received a B.S. in business administration in 1996, with honors, from Skidmore College as a member of the Periclean Honors Society. All content of “Sector Spotlight” represents the opinion of Jason Bodner
Important Disclosures:
Jason Bodner is a co-founder and co-owner of Mapsignals. Mr. Bodner is an independent contractor who is occasionally hired by Navellier & Associates to write an article and or provide opinions for possible use in articles that appear in Navellier & Associates weekly Market Mail. Mr. Bodner is not employed or affiliated with Louis Navellier, Navellier & Associates, Inc., or any other Navellier owned entity. The opinions and statements made here are those of Mr. Bodner and not necessarily those of any other persons or entities. This is not an endorsement, or solicitation or testimonial or investment advice regarding the BMI Index or any statements or recommendations or analysis in the article or the BMI Index or Mapsignals or its products or strategies.
Although information in these reports has been obtained from and is based upon sources that Navellier believes to be reliable, Navellier does not guarantee its accuracy and it may be incomplete or condensed. All opinions and estimates constitute Navellier’s judgment as of the date the report was created and are subject to change without notice. These reports are for informational purposes only and are not a solicitation for the purchase or sale of a security. Any decision to purchase securities mentioned in these reports must take into account existing public information on such securities or any registered prospectus.To the extent permitted by law, neither Navellier & Associates, Inc., nor any of its affiliates, agents, or service providers assumes any liability or responsibility nor owes any duty of care for any consequences of any person acting or refraining to act in reliance on the information contained in this communication or for any decision based on it.
Past performance is no indication of future results. Investment in securities involves significant risk and has the potential for partial or complete loss of funds invested. It should not be assumed that any securities recommendations made by Navellier. in the future will be profitable or equal the performance of securities made in this report. Dividend payments are not guaranteed. The amount of a dividend payment, if any, can vary over time and issuers may reduce dividends paid on securities in the event of a recession or adverse event affecting a specific industry or issuer.
None of the stock information, data, and company information presented herein constitutes a recommendation by Navellier or a solicitation to buy or sell any securities. Any specific securities identified and described do not represent all of the securities purchased, sold, or recommended for advisory clients. The holdings identified do not represent all of the securities purchased, sold, or recommended for advisory clients and the reader should not assume that investments in the securities identified and discussed were or will be profitable.
Information presented is general information that does not take into account your individual circumstances, financial situation, or needs, nor does it present a personalized recommendation to you. Individual stocks presented may not be suitable for every investor. Investment in securities involves significant risk and has the potential for partial or complete loss of funds invested. Investment in fixed income securities has the potential for the investment return and principal value of an investment to fluctuate so that an investor’s holdings, when redeemed, may be worth less than their original cost.
One cannot invest directly in an index. Index is unmanaged and index performance does not reflect deduction of fees, expenses, or taxes. Presentation of Index data does not reflect a belief by Navellier that any stock index constitutes an investment alternative to any Navellier equity strategy or is necessarily comparable to such strategies. Among the most important differences between the Indices and Navellier strategies are that the Navellier equity strategies may (1) incur material management fees, (2) concentrate its investments in relatively few stocks, industries, or sectors, (3) have significantly greater trading activity and related costs, and (4) be significantly more or less volatile than the Indices.
ETF Risk: We may invest in exchange traded funds (“ETFs”) and some of our investment strategies are generally fully invested in ETFs. Like traditional mutual funds, ETFs charge asset-based fees, but they generally do not charge initial sales charges or redemption fees and investors typically pay only customary brokerage fees to buy and sell ETF shares. The fees and costs charged by ETFs held in client accounts will not be deducted from the compensation the client pays Navellier. ETF prices can fluctuate up or down, and a client account could lose money investing in an ETF if the prices of the securities owned by the ETF go down. ETFs are subject to additional risks:
- ETF shares may trade above or below their net asset value;
- An active trading market for an ETF’s shares may not develop or be maintained;
- The value of an ETF may be more volatile than the underlying portfolio of securities the ETF is designed to track;
- The cost of owning shares of the ETF may exceed those a client would incur by directly investing in the underlying securities; and
- Trading of an ETF’s shares may be halted if the listing exchange’s officials deem it appropriate, the shares are delisted from the exchange, or the activation of market-wide “circuit breakers” (which are tied to large decreases in stock prices) halts stock trading generally.
Grader Disclosures: Investment in equity strategies involves substantial risk and has the potential for partial or complete loss of funds invested. The sample portfolio and any accompanying charts are for informational purposes only and are not to be construed as a solicitation to buy or sell any financial instrument and should not be relied upon as the sole factor in an investment making decision. As a matter of normal and important disclosures to you, as a potential investor, please consider the following: The performance presented is not based on any actual securities trading, portfolio, or accounts, and the reported performance of the A, B, C, D, and F portfolios (collectively the “model portfolios”) should be considered mere “paper” or pro forma performance results based on Navellier’s research.
Investors evaluating any of Navellier & Associates, Inc.’s, (or its affiliates’) Investment Products must not use any information presented here, including the performance figures of the model portfolios, in their evaluation of any Navellier Investment Products. Navellier Investment Products include the firm’s mutual funds and managed accounts. The model portfolios, charts, and other information presented do not represent actual funded trades and are not actual funded portfolios. There are material differences between Navellier Investment Products’ portfolios and the model portfolios, research, and performance figures presented here. The model portfolios and the research results (1) may contain stocks or ETFs that are illiquid and difficult to trade; (2) may contain stock or ETF holdings materially different from actual funded Navellier Investment Product portfolios; (3) include the reinvestment of all dividends and other earnings, estimated trading costs, commissions, or management fees; and, (4) may not reflect prices obtained in an actual funded Navellier Investment Product portfolio. For these and other reasons, the reported performances of model portfolios do not reflect the performance results of Navellier’s actually funded and traded Investment Products. In most cases, Navellier’s Investment Products have materially lower performance results than the performances of the model portfolios presented.
This report contains statements that are, or may be considered to be, forward-looking statements. All statements that are not historical facts, including statements about our beliefs or expectations, are “forward-looking statements” within the meaning of The U.S. Private Securities Litigation Reform Act of 1995. These statements may be identified by such forward-looking terminology as “expect,” “estimate,” “plan,” “intend,” “believe,” “anticipate,” “may,” “will,” “should,” “could,” “continue,” “project,” or similar statements or variations of such terms. Our forward-looking statements are based on a series of expectations, assumptions, and projections, are not guarantees of future results or performance, and involve substantial risks and uncertainty as described in Form ADV Part 2A of our filing with the Securities and Exchange Commission (SEC), which is available at www.adviserinfo.sec.gov or by requesting a copy by emailing info@navellier.com. All of our forward-looking statements are as of the date of this report only. We can give no assurance that such expectations or forward-looking statements will prove to be correct. Actual results may differ materially. You are urged to carefully consider all such factors.
FEDERAL TAX ADVICE DISCLAIMER: As required by U.S. Treasury Regulations, you are informed that, to the extent this presentation includes any federal tax advice, the presentation is not written by Navellier to be used, and cannot be used, for the purpose of avoiding federal tax penalties. Navellier does not advise on any income tax requirements or issues. Use of any information presented by Navellier is for general information only and does not represent tax advice either express or implied. You are encouraged to seek professional tax advice for income tax questions and assistance.
IMPORTANT NEWSLETTER DISCLOSURE:The hypothetical performance results for investment newsletters that are authored or edited by Louis Navellier, including Louis Navellier’s Growth Investor, Louis Navellier’s Breakthrough Stocks, Louis Navellier’s Accelerated Profits, and Louis Navellier’s Platinum Club, are not based on any actual securities trading, portfolio, or accounts, and the newsletters’ reported hypothetical performances should be considered mere “paper” or proforma hypothetical performance results and are not actual performance of real world trades. Navellier & Associates, Inc. does not have any relation to or affiliation with the owner of these newsletters. There are material differences between Navellier Investment Products’ portfolios and the InvestorPlace Media, LLC newsletter portfolios authored by Louis Navellier. The InvestorPlace Media, LLC newsletters contain hypothetical performance that do not include transaction costs, advisory fees, or other fees a client might incur if actual investments and trades were being made by an investor. As a result, newsletter performance should not be used to evaluate Navellier Investment services which are separate and different from the newsletters. The owner of the newsletters is InvestorPlace Media, LLC and any questions concerning the newsletters, including any newsletter advertising or hypothetical Newsletter performance claims, (which are calculated solely by Investor Place Media and not Navellier) should be referred to InvestorPlace Media, LLC at (800) 718-8289.
Please note that Navellier & Associates and the Navellier Private Client Group are managed completely independent of the newsletters owned and published by InvestorPlace Media, LLC and written and edited by Louis Navellier, and investment performance of the newsletters should in no way be considered indicative of potential future investment performance for any Navellier & Associates separately managed account portfolio. Potential investors should consult with their financial advisor before investing in any Navellier Investment Product.
Navellier claims compliance with Global Investment Performance Standards (GIPS). To receive a complete list and descriptions of Navellier’s composites and/or a presentation that adheres to the GIPS standards, please contact Navellier or click here. It should not be assumed that any securities recommendations made by Navellier & Associates, Inc. in the future will be profitable or equal the performance of securities made in this report.
FactSet Disclosure: Navellier does not independently calculate the statistical information included in the attached report. The calculation and the information are provided by FactSet, a company not related to Navellier. Although information contained in the report has been obtained from FactSet and is based on sources Navellier believes to be reliable, Navellier does not guarantee its accuracy, and it may be incomplete or condensed. The report and the related FactSet sourced information are provided on an “as is” basis. The user assumes the entire risk of any use made of this information. Investors should consider the report as only a single factor in making their investment decision. The report is for informational purposes only and is not intended as an offer or solicitation for the purchase or sale of a security. FactSet sourced information is the exclusive property of FactSet. Without prior written permission of FactSet, this information may not be reproduced, disseminated or used to create any financial products. All indices are unmanaged and performance of the indices include reinvestment of dividends and interest income, unless otherwise noted, are not illustrative of any particular investment and an investment cannot be made in any index. Past performance is no guarantee of future results.