by Jason Bodner
August 6, 2024
It’s August… the hottest month of the year, and the last full month of summer. That is, in the Northern hemisphere, as it is winter south of the equator. August has always been a volatile month, though. Back when the Roman calendar had only 10 months, August was the sixth month. Then, around 700 BC it was shoved back to the 8th month to make room for January and February.
The number of days in August shifted around, too. It started with 30 days, then 31, then 29 by order of Pompilius. Then Julius Caesar came along and gave August back its current 31 days.
This volatility of days in August seems fitting for a month filled with volatility. As I write, we are only two days into August and stocks are already whipping around wildly. This makes sense, as a wave of earnings reports, interest rate rhetoric, geopolitical agitation, and election battles heat up.
Before we investors lose our perspectives and our lunches, let’s visit our spirit guide: the data. The quick summary is this: We will all be fine. The summer is a historically volatile time, and election year summers are especially volatile as uncertainty puts additional pressure on the markets, but the fourth quarter historically brings much cheer and higher prices for stocks.
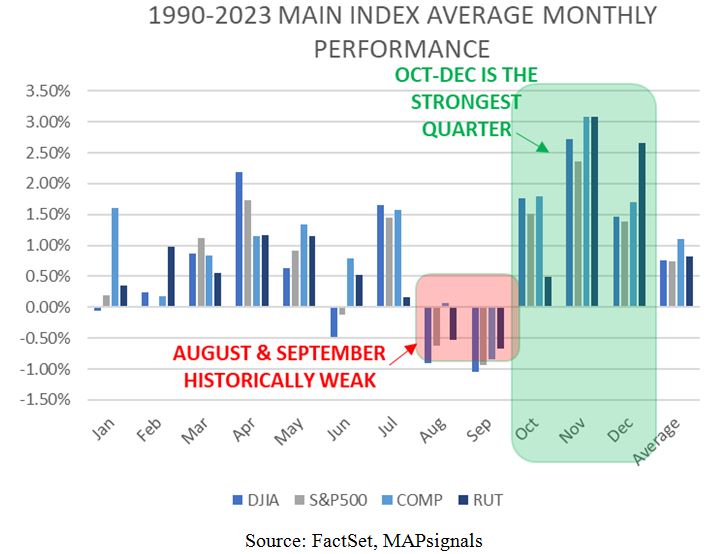
I’ll begin with 34 years of stock market data. Below, you’ll find the average monthly returns for the four major U.S. indexes. It’s clear that August and September are the weakest months of the year:
Graphs are for illustrative and discussion purposes only. Please read important disclosures at the end of this commentary.
It’s tempting to say that we should probably just close the stock market in late summer every year. It’s a time when liquidity thins out, volatility amps up and all sorts of market mischief happens. Wall Street trading desks also thin out as summer beach houses look more attractive than working.
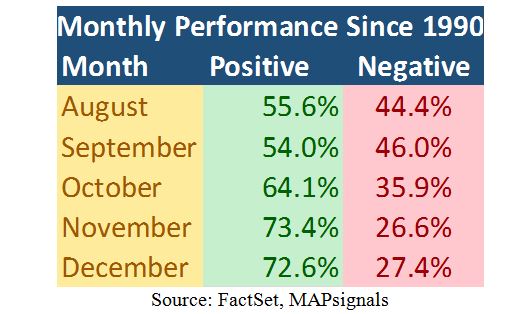
According to my data, August and September are positive most (about 55%) of the time. Since their average is negative, it’s obvious that their draw-downs are bigger than their gains, but when we look at November and December, we see an average of 73% positive performance in those months.
Graphs are for illustrative and discussion purposes only. Please read important disclosures at the end of this commentary.
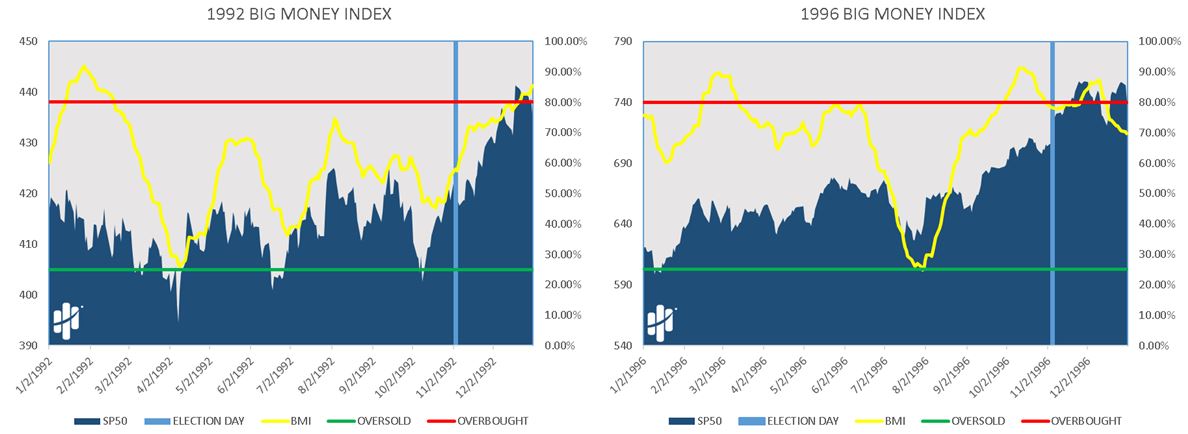
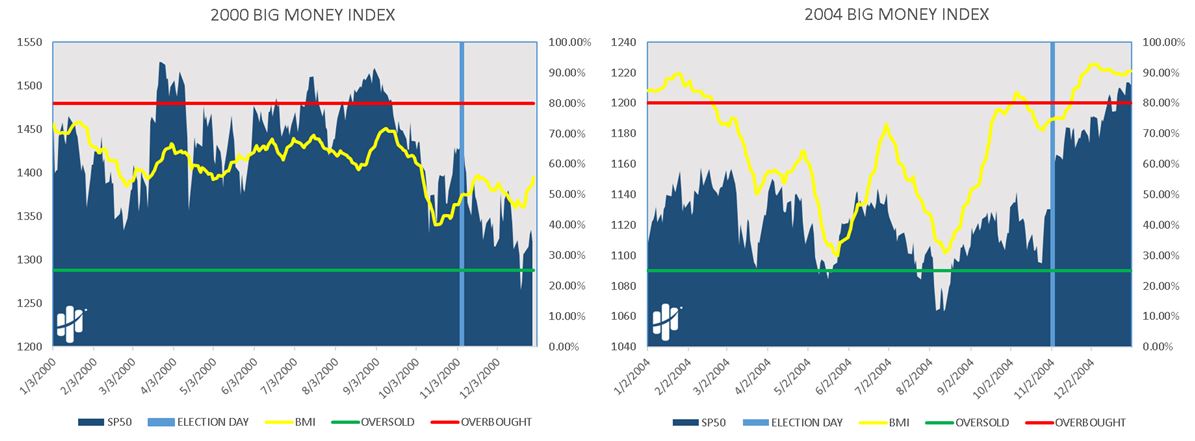
Well, that’s good but 2024 is also an election year. And there’s a repeating pattern we need to be aware of. Typically, as voting day draws near, volatility increases. Logically, Wall Street hates uncertainty, and if the polls are close, it’s safer to reduce risk until we know the winner. You’ll see in the BMI charts for the last eight election years, the yellow line dips prior to the election and rises after. This represents unusual money flows out of stocks before an election and into stocks after.
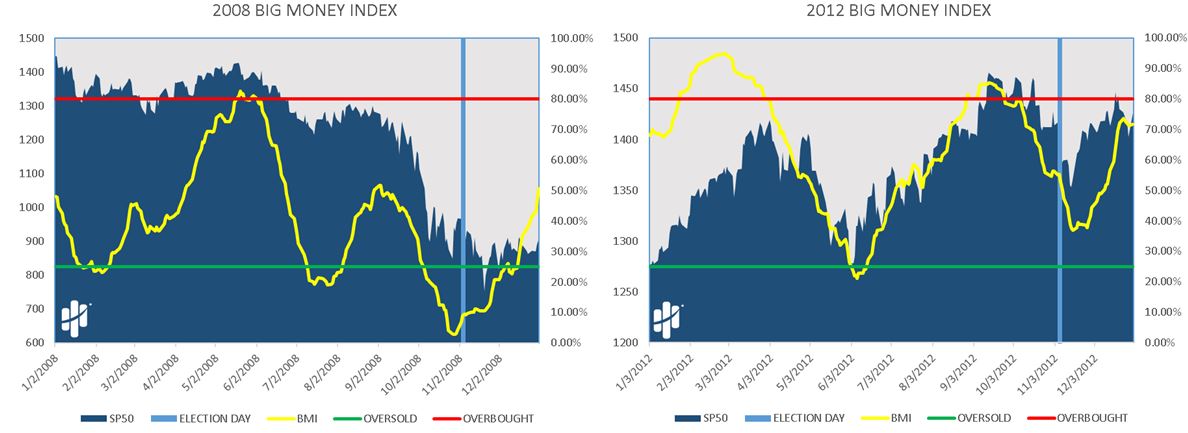
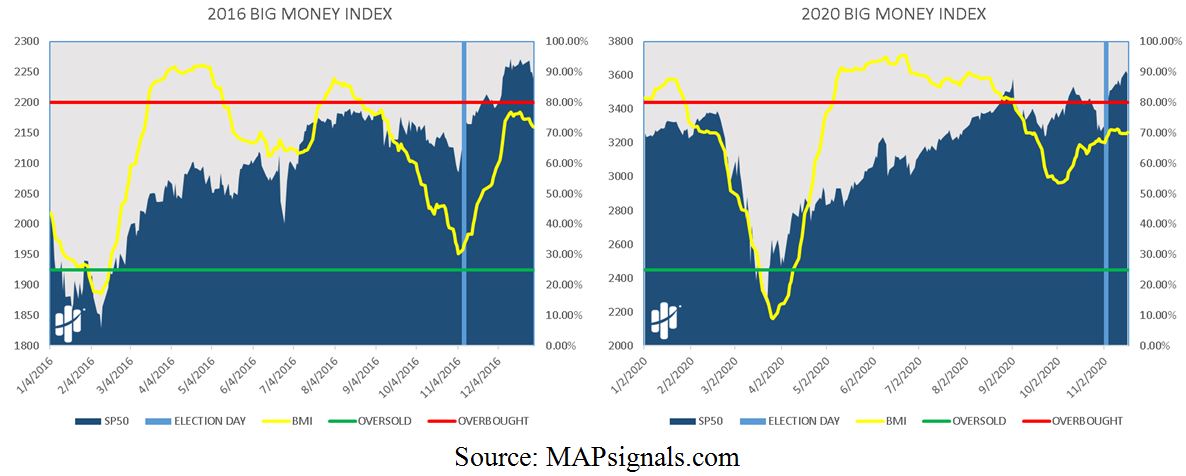
Graphs are for illustrative and discussion purposes only. Please read important disclosures at the end of this commentary.
After Trump was shot on July 13, Biden’s chances looked so grim that many said, “It’s over, Trump will win.” That was echoed in the Presidential betting odds, but since Harris threw her hat in the ring, the odds narrowed. The first chart shows the dispersion before Harris, the second after.
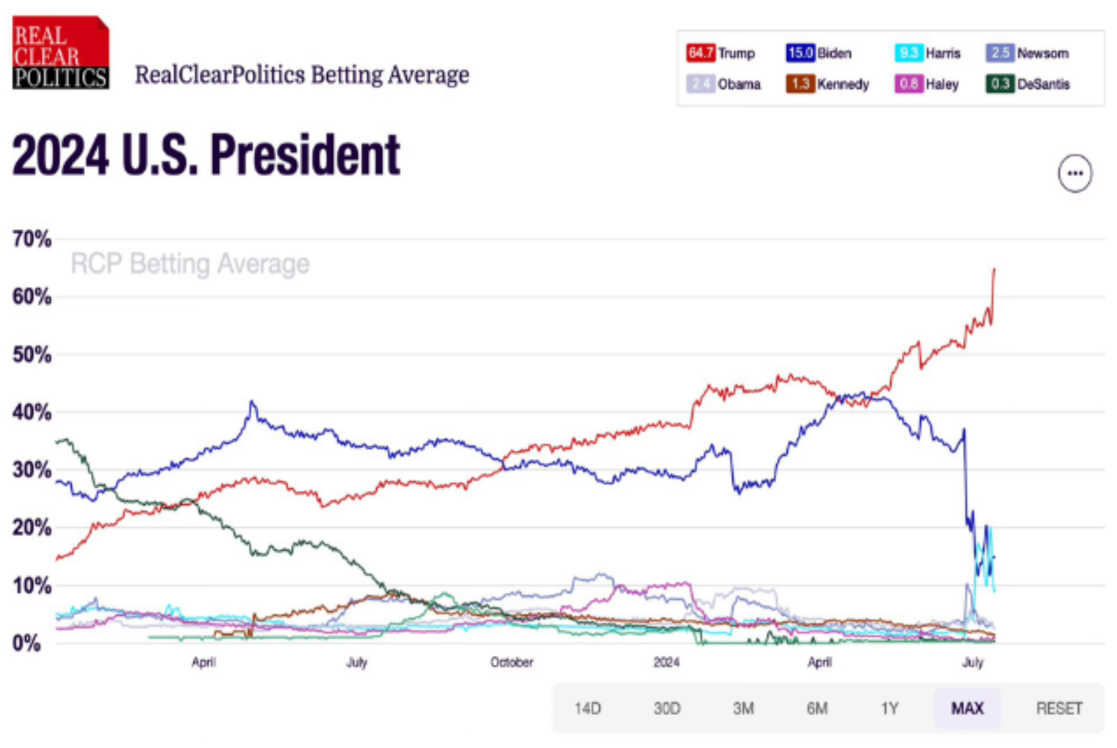
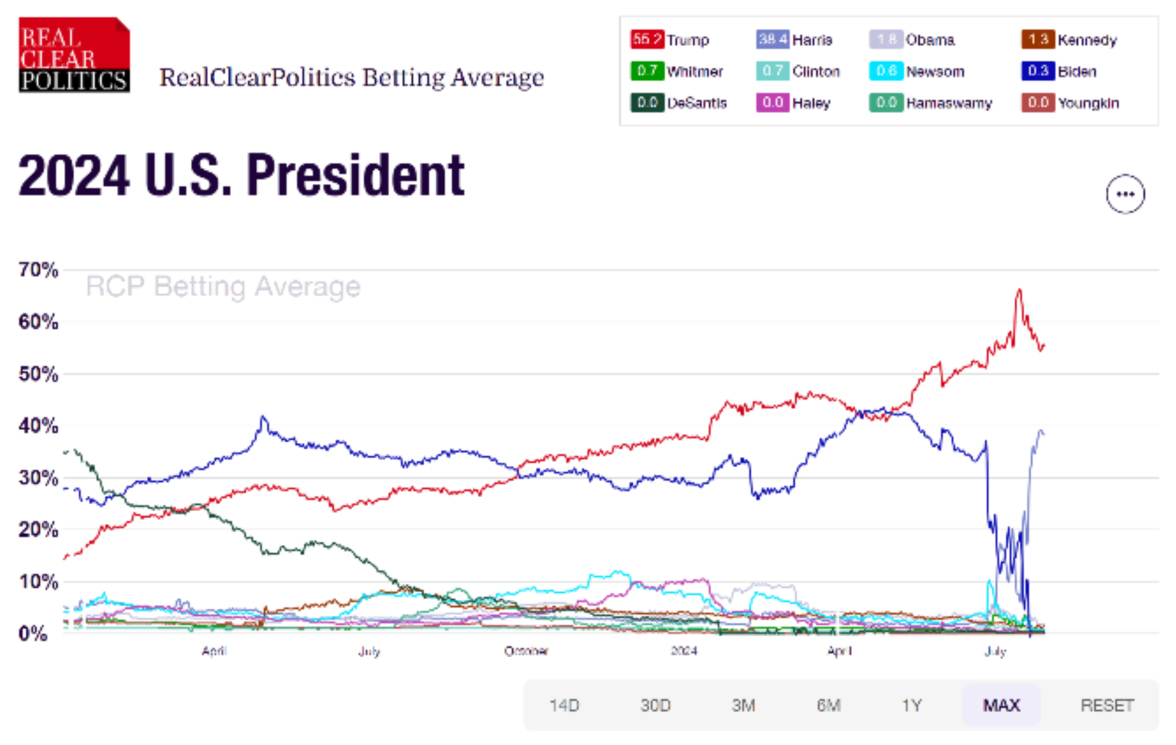
Graphs are for illustrative and discussion purposes only. Please read important disclosures at the end of this commentary.
The narrower the odds, the more volatility we’ll see….
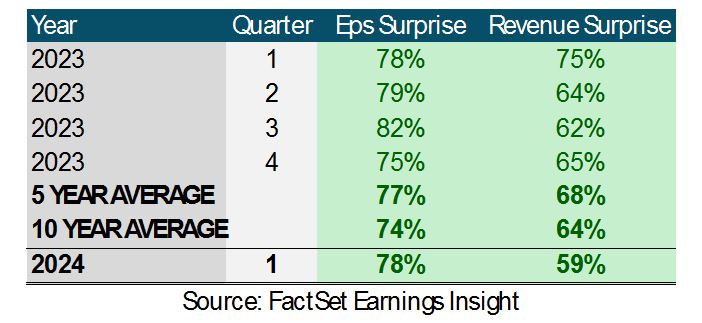
Now, let’s add the recent earnings volatility to the mix.
According to FactSet: Through last Friday, with 75% of S&P 500 companies reporting, 78% of those companies have reported positive earnings surprises, and their blended year-over-year growth rate is +11.5%, which (if this holds) will be the highest increase since Q4 of 2021.
This also fits history:
Graphs are for illustrative and discussion purposes only. Please read important disclosures at the end of this commentary.
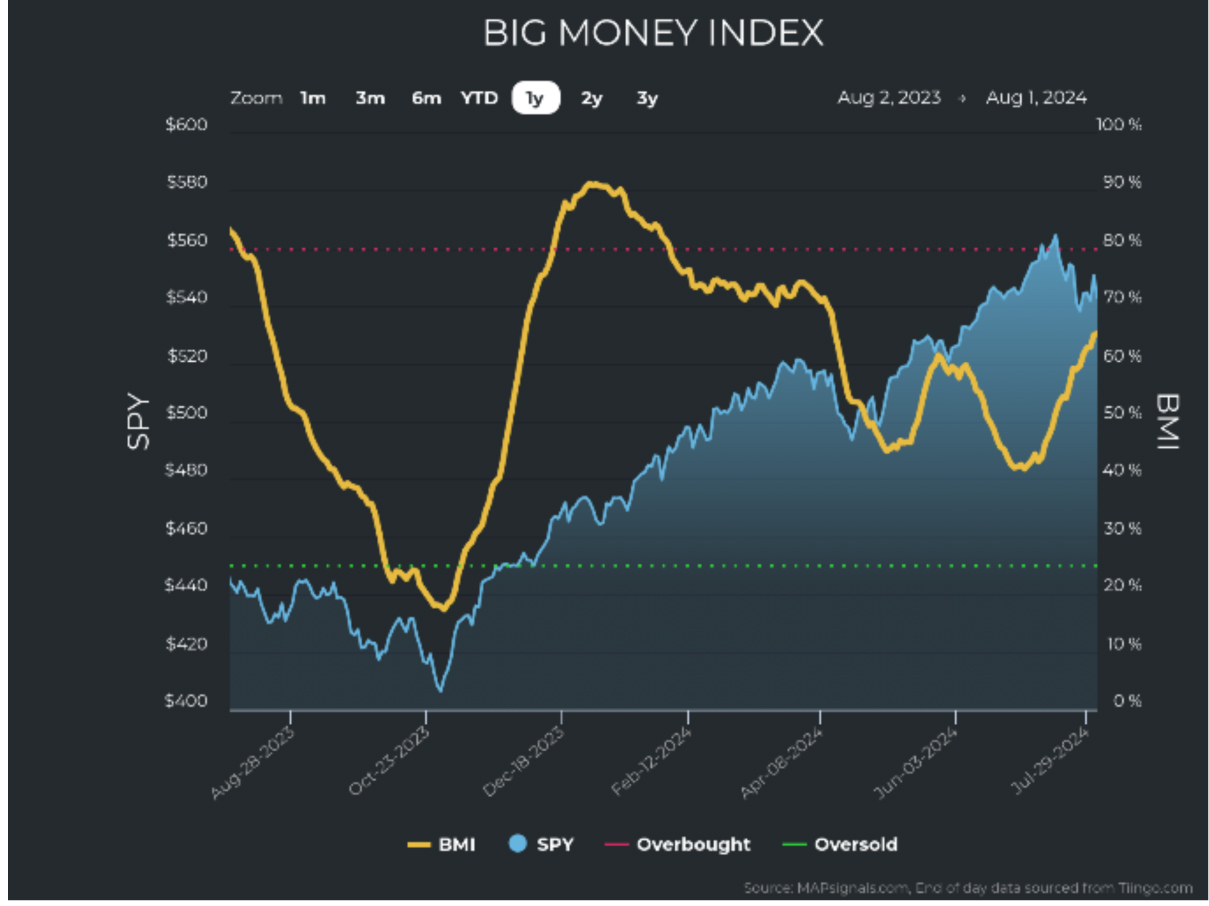
Normally, we would look at the Big Money Index (BMI) in relation to the S&P 500, but that masks the real story, which is that many mega-cap bellwethers are priced to perfection. If they slip up even slightly, they get “shot,” as seen by MAG-7 volatility at earnings time. This furthers the large-cap technology unwind and the rush into small caps that we have seen since mid-July.
We now see a modest pullback while money is rushing into stocks (amber line).
Graphs are for illustrative and discussion purposes only. Please read important disclosures at the end of this commentary.
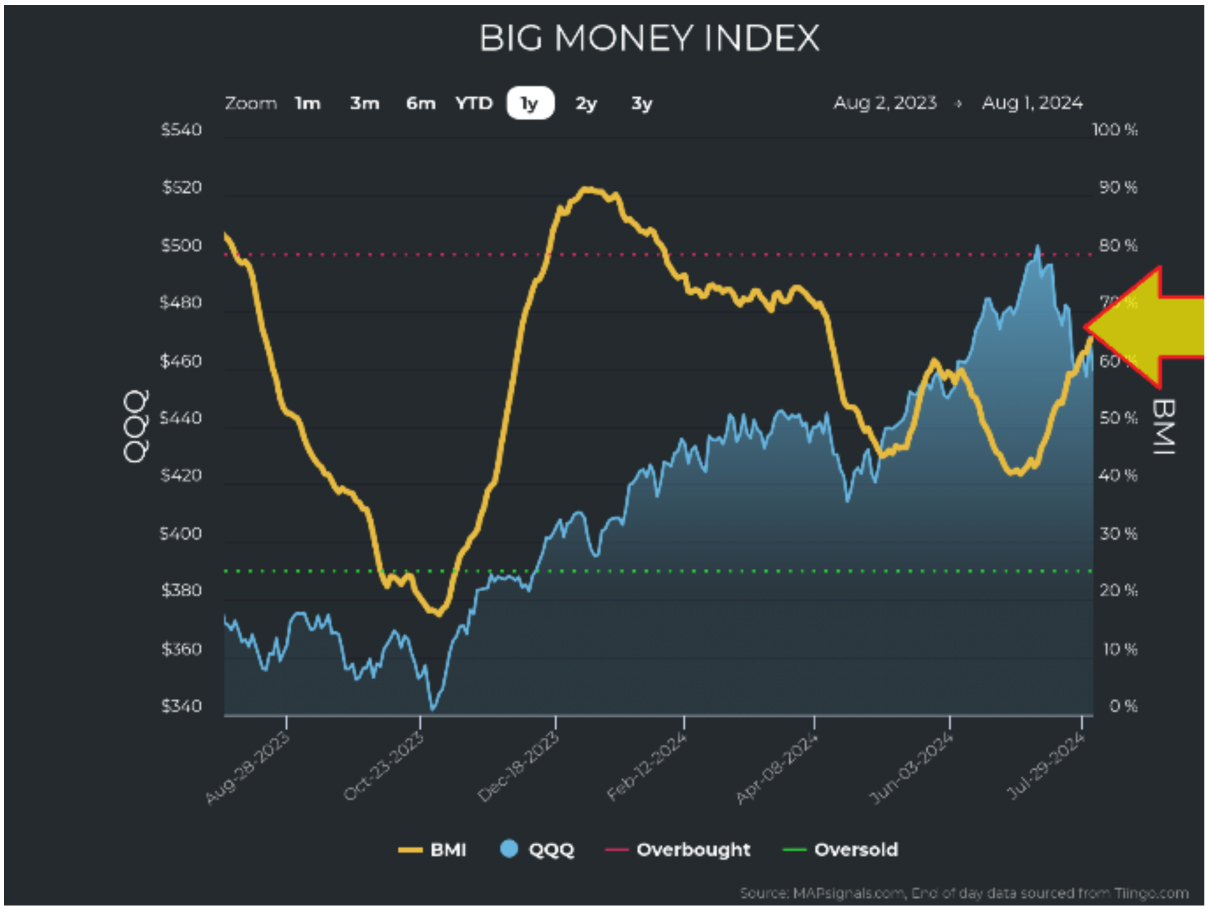
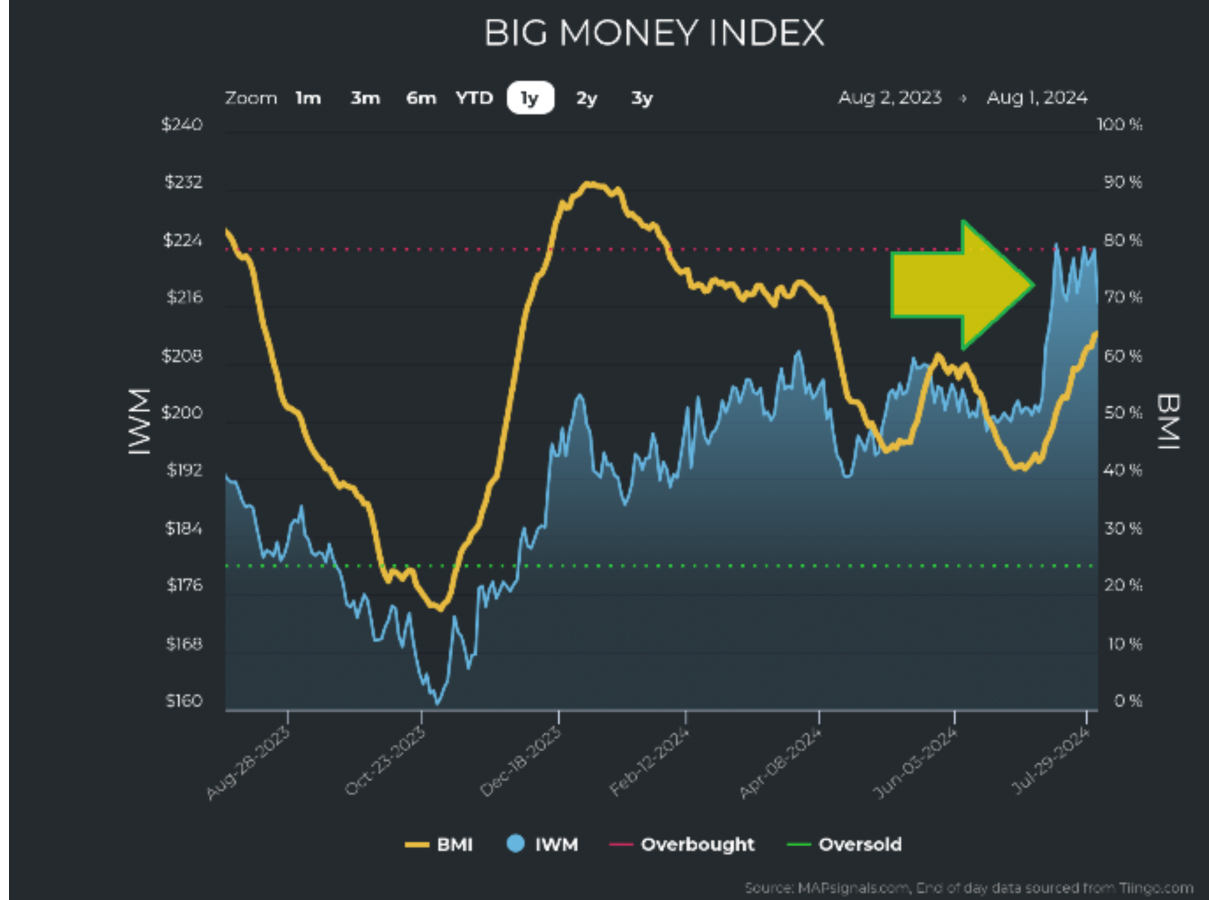
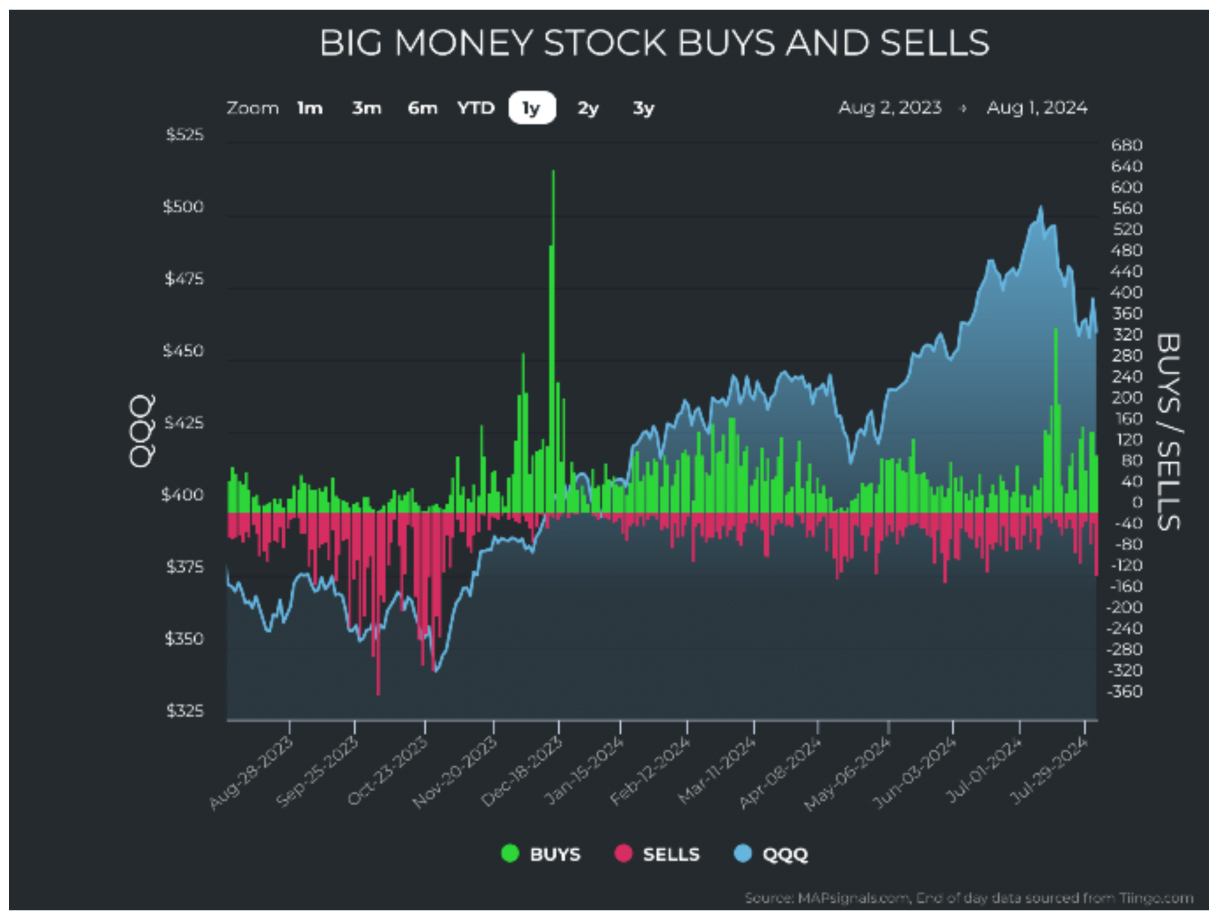
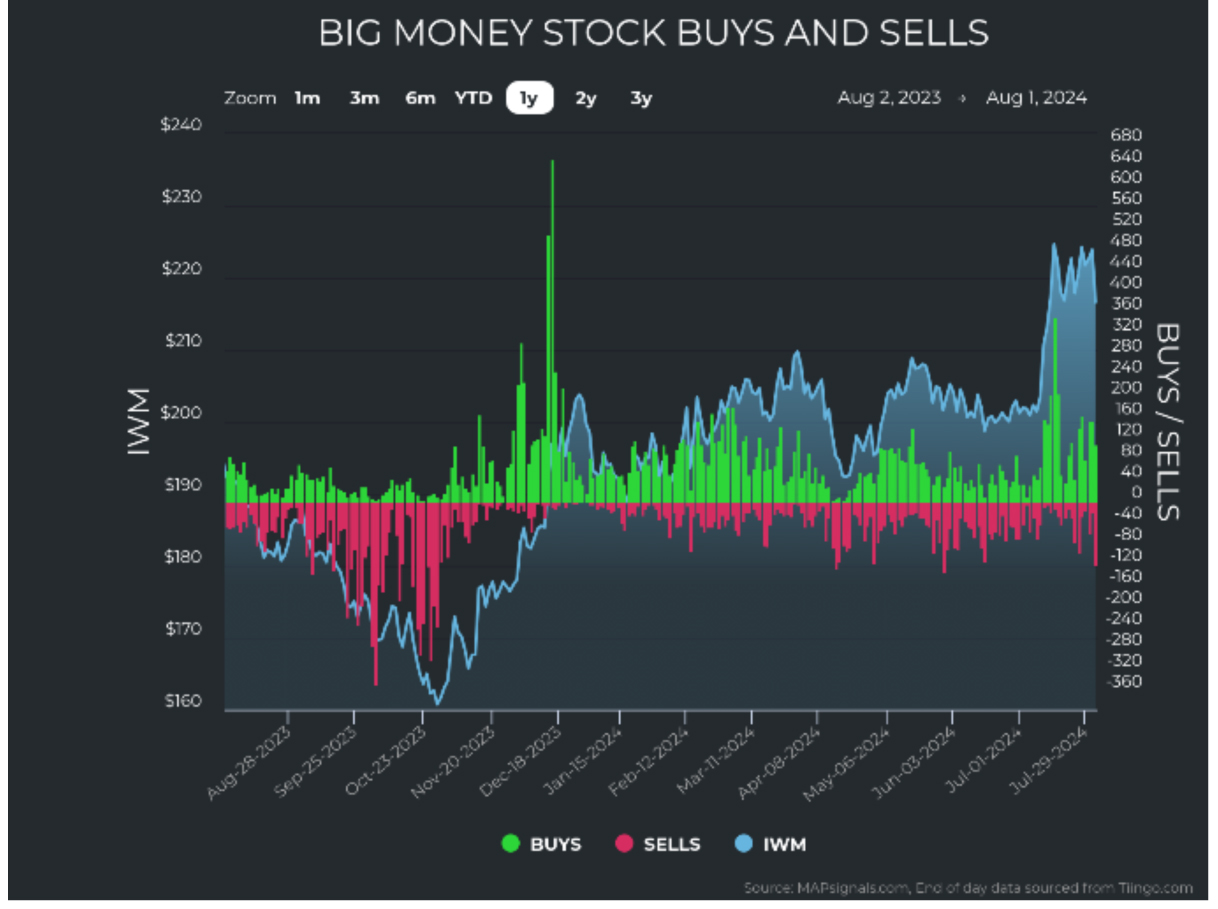
Now, look at the BMI against the large-cap-heavy QQQ (left) and small-cap-heavy IWM (right):
Graphs are for illustrative and discussion purposes only. Please read important disclosures at the end of this commentary.
Graphs are for illustrative and discussion purposes only. Please read important disclosures at the end of this commentary.
These two charts tell a totally different story than what the S&P 500 tells us. It becomes even clearer as you see the unusual buy and sell signals mapped against the index ETFs:
Graphs are for illustrative and discussion purposes only. Please read important disclosures at the end of this commentary.
Graphs are for illustrative and discussion purposes only. Please read important disclosures at the end of this commentary.
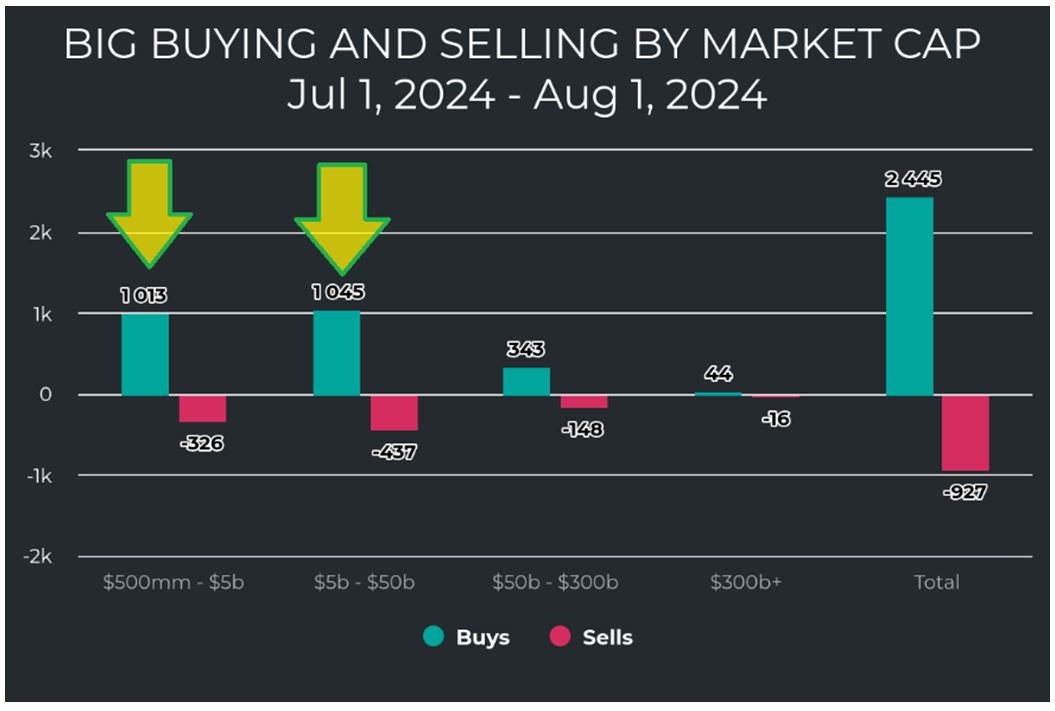
We can also see the massive inflows into small-cap and mid-cap stocks:
Graphs are for illustrative and discussion purposes only. Please read important disclosures at the end of this commentary.
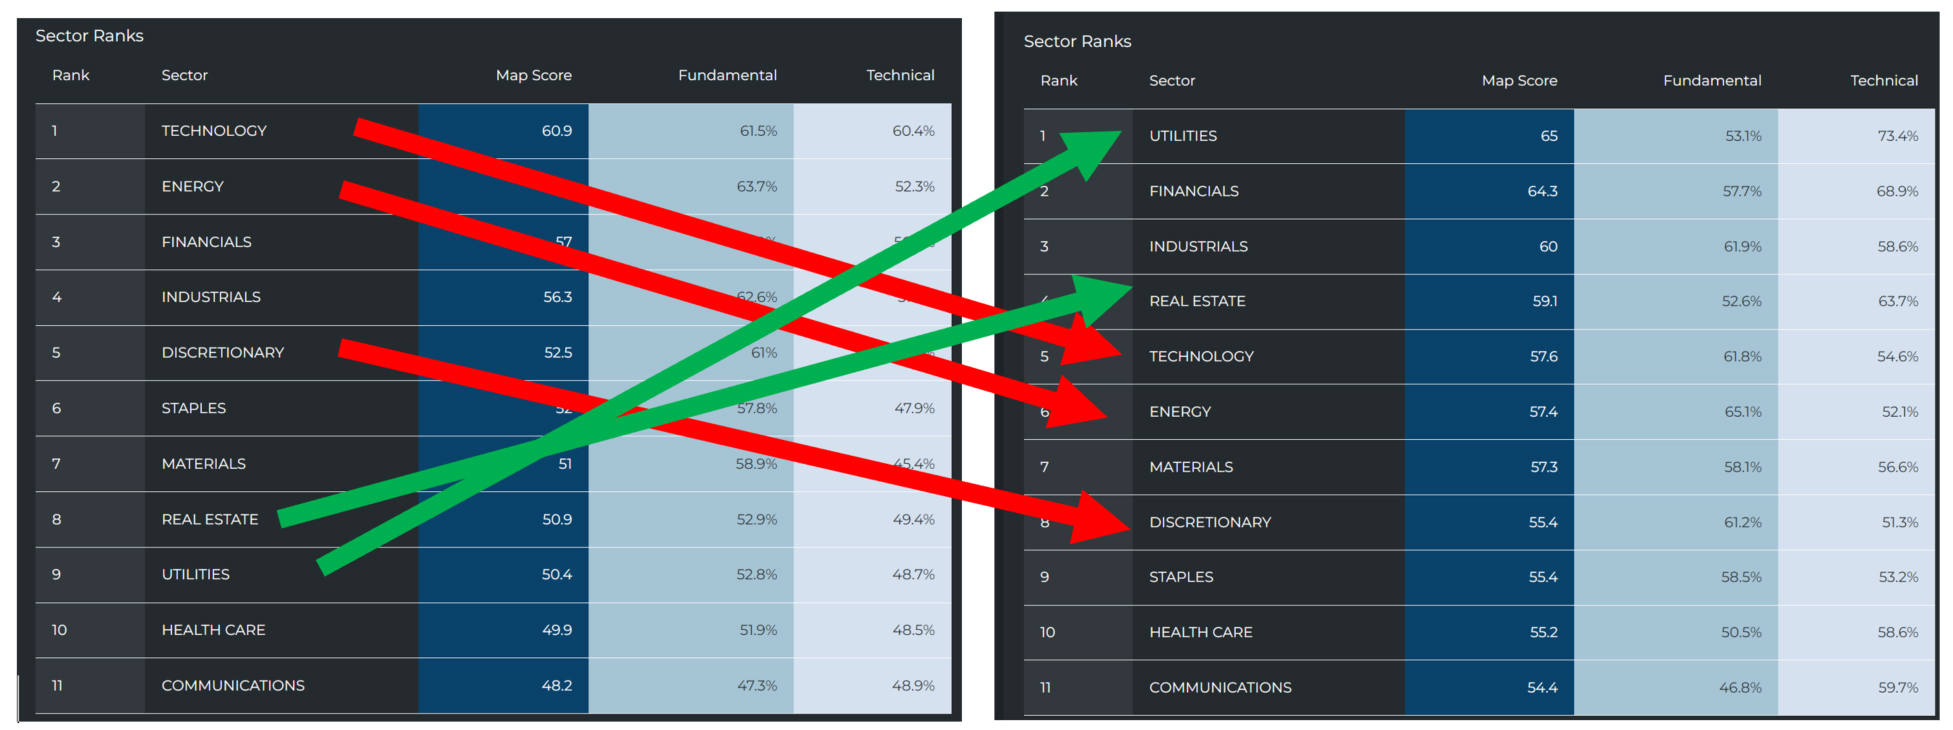
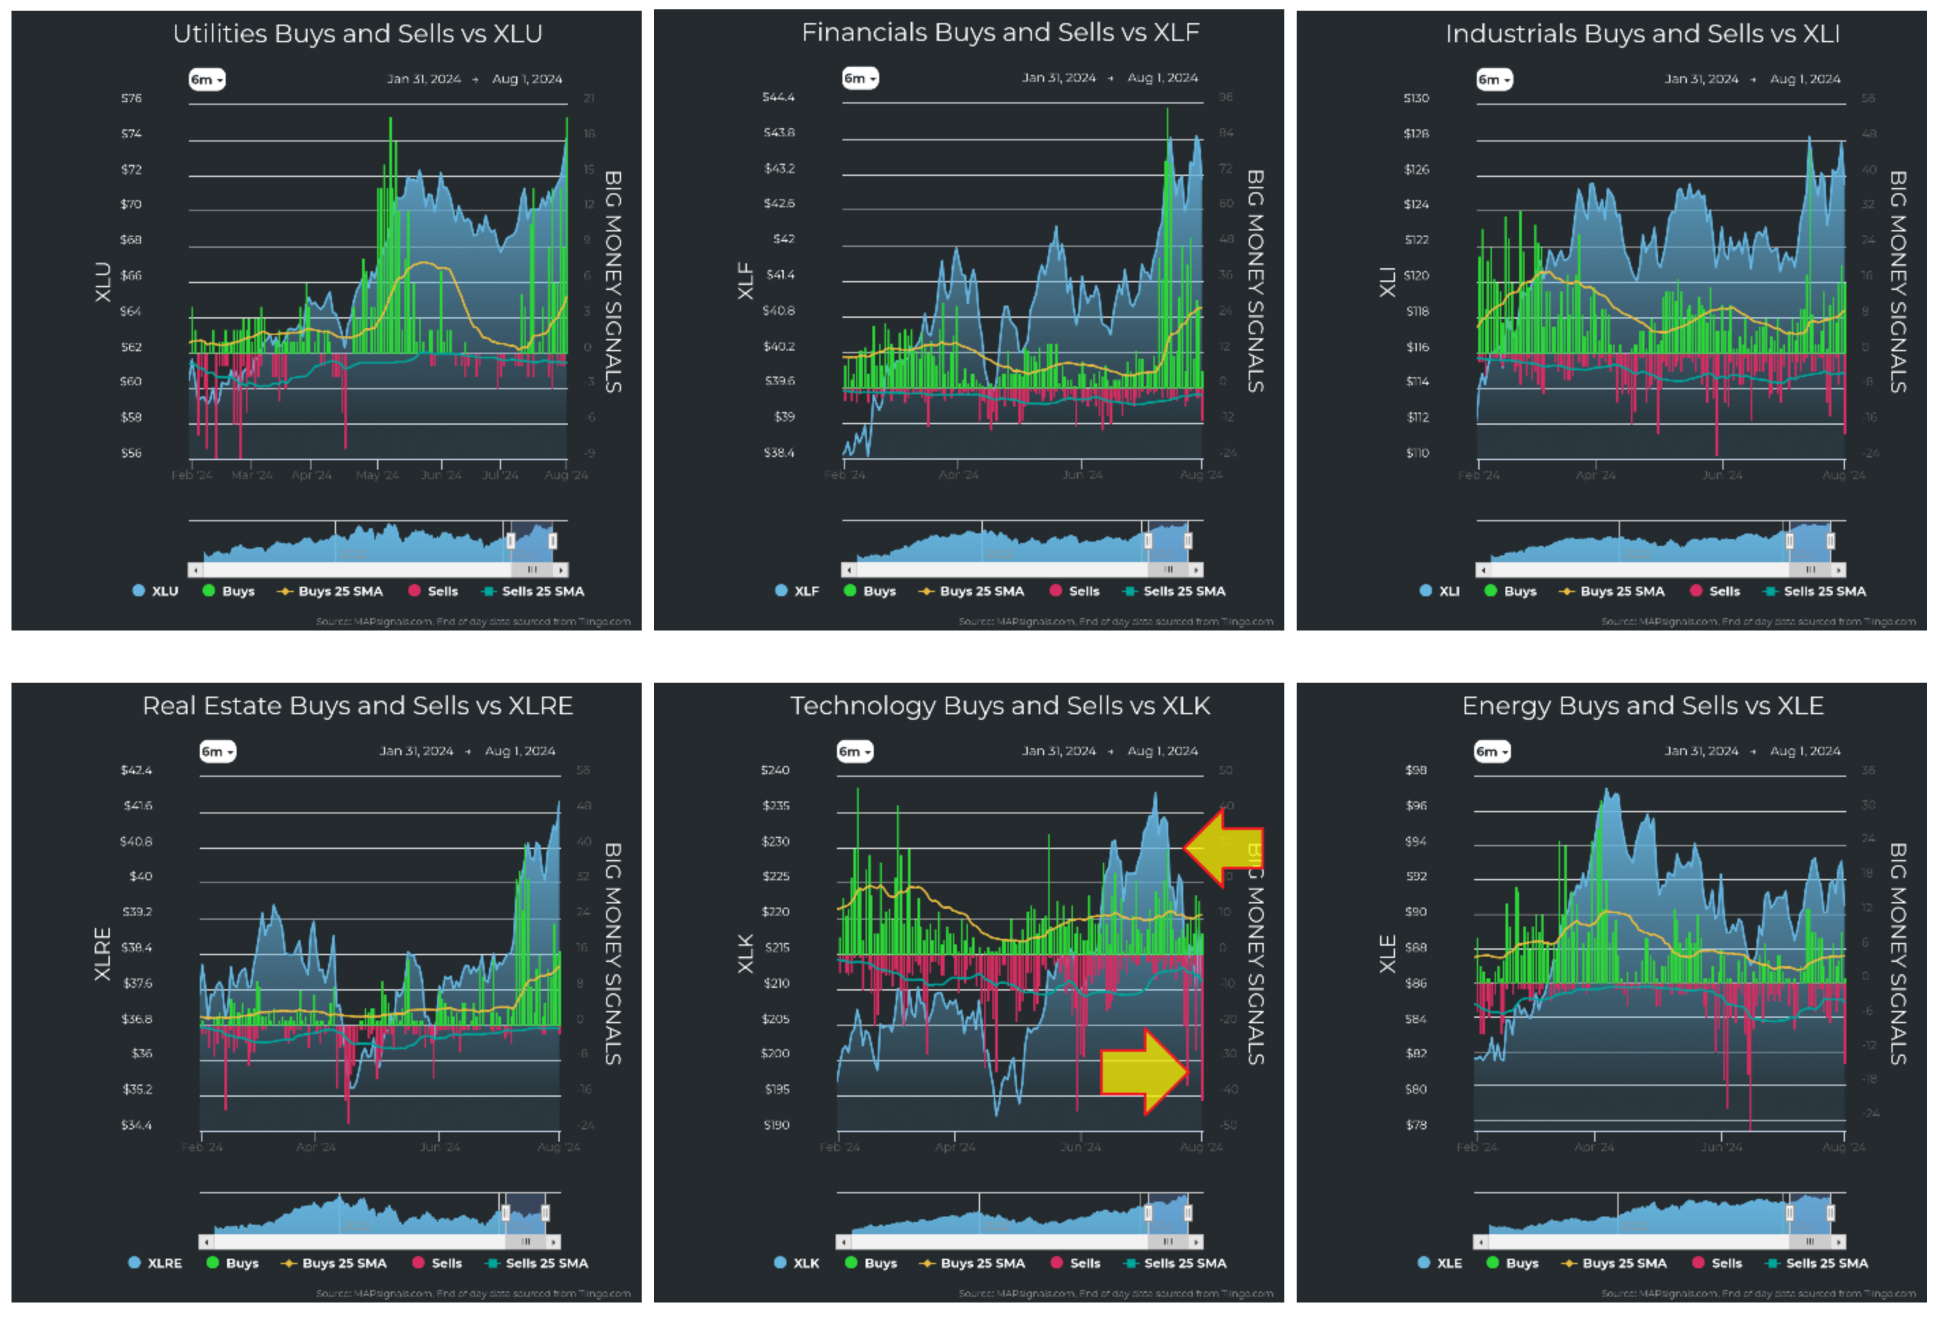
We see a massive rotation at the sector level, too. New leadership has emerged. Utilities are now our top-ranked sector, racing from #9 of 11 to #1, with Real Estate rising from near the bottom to #4. Technology and energy have fallen. Look at the charts from July 1st to August 1st below.
July 1st 2024 August 1st 2024
Graphs are for illustrative and discussion purposes only. Please read important disclosures at the end of this commentary.
The rotation is clear. Despite the index ugliness of late, there is something very constructive happening in the market. Breadth is improving. We are no longer led by just a handful of stocks. Now we are seeing a major catch-up and normalization of the stock market. In fact, the only visible pain points of weakness at the sector level are Technology and Discretionary. And let’s be honest, they were very extended sectors:
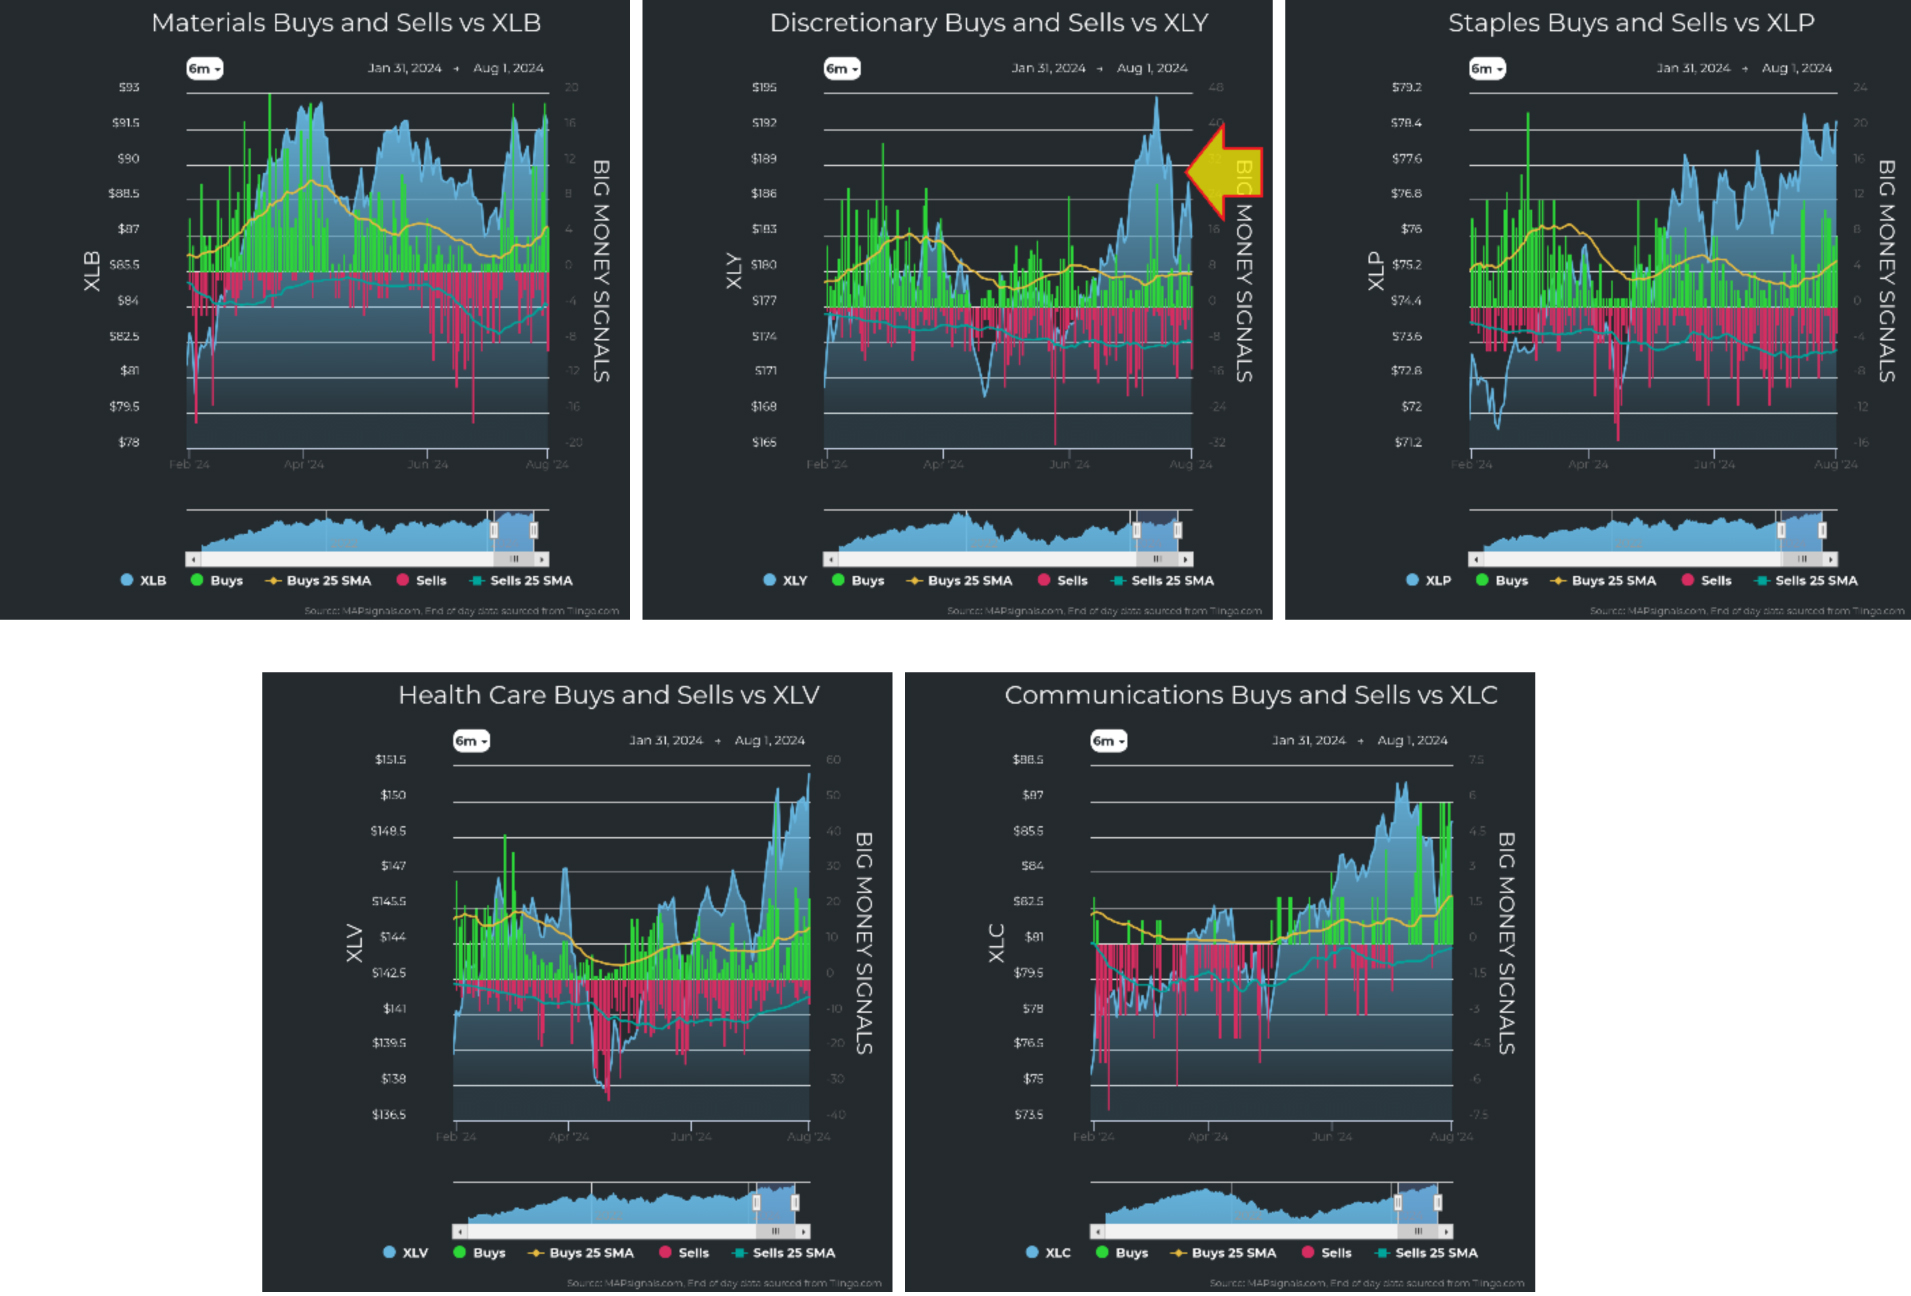
Graphs are for illustrative and discussion purposes only. Please read important disclosures at the end of this commentary.
Summer volatility is here, and it’s normal. Rates are set to fall. The election will resolve in November. This will continue the breadth widening, with small-caps catching up. Now is the time to take advantage of deals on stocks. I’d focus on small- and mid-caps with expanding sales, earnings, and profit margins.
Focus on the opportunity, and remember: “Focus is the art of knowing what to ignore” – James Clear
All content above represents the opinion of Jason Bodner of Navellier & Associates, Inc.
Also In This Issue
A Look Ahead by Louis Navellier
The Jobs Data is Weaker Than Expected
Income Mail by Bryan Perry
The Market Fears the Fed is Behind the Curve Again
Growth Mail by Gary Alexander
The Current Medal Count Between the Big 3 Economies
Global Mail by Ivan Martchev
The Bond Market is Already Cutting Rates for the Fed
Sector Spotlight by Jason Bodner
What Kind of Volatility to Expect, Especially in Election Years
View Full Archive
Read Past Issues Here

Jason Bodner
MARKETMAIL EDITOR FOR SECTOR SPOTLIGHT
Jason Bodner writes Sector Spotlight in the weekly Marketmail publication and has authored several white papers for the company. He is also Co-Founder of Macro Analytics for Professionals which produces proprietary equity accumulation/distribution research for its clients. Previously, Mr. Bodner served as Director of European Equity Derivatives for Cantor Fitzgerald Europe in London, then moved to the role of Head of Equity Derivatives North America for the same company in New York. He also served as S.V.P. Equity Derivatives for Jefferies, LLC. He received a B.S. in business administration in 1996, with honors, from Skidmore College as a member of the Periclean Honors Society. All content of “Sector Spotlight” represents the opinion of Jason Bodner
Important Disclosures:
Jason Bodner is a co-founder and co-owner of Mapsignals. Mr. Bodner is an independent contractor who is occasionally hired by Navellier & Associates to write an article and or provide opinions for possible use in articles that appear in Navellier & Associates weekly Market Mail. Mr. Bodner is not employed or affiliated with Louis Navellier, Navellier & Associates, Inc., or any other Navellier owned entity. The opinions and statements made here are those of Mr. Bodner and not necessarily those of any other persons or entities. This is not an endorsement, or solicitation or testimonial or investment advice regarding the BMI Index or any statements or recommendations or analysis in the article or the BMI Index or Mapsignals or its products or strategies.
Although information in these reports has been obtained from and is based upon sources that Navellier believes to be reliable, Navellier does not guarantee its accuracy and it may be incomplete or condensed. All opinions and estimates constitute Navellier’s judgment as of the date the report was created and are subject to change without notice. These reports are for informational purposes only and are not a solicitation for the purchase or sale of a security. Any decision to purchase securities mentioned in these reports must take into account existing public information on such securities or any registered prospectus.To the extent permitted by law, neither Navellier & Associates, Inc., nor any of its affiliates, agents, or service providers assumes any liability or responsibility nor owes any duty of care for any consequences of any person acting or refraining to act in reliance on the information contained in this communication or for any decision based on it.
Past performance is no indication of future results. Investment in securities involves significant risk and has the potential for partial or complete loss of funds invested. It should not be assumed that any securities recommendations made by Navellier. in the future will be profitable or equal the performance of securities made in this report. Dividend payments are not guaranteed. The amount of a dividend payment, if any, can vary over time and issuers may reduce dividends paid on securities in the event of a recession or adverse event affecting a specific industry or issuer.
None of the stock information, data, and company information presented herein constitutes a recommendation by Navellier or a solicitation to buy or sell any securities. Any specific securities identified and described do not represent all of the securities purchased, sold, or recommended for advisory clients. The holdings identified do not represent all of the securities purchased, sold, or recommended for advisory clients and the reader should not assume that investments in the securities identified and discussed were or will be profitable.
Information presented is general information that does not take into account your individual circumstances, financial situation, or needs, nor does it present a personalized recommendation to you. Individual stocks presented may not be suitable for every investor. Investment in securities involves significant risk and has the potential for partial or complete loss of funds invested. Investment in fixed income securities has the potential for the investment return and principal value of an investment to fluctuate so that an investor’s holdings, when redeemed, may be worth less than their original cost.
One cannot invest directly in an index. Index is unmanaged and index performance does not reflect deduction of fees, expenses, or taxes. Presentation of Index data does not reflect a belief by Navellier that any stock index constitutes an investment alternative to any Navellier equity strategy or is necessarily comparable to such strategies. Among the most important differences between the Indices and Navellier strategies are that the Navellier equity strategies may (1) incur material management fees, (2) concentrate its investments in relatively few stocks, industries, or sectors, (3) have significantly greater trading activity and related costs, and (4) be significantly more or less volatile than the Indices.
ETF Risk: We may invest in exchange traded funds (“ETFs”) and some of our investment strategies are generally fully invested in ETFs. Like traditional mutual funds, ETFs charge asset-based fees, but they generally do not charge initial sales charges or redemption fees and investors typically pay only customary brokerage fees to buy and sell ETF shares. The fees and costs charged by ETFs held in client accounts will not be deducted from the compensation the client pays Navellier. ETF prices can fluctuate up or down, and a client account could lose money investing in an ETF if the prices of the securities owned by the ETF go down. ETFs are subject to additional risks:
- ETF shares may trade above or below their net asset value;
- An active trading market for an ETF’s shares may not develop or be maintained;
- The value of an ETF may be more volatile than the underlying portfolio of securities the ETF is designed to track;
- The cost of owning shares of the ETF may exceed those a client would incur by directly investing in the underlying securities; and
- Trading of an ETF’s shares may be halted if the listing exchange’s officials deem it appropriate, the shares are delisted from the exchange, or the activation of market-wide “circuit breakers” (which are tied to large decreases in stock prices) halts stock trading generally.
Grader Disclosures: Investment in equity strategies involves substantial risk and has the potential for partial or complete loss of funds invested. The sample portfolio and any accompanying charts are for informational purposes only and are not to be construed as a solicitation to buy or sell any financial instrument and should not be relied upon as the sole factor in an investment making decision. As a matter of normal and important disclosures to you, as a potential investor, please consider the following: The performance presented is not based on any actual securities trading, portfolio, or accounts, and the reported performance of the A, B, C, D, and F portfolios (collectively the “model portfolios”) should be considered mere “paper” or pro forma performance results based on Navellier’s research.
Investors evaluating any of Navellier & Associates, Inc.’s, (or its affiliates’) Investment Products must not use any information presented here, including the performance figures of the model portfolios, in their evaluation of any Navellier Investment Products. Navellier Investment Products include the firm’s mutual funds and managed accounts. The model portfolios, charts, and other information presented do not represent actual funded trades and are not actual funded portfolios. There are material differences between Navellier Investment Products’ portfolios and the model portfolios, research, and performance figures presented here. The model portfolios and the research results (1) may contain stocks or ETFs that are illiquid and difficult to trade; (2) may contain stock or ETF holdings materially different from actual funded Navellier Investment Product portfolios; (3) include the reinvestment of all dividends and other earnings, estimated trading costs, commissions, or management fees; and, (4) may not reflect prices obtained in an actual funded Navellier Investment Product portfolio. For these and other reasons, the reported performances of model portfolios do not reflect the performance results of Navellier’s actually funded and traded Investment Products. In most cases, Navellier’s Investment Products have materially lower performance results than the performances of the model portfolios presented.
This report contains statements that are, or may be considered to be, forward-looking statements. All statements that are not historical facts, including statements about our beliefs or expectations, are “forward-looking statements” within the meaning of The U.S. Private Securities Litigation Reform Act of 1995. These statements may be identified by such forward-looking terminology as “expect,” “estimate,” “plan,” “intend,” “believe,” “anticipate,” “may,” “will,” “should,” “could,” “continue,” “project,” or similar statements or variations of such terms. Our forward-looking statements are based on a series of expectations, assumptions, and projections, are not guarantees of future results or performance, and involve substantial risks and uncertainty as described in Form ADV Part 2A of our filing with the Securities and Exchange Commission (SEC), which is available at www.adviserinfo.sec.gov or by requesting a copy by emailing info@navellier.com. All of our forward-looking statements are as of the date of this report only. We can give no assurance that such expectations or forward-looking statements will prove to be correct. Actual results may differ materially. You are urged to carefully consider all such factors.
FEDERAL TAX ADVICE DISCLAIMER: As required by U.S. Treasury Regulations, you are informed that, to the extent this presentation includes any federal tax advice, the presentation is not written by Navellier to be used, and cannot be used, for the purpose of avoiding federal tax penalties. Navellier does not advise on any income tax requirements or issues. Use of any information presented by Navellier is for general information only and does not represent tax advice either express or implied. You are encouraged to seek professional tax advice for income tax questions and assistance.
IMPORTANT NEWSLETTER DISCLOSURE:The hypothetical performance results for investment newsletters that are authored or edited by Louis Navellier, including Louis Navellier’s Growth Investor, Louis Navellier’s Breakthrough Stocks, Louis Navellier’s Accelerated Profits, and Louis Navellier’s Platinum Club, are not based on any actual securities trading, portfolio, or accounts, and the newsletters’ reported hypothetical performances should be considered mere “paper” or proforma hypothetical performance results and are not actual performance of real world trades. Navellier & Associates, Inc. does not have any relation to or affiliation with the owner of these newsletters. There are material differences between Navellier Investment Products’ portfolios and the InvestorPlace Media, LLC newsletter portfolios authored by Louis Navellier. The InvestorPlace Media, LLC newsletters contain hypothetical performance that do not include transaction costs, advisory fees, or other fees a client might incur if actual investments and trades were being made by an investor. As a result, newsletter performance should not be used to evaluate Navellier Investment services which are separate and different from the newsletters. The owner of the newsletters is InvestorPlace Media, LLC and any questions concerning the newsletters, including any newsletter advertising or hypothetical Newsletter performance claims, (which are calculated solely by Investor Place Media and not Navellier) should be referred to InvestorPlace Media, LLC at (800) 718-8289.
Please note that Navellier & Associates and the Navellier Private Client Group are managed completely independent of the newsletters owned and published by InvestorPlace Media, LLC and written and edited by Louis Navellier, and investment performance of the newsletters should in no way be considered indicative of potential future investment performance for any Navellier & Associates separately managed account portfolio. Potential investors should consult with their financial advisor before investing in any Navellier Investment Product.
Navellier claims compliance with Global Investment Performance Standards (GIPS). To receive a complete list and descriptions of Navellier’s composites and/or a presentation that adheres to the GIPS standards, please contact Navellier or click here. It should not be assumed that any securities recommendations made by Navellier & Associates, Inc. in the future will be profitable or equal the performance of securities made in this report.
FactSet Disclosure: Navellier does not independently calculate the statistical information included in the attached report. The calculation and the information are provided by FactSet, a company not related to Navellier. Although information contained in the report has been obtained from FactSet and is based on sources Navellier believes to be reliable, Navellier does not guarantee its accuracy, and it may be incomplete or condensed. The report and the related FactSet sourced information are provided on an “as is” basis. The user assumes the entire risk of any use made of this information. Investors should consider the report as only a single factor in making their investment decision. The report is for informational purposes only and is not intended as an offer or solicitation for the purchase or sale of a security. FactSet sourced information is the exclusive property of FactSet. Without prior written permission of FactSet, this information may not be reproduced, disseminated or used to create any financial products. All indices are unmanaged and performance of the indices include reinvestment of dividends and interest income, unless otherwise noted, are not illustrative of any particular investment and an investment cannot be made in any index. Past performance is no guarantee of future results.