by Jason Bodner
June 25, 2024
I analyze stocks by using unemotional data to guide me. It’s been very accurate and fruitful for 25 years.
By “data,” you may assume I’m surrounded by a sea of statistics. Just Google “trader” and look at the images: multiple screens, numbers, lines, blips, red, green, anxious faces…and a ton of nervous energy.
Wall Street has conditioned us to focus on every tick of every stock and every word of every pundit about that stock. We’ve been suckered into endless over-stimulation: a rush of daily drama, impossible to escape.
Stress is addictive. A stressed brain releases cortisol and dopamine, which encourages repeat behaviors by rewarding the brain’s pleasure center. The financial media knows this and relies on it. Their main rule is the consumer must always stay engaged.
Well, I’m breaking that rule by telling you: It’s not only OK to break away for a while… it’s essential.
I just broke away from the rat race for two weeks. I checked stocks max once a day; some days not at all. My daily intake plummeted. No CNBC. No news alerts. No serious reporters with late-breaking news.
It was awesome… I simply enjoyed the moment-to-moment joys of a family vacation in Spain and Portugal – two fairly relaxed nations that helped limit my distractions to the bare minimum.
I not only survived… I thrived. It felt great, like most well-selected vacation spots generally do.
But that’s only half the story. Long ago, I left the news and emotional drama far behind, not just on vacations, but also on a normal workday. I prefer slower thinking. It helps me avoid the emotional tax.
Shouldn’t I Look at Nvidia Each Day? It’s BIG and It’s Volatile!
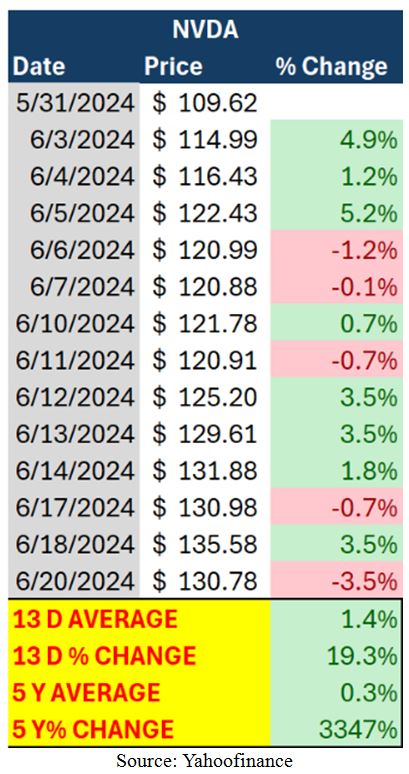
Let’s use Nvidia as an example. It has become an important holding. Dopamine rush would make me want to look at its price all day long… every tick. Clearly that’s not practical, so maybe once a day? It’s volatile. There’s so much going on with it. It is the chip leader, it’s AI; it’s the future. The stock just overtook Apple and Microsoft to be the biggest. It just split 10-for-1. It’s got plenty of drama.
On Thursday, June 20th, it sank -3.5%; the day after it rose 3.5%, up nearly $5, then down the same. That’s a monstrous 7% swing, but it ended where it started. For my share holdings, that’s thousands of dollars up or down, each day. That can be gut-wrenching, but I prefer using a longer lens. Starting June 1st – if I ignored it during my vacation – I would have missed a wild ride, but NVDA surged +19.3% in 20 days, peaking at +23.7%. The average move for those 13 trading days was +1.4%, or $42 billion a day!
Now if I used a much longer time horizon, the return was +3,347% and the daily move averaged +0.3%.
Graphs are for illustrative and discussion purposes only. Please read important disclosures at the end of this commentary.
Granted, not all stocks are NVDA, but this shows the importance of looking away to see a bigger picture.
But, you may ask: What if it drops 10% next week?
I prefer asking, What might Nvidia look like five years from now? This allows me to take a more stoic and peaceful investing approach.
Naturally, I look at data all the time, but I prefer to run it down weekly, not daily, hourly – or each second.
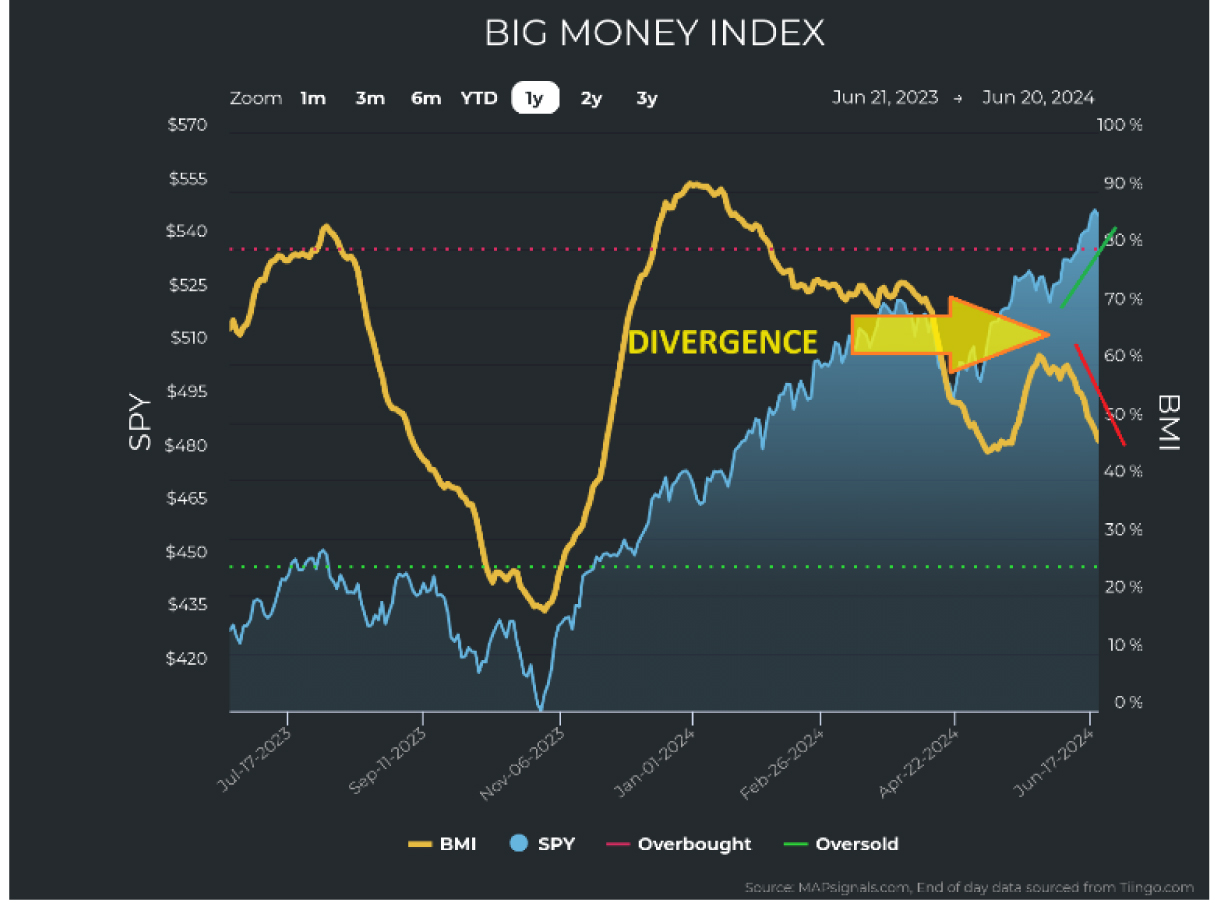
Last week saw a rising market and a sinking Big Money Index (BMI):
Graphs are for illustrative and discussion purposes only. Please read important disclosures at the end of this commentary.
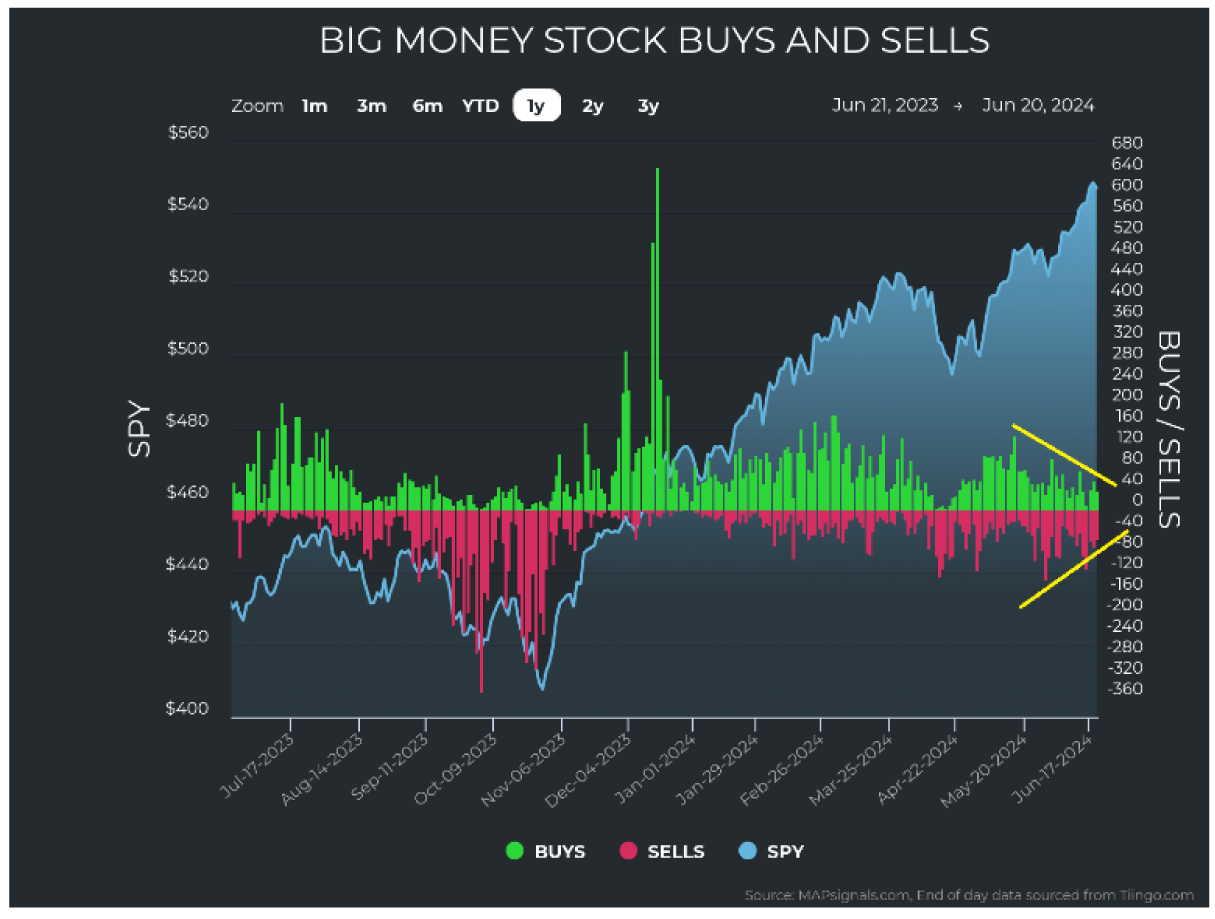
Is this a cause for concern? Well, the first thing we should take note of is that buying is shrinking, but so is selling. This wedge tightening means that accumulation and distribution are both dwindling:
Graphs are for illustrative and discussion purposes only. Please read important disclosures at the end of this commentary.
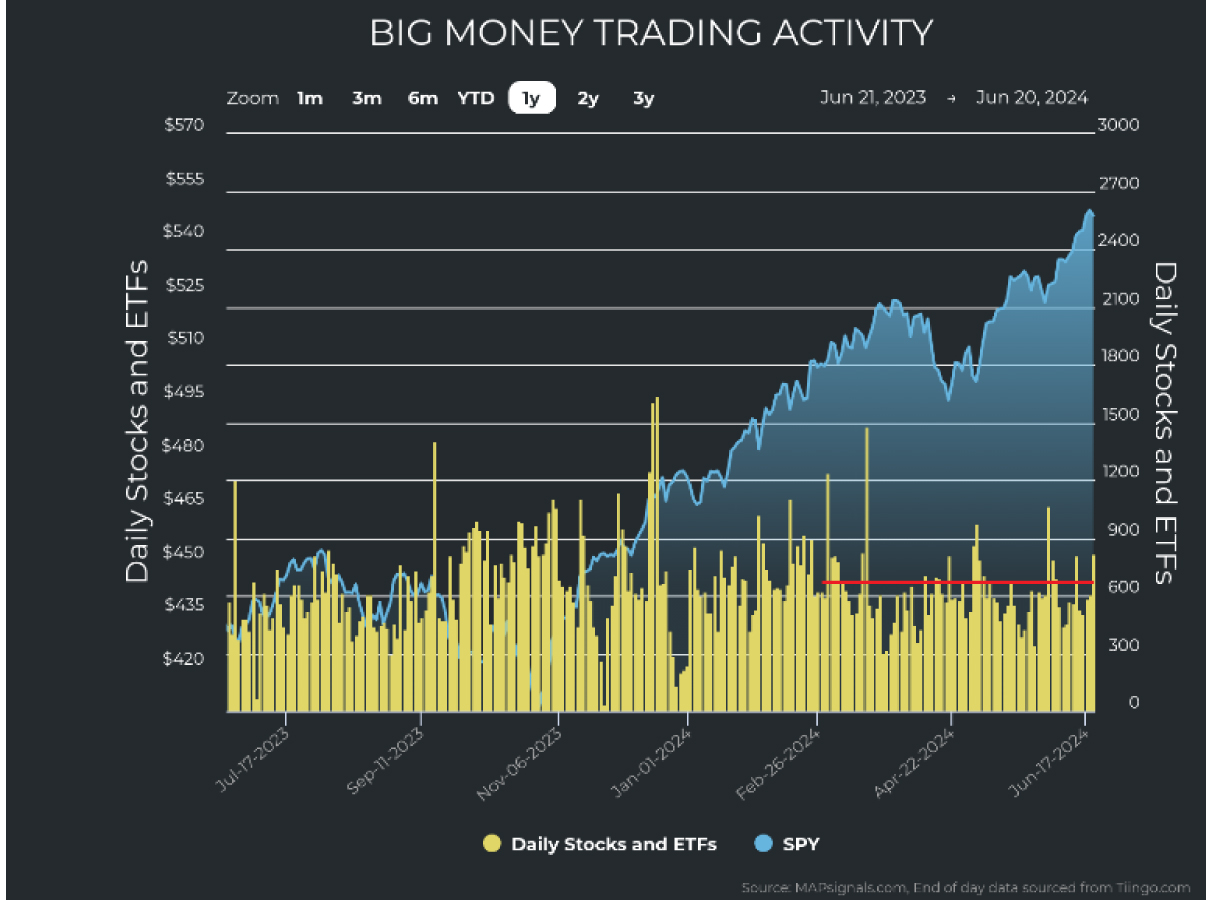
This is happening while unusually large trade volumes are staying fairly constant.
Graphs are for illustrative and discussion purposes only. Please read important disclosures at the end of this commentary.
This indicates a potential shift for a few reasons:
- Fewer stocks are making new highs, while more stocks are making new lows. This table shows a disconcerting picture:
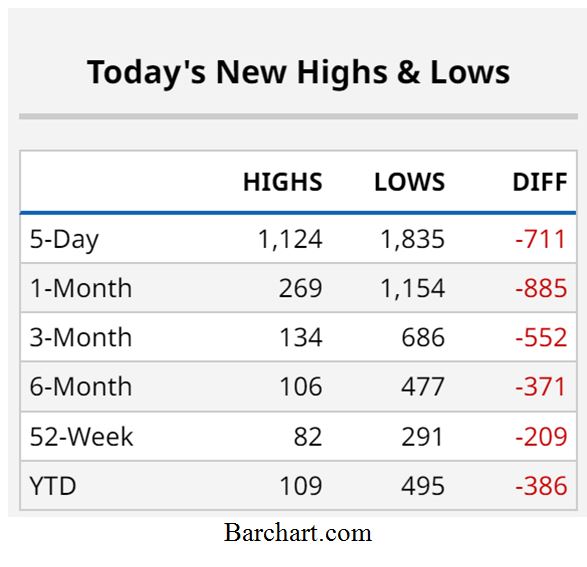
Graphs are for illustrative and discussion purposes only. Please read important disclosures at the end of this commentary.
- The stocks that have been hitting new highs on big volume are the huge ones – the megacaps. Look at this chart of monster stocks getting gobbled up since May 1st:
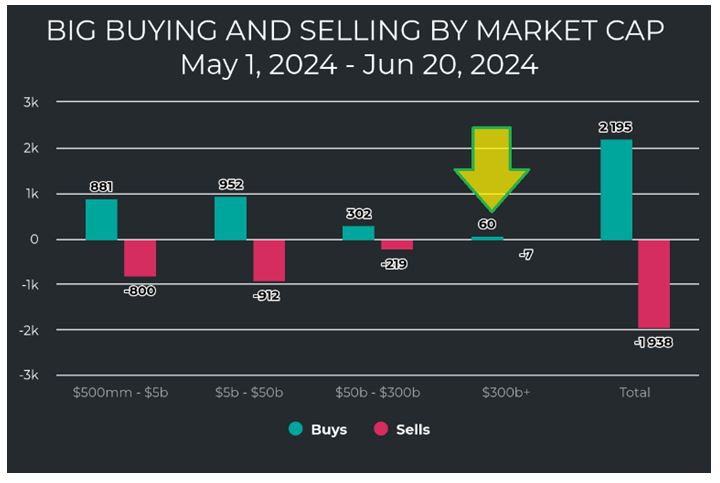
Graphs are for illustrative and discussion purposes only. Please read important disclosures at the end of this commentary
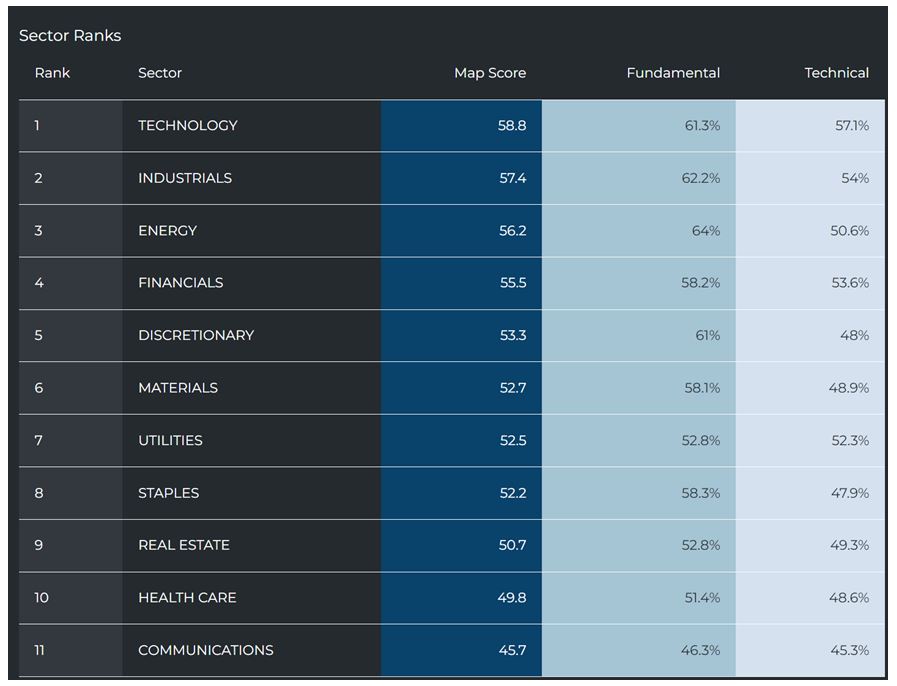
- When you look past the glitz and glamour of the megacaps, sector breadth shows a tired market. Below, you’ll see that, in terms of price action, tech is surging higher while nearly every other sector is chopping sideways. And when you focus on unusual buys and sells, there’s not a ton of green, and there is some red emerging:
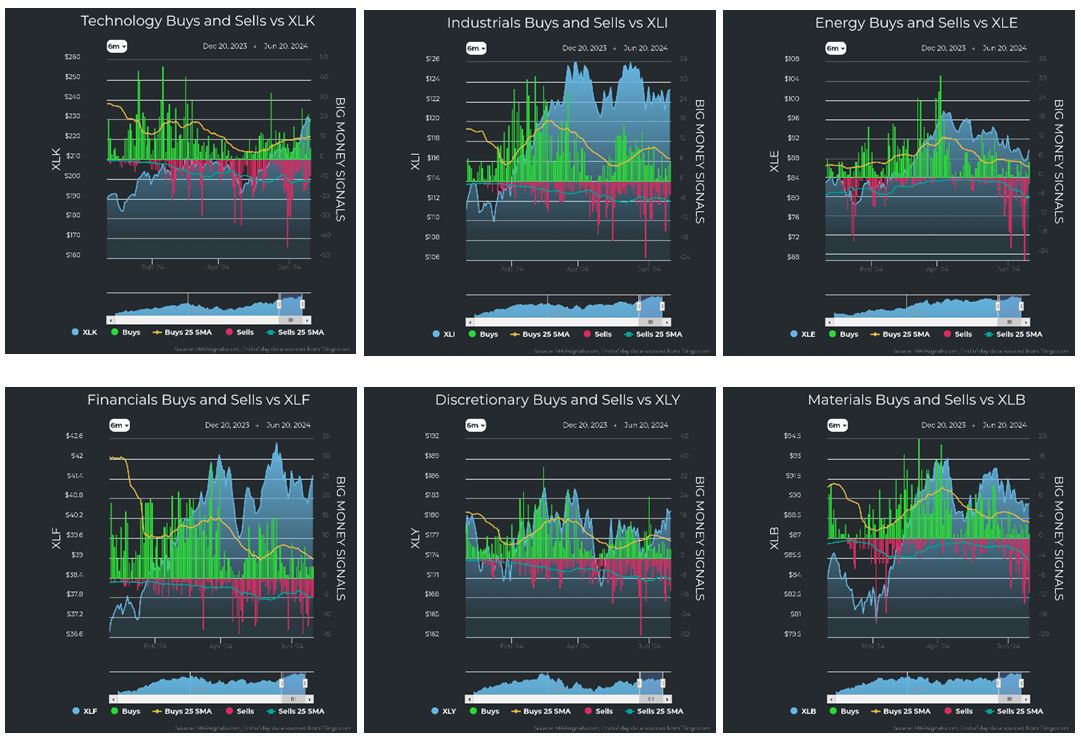
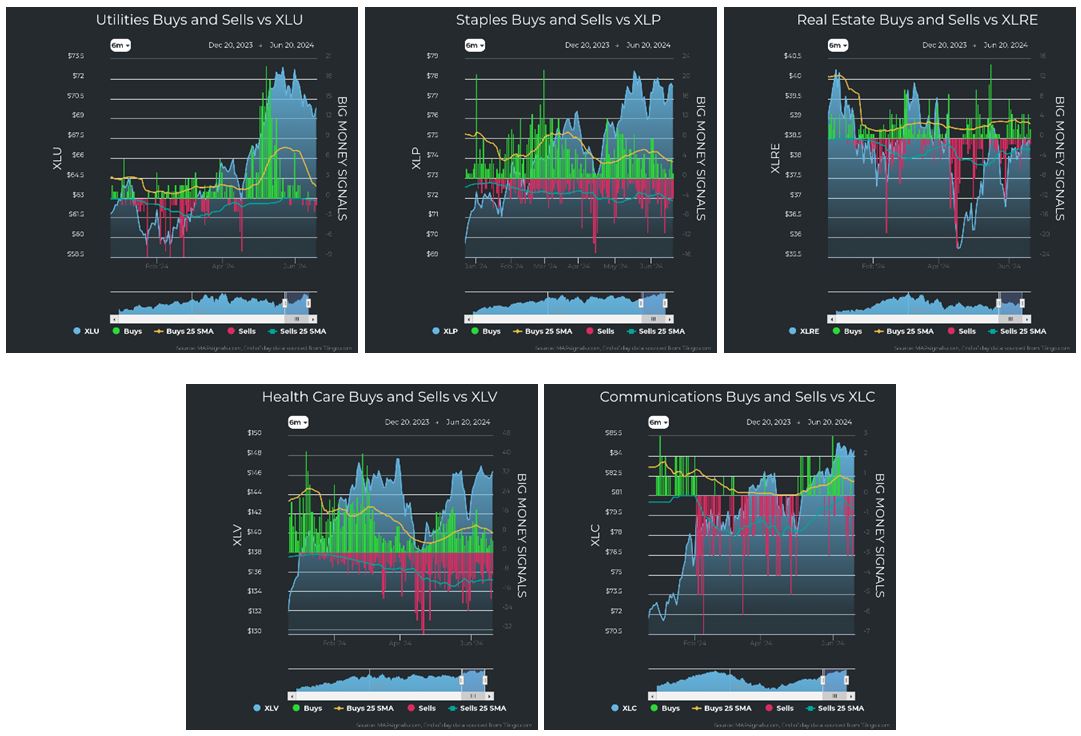
Graphs are for illustrative and discussion purposes only. Please read important disclosures at the end of this commentary.
Graphs are for illustrative and discussion purposes only. Please read important disclosures at the end of this commentary.
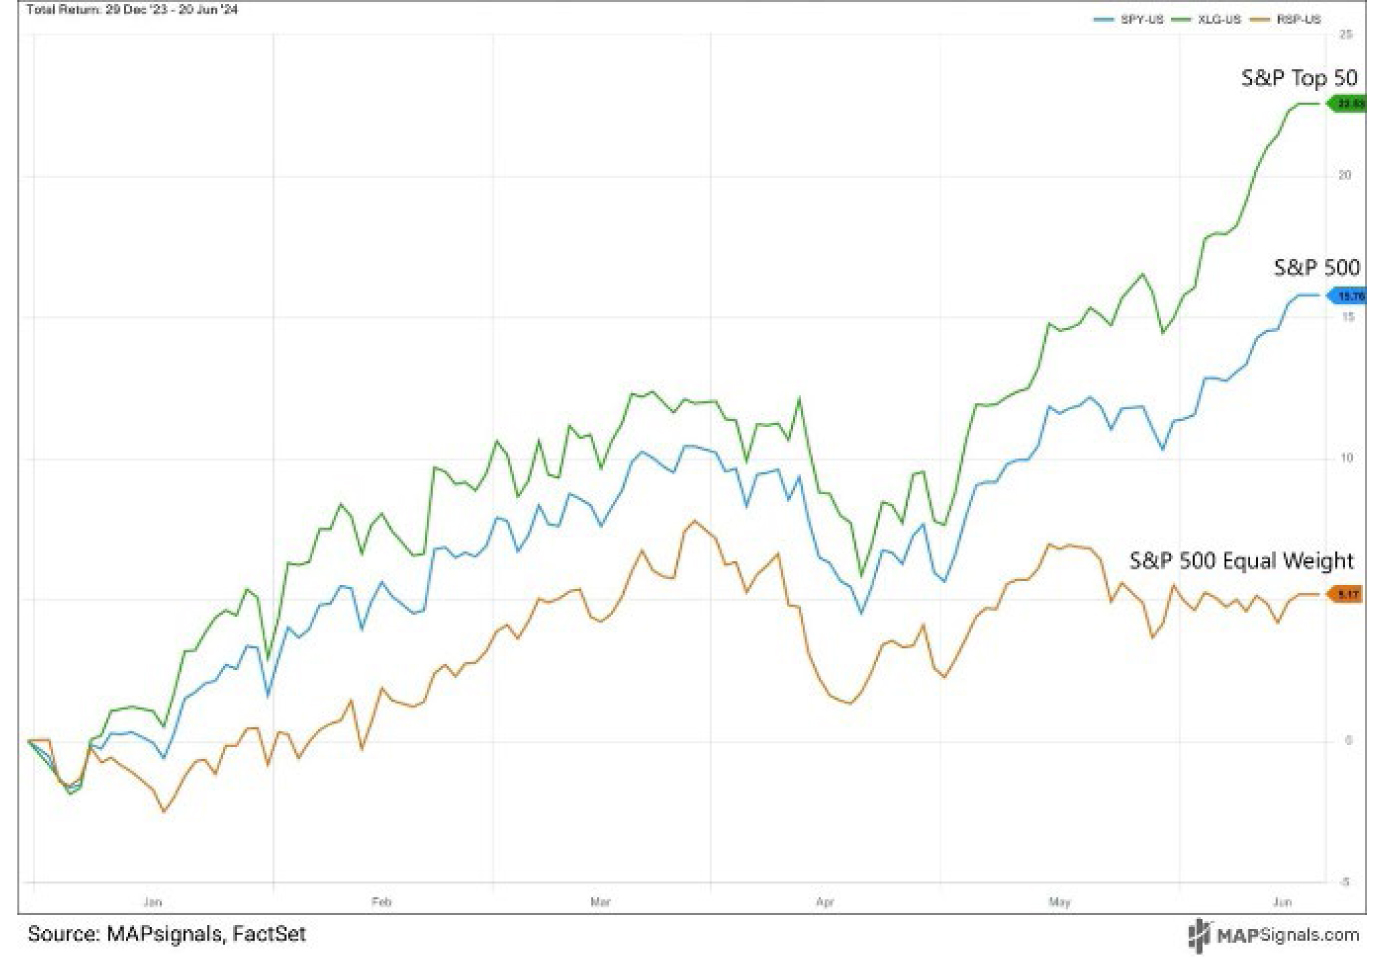
- Breadth is at alarmingly low levels. The following charts show us that the top big stocks are leaving the rest in the dust. In this chart, we see the top 50 S&P stocks are outperforming both the S&P 500 and the equal weighted S&P 500, meaning the biggest stocks are holding up the market.
Graphs are for illustrative and discussion purposes only. Please read important disclosures at the end of this commentary.
- 64% of SPX stocks today are below their 50-day moving average. In other words, 2/3rds of S&P 500 stocks are down considerably while the index is at ATH.
- Seasonality says that while we may normally expect a nice July, we should expect some volatility especially in August and September (and the first weeks of October):
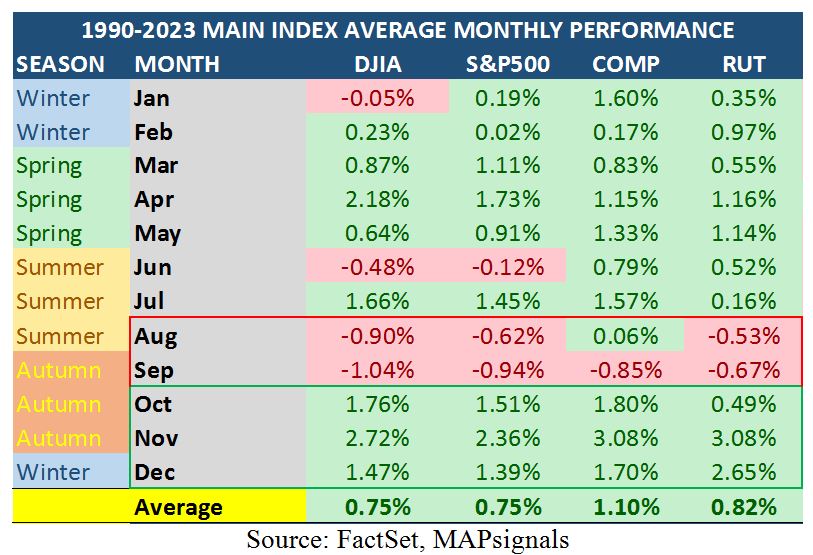
Graphs are for illustrative and discussion purposes only. Please read important disclosures at the end of this commentary.
Uh-oh. So far, this doesn’t sound much like my normally bullish self as I echo some prevalent bearish theories. But again, it’s all in perspective and your ability to look at the bigger picture. The market always brings opportunity even when it may look gloomy. Weak breadth may feel like pending doom, but in fact it’s a rare gift historically speaking. The following chart essentially says that all the laggards are set to play major catch-up. When breadth levels fall this low, the equal weighted S&P 500 historically outperforms big-time with a high win rate:
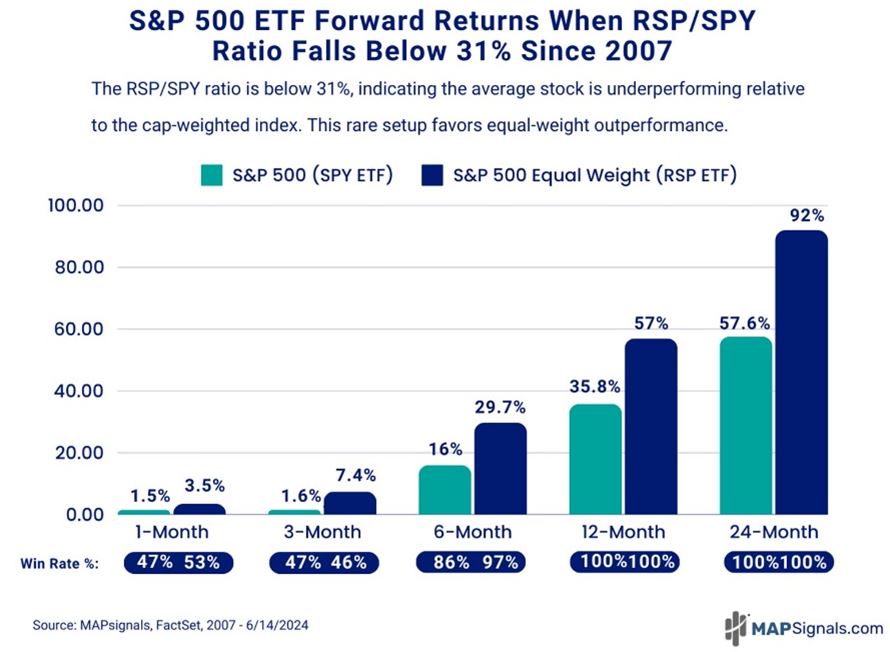
Graphs are for illustrative and discussion purposes only. Please read important disclosures at the end of this commentary.
Summer months often mean summer bumps. Nervous energy and focusing on every little thing may limit our future gains. If we clear our heads and step back, we can recognize the longer-term opportunity.
The playbook is always the same: Find stocks with superior fundamentals and big money inflows. This drastically reduces the playing field and focuses our opportunity list. We specialize in finding the next Nvidias. They reveal themselves through growth and performance. The trick is finding them early on.
The next trick is deciding to buy. And as Rush drummer Neil Peart said: “If you choose not to decide, you still have made a choice.”
Navellier & Associates owns Nvidia Corp (NVDA), Microsoft Corp (MSFT), and some accounts own Apple Computer (AAPL), in managed accounts. Jason Bodner personally owns Nvidia Corp (NVDA), but he does not own Microsoft Corp (MSFT), and Apple Computer (AAPL).
All content above represents the opinion of Jason Bodner of Navellier & Associates, Inc.
Also In This Issue
A Look Ahead by Louis Navellier
Bond Traders (Not the Fed) Control Interest Rates
Income Mail by Bryan Perry
The Torrid AI Rally Takes a “Pause That Refreshes”
Growth Mail by Gary Alexander
Keep Investing – Even During World War III
Global Mail by Ivan Martchev
More European Political Fireworks Are Coming
Sector Spotlight by Jason Bodner
Try Not to Track Stock Prices Daily
View Full Archive
Read Past Issues Here

Jason Bodner
MARKETMAIL EDITOR FOR SECTOR SPOTLIGHT
Jason Bodner writes Sector Spotlight in the weekly Marketmail publication and has authored several white papers for the company. He is also Co-Founder of Macro Analytics for Professionals which produces proprietary equity accumulation/distribution research for its clients. Previously, Mr. Bodner served as Director of European Equity Derivatives for Cantor Fitzgerald Europe in London, then moved to the role of Head of Equity Derivatives North America for the same company in New York. He also served as S.V.P. Equity Derivatives for Jefferies, LLC. He received a B.S. in business administration in 1996, with honors, from Skidmore College as a member of the Periclean Honors Society. All content of “Sector Spotlight” represents the opinion of Jason Bodner
Important Disclosures:
Jason Bodner is a co-founder and co-owner of Mapsignals. Mr. Bodner is an independent contractor who is occasionally hired by Navellier & Associates to write an article and or provide opinions for possible use in articles that appear in Navellier & Associates weekly Market Mail. Mr. Bodner is not employed or affiliated with Louis Navellier, Navellier & Associates, Inc., or any other Navellier owned entity. The opinions and statements made here are those of Mr. Bodner and not necessarily those of any other persons or entities. This is not an endorsement, or solicitation or testimonial or investment advice regarding the BMI Index or any statements or recommendations or analysis in the article or the BMI Index or Mapsignals or its products or strategies.
Although information in these reports has been obtained from and is based upon sources that Navellier believes to be reliable, Navellier does not guarantee its accuracy and it may be incomplete or condensed. All opinions and estimates constitute Navellier’s judgment as of the date the report was created and are subject to change without notice. These reports are for informational purposes only and are not a solicitation for the purchase or sale of a security. Any decision to purchase securities mentioned in these reports must take into account existing public information on such securities or any registered prospectus.To the extent permitted by law, neither Navellier & Associates, Inc., nor any of its affiliates, agents, or service providers assumes any liability or responsibility nor owes any duty of care for any consequences of any person acting or refraining to act in reliance on the information contained in this communication or for any decision based on it.
Past performance is no indication of future results. Investment in securities involves significant risk and has the potential for partial or complete loss of funds invested. It should not be assumed that any securities recommendations made by Navellier. in the future will be profitable or equal the performance of securities made in this report. Dividend payments are not guaranteed. The amount of a dividend payment, if any, can vary over time and issuers may reduce dividends paid on securities in the event of a recession or adverse event affecting a specific industry or issuer.
None of the stock information, data, and company information presented herein constitutes a recommendation by Navellier or a solicitation to buy or sell any securities. Any specific securities identified and described do not represent all of the securities purchased, sold, or recommended for advisory clients. The holdings identified do not represent all of the securities purchased, sold, or recommended for advisory clients and the reader should not assume that investments in the securities identified and discussed were or will be profitable.
Information presented is general information that does not take into account your individual circumstances, financial situation, or needs, nor does it present a personalized recommendation to you. Individual stocks presented may not be suitable for every investor. Investment in securities involves significant risk and has the potential for partial or complete loss of funds invested. Investment in fixed income securities has the potential for the investment return and principal value of an investment to fluctuate so that an investor’s holdings, when redeemed, may be worth less than their original cost.
One cannot invest directly in an index. Index is unmanaged and index performance does not reflect deduction of fees, expenses, or taxes. Presentation of Index data does not reflect a belief by Navellier that any stock index constitutes an investment alternative to any Navellier equity strategy or is necessarily comparable to such strategies. Among the most important differences between the Indices and Navellier strategies are that the Navellier equity strategies may (1) incur material management fees, (2) concentrate its investments in relatively few stocks, industries, or sectors, (3) have significantly greater trading activity and related costs, and (4) be significantly more or less volatile than the Indices.
ETF Risk: We may invest in exchange traded funds (“ETFs”) and some of our investment strategies are generally fully invested in ETFs. Like traditional mutual funds, ETFs charge asset-based fees, but they generally do not charge initial sales charges or redemption fees and investors typically pay only customary brokerage fees to buy and sell ETF shares. The fees and costs charged by ETFs held in client accounts will not be deducted from the compensation the client pays Navellier. ETF prices can fluctuate up or down, and a client account could lose money investing in an ETF if the prices of the securities owned by the ETF go down. ETFs are subject to additional risks:
- ETF shares may trade above or below their net asset value;
- An active trading market for an ETF’s shares may not develop or be maintained;
- The value of an ETF may be more volatile than the underlying portfolio of securities the ETF is designed to track;
- The cost of owning shares of the ETF may exceed those a client would incur by directly investing in the underlying securities; and
- Trading of an ETF’s shares may be halted if the listing exchange’s officials deem it appropriate, the shares are delisted from the exchange, or the activation of market-wide “circuit breakers” (which are tied to large decreases in stock prices) halts stock trading generally.
Grader Disclosures: Investment in equity strategies involves substantial risk and has the potential for partial or complete loss of funds invested. The sample portfolio and any accompanying charts are for informational purposes only and are not to be construed as a solicitation to buy or sell any financial instrument and should not be relied upon as the sole factor in an investment making decision. As a matter of normal and important disclosures to you, as a potential investor, please consider the following: The performance presented is not based on any actual securities trading, portfolio, or accounts, and the reported performance of the A, B, C, D, and F portfolios (collectively the “model portfolios”) should be considered mere “paper” or pro forma performance results based on Navellier’s research.
Investors evaluating any of Navellier & Associates, Inc.’s, (or its affiliates’) Investment Products must not use any information presented here, including the performance figures of the model portfolios, in their evaluation of any Navellier Investment Products. Navellier Investment Products include the firm’s mutual funds and managed accounts. The model portfolios, charts, and other information presented do not represent actual funded trades and are not actual funded portfolios. There are material differences between Navellier Investment Products’ portfolios and the model portfolios, research, and performance figures presented here. The model portfolios and the research results (1) may contain stocks or ETFs that are illiquid and difficult to trade; (2) may contain stock or ETF holdings materially different from actual funded Navellier Investment Product portfolios; (3) include the reinvestment of all dividends and other earnings, estimated trading costs, commissions, or management fees; and, (4) may not reflect prices obtained in an actual funded Navellier Investment Product portfolio. For these and other reasons, the reported performances of model portfolios do not reflect the performance results of Navellier’s actually funded and traded Investment Products. In most cases, Navellier’s Investment Products have materially lower performance results than the performances of the model portfolios presented.
This report contains statements that are, or may be considered to be, forward-looking statements. All statements that are not historical facts, including statements about our beliefs or expectations, are “forward-looking statements” within the meaning of The U.S. Private Securities Litigation Reform Act of 1995. These statements may be identified by such forward-looking terminology as “expect,” “estimate,” “plan,” “intend,” “believe,” “anticipate,” “may,” “will,” “should,” “could,” “continue,” “project,” or similar statements or variations of such terms. Our forward-looking statements are based on a series of expectations, assumptions, and projections, are not guarantees of future results or performance, and involve substantial risks and uncertainty as described in Form ADV Part 2A of our filing with the Securities and Exchange Commission (SEC), which is available at www.adviserinfo.sec.gov or by requesting a copy by emailing info@navellier.com. All of our forward-looking statements are as of the date of this report only. We can give no assurance that such expectations or forward-looking statements will prove to be correct. Actual results may differ materially. You are urged to carefully consider all such factors.
FEDERAL TAX ADVICE DISCLAIMER: As required by U.S. Treasury Regulations, you are informed that, to the extent this presentation includes any federal tax advice, the presentation is not written by Navellier to be used, and cannot be used, for the purpose of avoiding federal tax penalties. Navellier does not advise on any income tax requirements or issues. Use of any information presented by Navellier is for general information only and does not represent tax advice either express or implied. You are encouraged to seek professional tax advice for income tax questions and assistance.
IMPORTANT NEWSLETTER DISCLOSURE:The hypothetical performance results for investment newsletters that are authored or edited by Louis Navellier, including Louis Navellier’s Growth Investor, Louis Navellier’s Breakthrough Stocks, Louis Navellier’s Accelerated Profits, and Louis Navellier’s Platinum Club, are not based on any actual securities trading, portfolio, or accounts, and the newsletters’ reported hypothetical performances should be considered mere “paper” or proforma hypothetical performance results and are not actual performance of real world trades. Navellier & Associates, Inc. does not have any relation to or affiliation with the owner of these newsletters. There are material differences between Navellier Investment Products’ portfolios and the InvestorPlace Media, LLC newsletter portfolios authored by Louis Navellier. The InvestorPlace Media, LLC newsletters contain hypothetical performance that do not include transaction costs, advisory fees, or other fees a client might incur if actual investments and trades were being made by an investor. As a result, newsletter performance should not be used to evaluate Navellier Investment services which are separate and different from the newsletters. The owner of the newsletters is InvestorPlace Media, LLC and any questions concerning the newsletters, including any newsletter advertising or hypothetical Newsletter performance claims, (which are calculated solely by Investor Place Media and not Navellier) should be referred to InvestorPlace Media, LLC at (800) 718-8289.
Please note that Navellier & Associates and the Navellier Private Client Group are managed completely independent of the newsletters owned and published by InvestorPlace Media, LLC and written and edited by Louis Navellier, and investment performance of the newsletters should in no way be considered indicative of potential future investment performance for any Navellier & Associates separately managed account portfolio. Potential investors should consult with their financial advisor before investing in any Navellier Investment Product.
Navellier claims compliance with Global Investment Performance Standards (GIPS). To receive a complete list and descriptions of Navellier’s composites and/or a presentation that adheres to the GIPS standards, please contact Navellier or click here. It should not be assumed that any securities recommendations made by Navellier & Associates, Inc. in the future will be profitable or equal the performance of securities made in this report.
FactSet Disclosure: Navellier does not independently calculate the statistical information included in the attached report. The calculation and the information are provided by FactSet, a company not related to Navellier. Although information contained in the report has been obtained from FactSet and is based on sources Navellier believes to be reliable, Navellier does not guarantee its accuracy, and it may be incomplete or condensed. The report and the related FactSet sourced information are provided on an “as is” basis. The user assumes the entire risk of any use made of this information. Investors should consider the report as only a single factor in making their investment decision. The report is for informational purposes only and is not intended as an offer or solicitation for the purchase or sale of a security. FactSet sourced information is the exclusive property of FactSet. Without prior written permission of FactSet, this information may not be reproduced, disseminated or used to create any financial products. All indices are unmanaged and performance of the indices include reinvestment of dividends and interest income, unless otherwise noted, are not illustrative of any particular investment and an investment cannot be made in any index. Past performance is no guarantee of future results.