by Louis Navellier
June 18, 2024
The Fed’s Federal Open Market Committee (FOMC) statement on Wednesday acknowledged “modest further progress” on inflation. That was the good news. The bad news is that the Fed did not lower its inflation forecast based on the Personal Consumption Expenditure (PCE) index and it raised its unemployment forecast to 4.1%. In his best Fed-speak, Fed Chairman Jerome Powell said, “We’ll need to see more good data to bolster our confidence that inflation is moving sustainably toward 2%.”
The biggest news was the update of the Fed’s “dot plot” by the FOMC members, where eight members expected two rate cuts this year, seven forecast just one rate cut in 2024 and four said that there would be no rate cuts this year, so the median of these three diverging opinions yielded only one key interest rate cut to occur this year, perhaps on September 18th or immediately after the November Presidential election.
The only good news is the “dot plot” forecasted four key interest rate cuts in 2025. Overall, I am grossly disappointed in the Fed, since their previous “dot plot” forecasted three key interest rates cuts this year.
As I mentioned in Wednesday’s podcast, I am very disappointed in the Fed, including some new FOMC members that are not qualified. In my opinion, Fed Chairman Powell has lost control of the FOMC due to all of the infighting and diverging opinions, so rather than promoting certainty, the Fed is promoting uncertainty. The Fed cannot seem to get a unified message out. As a result, I have lost any confidence in Fed Chairman Powell, and I stand by my podcast statement that he is weak and needs to be replaced.
In the meantime, Treasury yields continued to decline in the wake of the better-than-expected CPI & PPI. The bond vigilantes are now in charge and controlling Treasury yields. As I have repeatedly said, the Fed cannot fight market rates, so if the Treasury yields go lower, the Fed may be forced to cut rates sooner.
Since our Fed is now lagging Europe in cutting key interest rates, “carry trades” are expected to increase. That’s where foreigners put money in the U.S. dollar seeking higher yields in a strong currency. If these carry trades approach a trillion dollars, they could actually drive Treasury yields significantly lower and encourage the Fed to cut interest rate sooner than they would otherwise cut them, forcing the Fed’s hand.
The G7 Meets in Italy – As Europe Lurches Toward World War III
We are inching closer to World War III, now that the U.S. and Britain have provided Ukraine permission to use U.S. and British long-range missiles to strike deeper into Russia, provided they do not strike the Kremlin or the greater Moscow area. Vice President Kamala Harris and National Security Advisor Jake Sullivan attended a peace summit regarding Ukraine in Switzerland. I suspect that a more serious peace deal between Ukraine and Russia will ensue in the upcoming months, since otherwise, the death toll from the fighting will become intolerable. Meanwhile, Ukrainian President Volodymr Zelensky needs to make a peace deal ASAP, since he recently warned Donald Trump that he could be a “loser president” if he imposes a poor peace deal, implying that Ukraine could only survive while Joe Biden remains in office.
There are a couple of notable takeaways from the G7 meeting in Italy. First, Bloomberg reported that the food was wonderful, so welcome to Italy! Second, the G7 agreed to provide Ukraine with a loan of up to $50 billion, backed by frozen Russian assets associated with seized Russian central bank assets. Earlier, France, Germany and Italy had opposed selling those seized Russian central bank assets, so instead, they are just using the profits from those seized assets to loan money to Ukraine. Finally, the G7’s official communique was not very nice to China and criticized Beijing for “enabling” Russia’s war in Ukraine.
Josh Wingrove, a Bloomberg White House Reporter, said that the G7 leaders agreed to express “concerns about China’s persistent industrial targeting and comprehensive non-market policies and practices that are leading to global spillovers, market distortions and harmful overcapacity in a growing range of sectors.” So much for free trade! The G7 is becoming increasingly isolationist and erecting trade barriers via tariffs.
Speaking of tariffs, when Donald Trump visited Washington DC last week and met with Congressional leaders, he floated the idea of eliminating income taxes and replacing the lost revenue with higher tariffs. I said on CNBC Asia on Thursday that this is a controversial idea and he doesn’t really mean it. However, since Trump is good at getting hits on the internet, I suspect that the rhetoric to replace the federal income tax will resonate with many voters. As a result, the Presidential election is getting much more interesting!
Since Ukraine has lost 35% of its population through emigration, attrition and war deaths, and many of its major cities have been obliterated, all continued fighting does is ensure that its economy cannot recover. That, and the death of an estimated 500,000 Russian soldiers, makes the fighting increasingly futile. There is no way that Ukraine can effectively defeat Russia as Ukraine runs out of soldiers. I fear that Ukraine’s attacks on Russian refineries, export terminals and the Trans-Siberian railroad means that the next big target is the Russian Arctic crude oil pipeline, which could send crude oil prices to over $100 per barrel.
Crude oil prices rose last week after Goldman Sachs analysts said Brent light sweet crude oil should rise to $86 per barrel in the third quarter due to summer fuel demand. Goldman Sachs predicted a trading range of $75 to $90 per barrel for Brent. As Europe and other major economies recover, and as central banks cut key interest rates and global growth recovers, crude oil prices are expected to meander higher. Overall, the strong seasonal demand that drives crude oil higher in the summer appears to be underway.
Obviously distraught at the recent parliamentary elections, French President Emmanuel Macron called a snap parliament election. Exit polls in France gave the Rassemblement National (RN) party 31.4% of the vote, which was more than double the vote to Macron’s Centrist Alliance party (14.6%). The RN party is led by firebrand Marine Le Pen, who picked an exciting young leader, Jordan Bardella, who is only 28 years old and will be harder to demonize by Macron and other opponents. Interestingly, young voters in Europe are leading this conservative wave. As a result, a new French Revolution may be underway!
In the wake of recent EU elections, I fear that the EU is increasingly likely to break up. Specifically, the recent EU parliamentary elections resulted in a definite shift to the right, especially in France and Germany. The new ruling coalitions are expected to be: (1) less willing to implement aggressive climate control actions, (2) less friendly to mass immigration and (3) more skeptical about aiding Ukraine.
As for tariffs, the European Union (EU) announced last week that it formally notified Chinese vehicle manufacturers, including BYD, Geely (which owns Volvo) and SAIC (the MG brand) that it will be imposing tariffs up to 48% on electric vehicles (EVs). Approximately one-fifth of EV sales in Europe were Chinese brands in 2023 and that total is expected to rise to a 25% market share in 2024. So now Chinese EV manufacturers face up to 48% tariffs in the EU and a 100% tariff on EVs sent to the U.S.
China has been expanding its presence in Eastern European countries like the Czech Republic, Hungary and Slovakia. Hungary has invested heavily in battery manufacturing with Chinese partners and even secured a BYD factory. Since the EU is ignoring countries that have big automotive industries, like Germany and Hungary, the ruling elites in Brussels are clearly not listening to its EU members.
And finally, Tesla shareholders on Thursday re-approved Elon Musk’s $48 billion pay package (at the current stock price) as well as a move to reincorporate in Texas from Delaware. The reason Musk wanted to move Tesla’s HQ to Texas is that a Delaware judge previously blocked his generous pay package as excessive. Since Musk made many Tesla shareholders rich in previous years, apparently shareholders have no problem awarding Musk with another generous stock grant. In the meantime, the images of satellite photos of new Tesla’s being stored at manufacturing plants around the world is truly scary. As a result, I suspect Tesla price cuts and/or lease deals may be forthcoming to help move its excess inventory.
The Coming Move in Selected Small-Cap Stocks
Our friends at Bespoke have a great feature called “Chart of the Day” and they presented a pair of charts with the title “It’s the Market Cap, Stupid” that broke the performance of the S&P 500 into deciles. For both the second quarter and year-to-date performance, the top decile (the largest capitalization stocks) in the S&P 500 rose 2% and 15.3%, respectively. Conversely, the bottom decile (the smallest capitalization stocks in the S&P 500) declined 10.3% (so far in second quarter) and 7.3% (year-to-date), respectively.
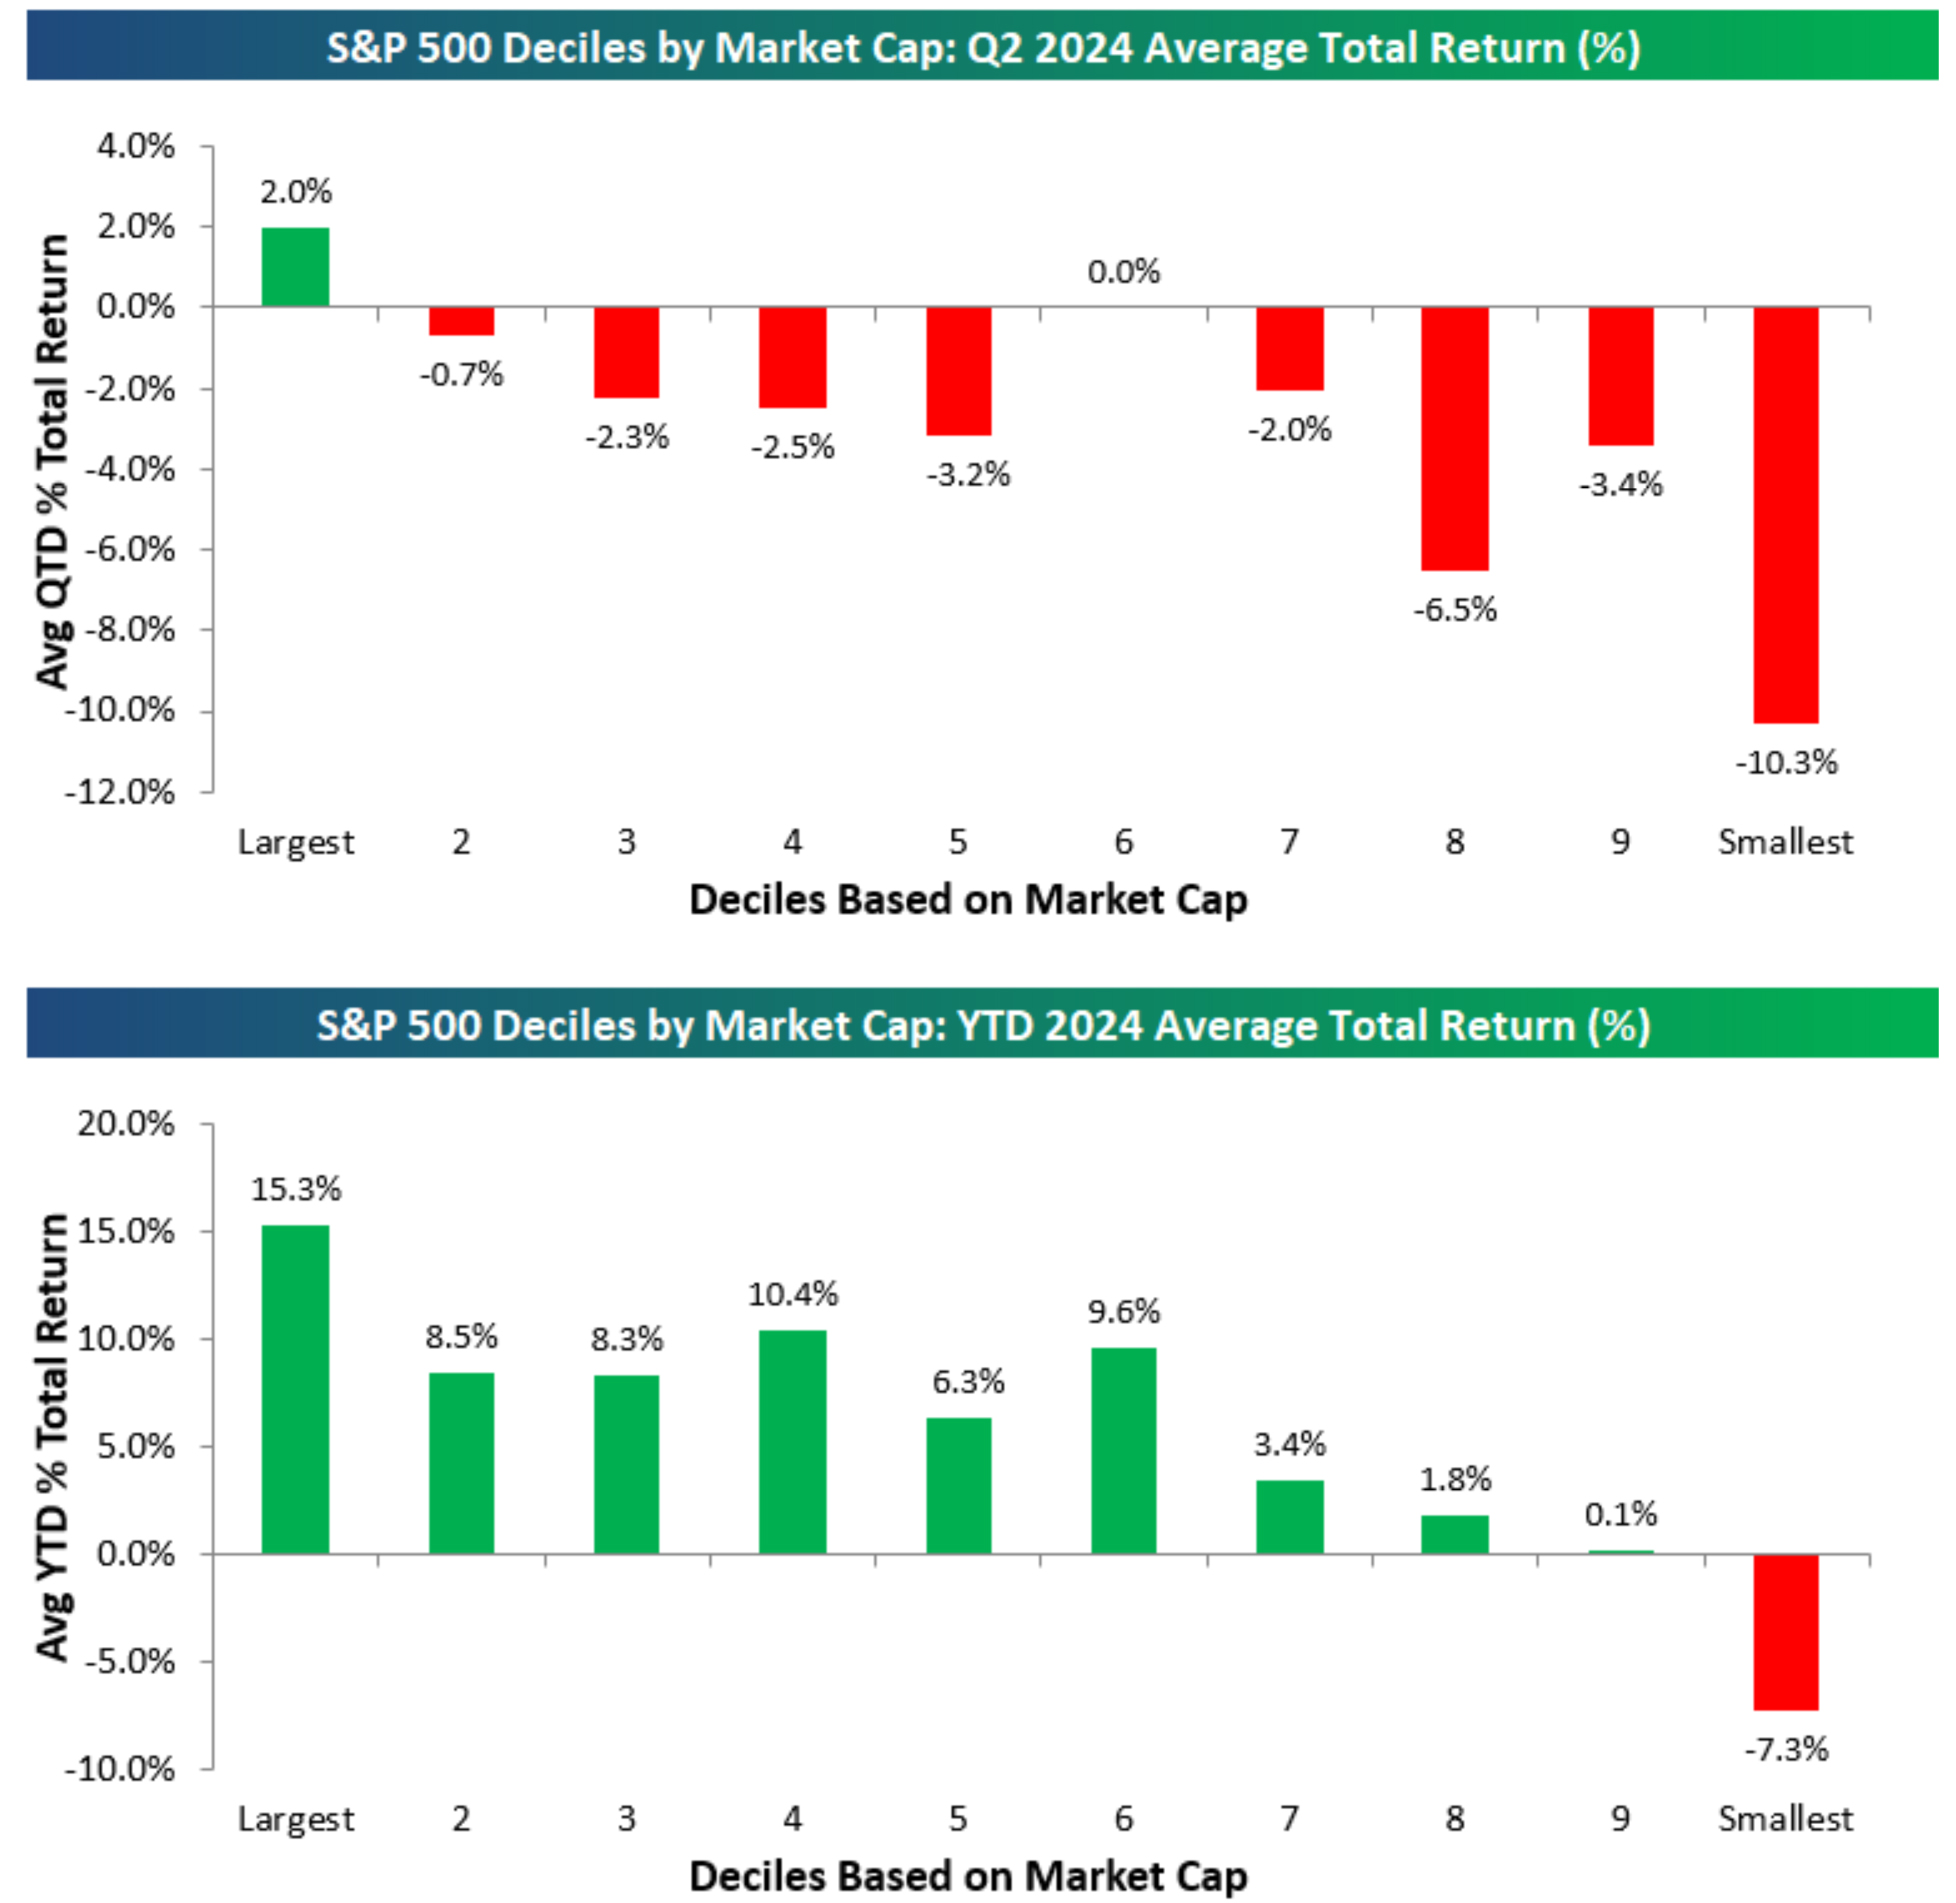
(Bespoke Investment Group)
Graphs are for illustrative and discussion purposes only. Please read important disclosures at the end of this commentary.
Interestingly, despite this Bespoke report, our small- to mid-capitalization stocks performed exceptionally well in May and so far in June. Due to the annual Russell realignment, as well as quarter-end window dressing, I expect that my small to mid-cap stocks will continue to perform well in the upcoming weeks.
Over the next two weeks, Russell will refine its proposed changes to their indices. Small and mid-cap stocks added to the Russell indices on June 24 are typically the biggest winners. After this annual Russell realignment, quarter-end window dressing is expected to boost many of our fundamentally superior stocks as many institutional investors make their portfolio look “extra pretty” in their quarter-end reviews.
As for the best of the big-cap stocks, Nvidia, in the wake of its 10-for-1 stock split, is expected to pass Microsoft in total market capitalization to become the largest public company. In the upcoming months, I expect Nvidia to blow through $4 trillion in market capitalization and eventually hit $5 trillion in market capitalization next year, when it announces the successor to its Blackwell chips that it is now rolling out.
The recent news that the Justice Department and Federal Trade Commission have struck a deal over how to proceed with antitrust investigations into Nvidia, Microsoft and OpenAI are not expected to derail the AI revolution and The Wall Street Journal said these investigations “may ultimately come to nothing.”
The simple fact of the matter is that since Nvidia spent over $2 billion to develop its next generation generative AI chips, competing with Nvidia has become increasingly futile. In fact, all the other AI chips under development are increasingly low-tech chip solutions, not the deep learning, generative AI chips that Nvidia makes. As a result, Nvidia is leading the entire stock market and, as Bloomberg TV recently said, the Magnificent Seven in the S&P 500 has become “the Magnificent One, and 499 other stocks.”
As for those other 499 stocks, pardon me for talking like a “math geek” for a minute, but if you ignore Nvidia and look at those other 499 stocks in the S&P 500, they are increasingly impacted by “mean reversion” trading algorithms that Citadel implements after each earnings announcement season ends. These algorithms hit overbought stocks that trade based on a non-linear neural algorithm that becomes unwound as volatility increases. Former algorithmic traders that I have questioned reluctantly hint that these mean reversion algorithms typically last 10-12 trading days, depending on how volatility increases.
For the record, I am a “linear” math guy, since my quantitative and fundamental analysis is done on a trailing 52-week basis, although we also run quantitative rankings on a 270-day, 120-day, 90-day, 60-day and 30-day basis. The neural algorithm folks like to brag that they are not burdened by any fixed time cycle and that their neural algorithms “naturally adapt.” I do not mean to burden you with too much math jargon, but in the end, these mean reversion neural algorithms just hit overbought stocks as they back and fill and digest their recent gains. Conversely, these mean reversion neural algorithms can be used to artificially “pump up” oversold stocks. As trading volume dries up, however, these mean reversion neural algorithms typically run for cover, since without trading volume, no algorithm can keep working.
So that is your crash course in algorithm trading. The key point to remember is that the stock market tends to be efficiently traded during each quarterly announcement season. But after earnings season winds down, these algorithmic games begin and markets become much less efficient as overbought winning stocks are hit with profit-taking and oversold stocks firm up as adaptive trading algorithms run wild.
In short, there are four months each year when stocks are efficiently traded (in earnings announcement seasons) and there are eight months of inefficient trading, when adaptive trading algorithms run wild! But if you hold on through the two month gap between earnings, you should be rewarded during earnings season!
Navellier & Associates owns Nvidia Corp (NVDA), Microsoft (MSFT), and a few accounts own Tesla (TSLA), per client request in managed accounts. Louis Navellier and his family own Nvidia Corp (NVDA), and Microsoft (MSFT), via a Navellier managed account, and Nvidia Corp (NVDA), in a personal account. He does not own Tesla (TSLA), personally.
All content above represents the opinion of Louis Navellier of Navellier & Associates, Inc.
Also In This Issue
A Look Ahead by Louis Navellier
Powell Needs to Face Reality – and Take Control
Income Mail by Bryan Perry
The Market Just Got Real Simple, Real Fast, For Most Investors
Growth Mail by Gary Alexander
The Data-Dependent Fed Relies on Deceptive Data to Meet its Misleading Mandates
Global Mail by Ivan Martchev
Beware the Franco-German Spread
Sector Spotlight by Jason Bodner
While in Europe, I Take a Closer Look at Travel & Leisure Stocks
View Full Archive
Read Past Issues Here

Louis Navellier
CHIEF INVESTMENT OFFICER
Louis Navellier is Founder, Chairman of the Board, Chief Investment Officer and Chief Compliance Officer of Navellier & Associates, Inc., located in Reno, Nevada. With decades of experience translating what had been purely academic techniques into real market applications, he believes that disciplined, quantitative analysis can select stocks that will significantly outperform the overall market. All content in this “A Look Ahead” section of Market Mail represents the opinion of Louis Navellier of Navellier & Associates, Inc.
Important Disclosures:
Although information in these reports has been obtained from and is based upon sources that Navellier believes to be reliable, Navellier does not guarantee its accuracy and it may be incomplete or condensed. All opinions and estimates constitute Navellier’s judgment as of the date the report was created and are subject to change without notice. These reports are for informational purposes only and are not a solicitation for the purchase or sale of a security. Any decision to purchase securities mentioned in these reports must take into account existing public information on such securities or any registered prospectus.To the extent permitted by law, neither Navellier & Associates, Inc., nor any of its affiliates, agents, or service providers assumes any liability or responsibility nor owes any duty of care for any consequences of any person acting or refraining to act in reliance on the information contained in this communication or for any decision based on it.
Past performance is no indication of future results. Investment in securities involves significant risk and has the potential for partial or complete loss of funds invested. It should not be assumed that any securities recommendations made by Navellier. in the future will be profitable or equal the performance of securities made in this report. Dividend payments are not guaranteed. The amount of a dividend payment, if any, can vary over time and issuers may reduce dividends paid on securities in the event of a recession or adverse event affecting a specific industry or issuer.
None of the stock information, data, and company information presented herein constitutes a recommendation by Navellier or a solicitation to buy or sell any securities. Any specific securities identified and described do not represent all of the securities purchased, sold, or recommended for advisory clients. The holdings identified do not represent all of the securities purchased, sold, or recommended for advisory clients and the reader should not assume that investments in the securities identified and discussed were or will be profitable.
Information presented is general information that does not take into account your individual circumstances, financial situation, or needs, nor does it present a personalized recommendation to you. Individual stocks presented may not be suitable for every investor. Investment in securities involves significant risk and has the potential for partial or complete loss of funds invested. Investment in fixed income securities has the potential for the investment return and principal value of an investment to fluctuate so that an investor’s holdings, when redeemed, may be worth less than their original cost.
One cannot invest directly in an index. Index is unmanaged and index performance does not reflect deduction of fees, expenses, or taxes. Presentation of Index data does not reflect a belief by Navellier that any stock index constitutes an investment alternative to any Navellier equity strategy or is necessarily comparable to such strategies. Among the most important differences between the Indices and Navellier strategies are that the Navellier equity strategies may (1) incur material management fees, (2) concentrate its investments in relatively few stocks, industries, or sectors, (3) have significantly greater trading activity and related costs, and (4) be significantly more or less volatile than the Indices.
ETF Risk: We may invest in exchange traded funds (“ETFs”) and some of our investment strategies are generally fully invested in ETFs. Like traditional mutual funds, ETFs charge asset-based fees, but they generally do not charge initial sales charges or redemption fees and investors typically pay only customary brokerage fees to buy and sell ETF shares. The fees and costs charged by ETFs held in client accounts will not be deducted from the compensation the client pays Navellier. ETF prices can fluctuate up or down, and a client account could lose money investing in an ETF if the prices of the securities owned by the ETF go down. ETFs are subject to additional risks:
- ETF shares may trade above or below their net asset value;
- An active trading market for an ETF’s shares may not develop or be maintained;
- The value of an ETF may be more volatile than the underlying portfolio of securities the ETF is designed to track;
- The cost of owning shares of the ETF may exceed those a client would incur by directly investing in the underlying securities; and
- Trading of an ETF’s shares may be halted if the listing exchange’s officials deem it appropriate, the shares are delisted from the exchange, or the activation of market-wide “circuit breakers” (which are tied to large decreases in stock prices) halts stock trading generally.
Grader Disclosures: Investment in equity strategies involves substantial risk and has the potential for partial or complete loss of funds invested. The sample portfolio and any accompanying charts are for informational purposes only and are not to be construed as a solicitation to buy or sell any financial instrument and should not be relied upon as the sole factor in an investment making decision. As a matter of normal and important disclosures to you, as a potential investor, please consider the following: The performance presented is not based on any actual securities trading, portfolio, or accounts, and the reported performance of the A, B, C, D, and F portfolios (collectively the “model portfolios”) should be considered mere “paper” or pro forma performance results based on Navellier’s research.
Investors evaluating any of Navellier & Associates, Inc.’s, (or its affiliates’) Investment Products must not use any information presented here, including the performance figures of the model portfolios, in their evaluation of any Navellier Investment Products. Navellier Investment Products include the firm’s mutual funds and managed accounts. The model portfolios, charts, and other information presented do not represent actual funded trades and are not actual funded portfolios. There are material differences between Navellier Investment Products’ portfolios and the model portfolios, research, and performance figures presented here. The model portfolios and the research results (1) may contain stocks or ETFs that are illiquid and difficult to trade; (2) may contain stock or ETF holdings materially different from actual funded Navellier Investment Product portfolios; (3) include the reinvestment of all dividends and other earnings, estimated trading costs, commissions, or management fees; and, (4) may not reflect prices obtained in an actual funded Navellier Investment Product portfolio. For these and other reasons, the reported performances of model portfolios do not reflect the performance results of Navellier’s actually funded and traded Investment Products. In most cases, Navellier’s Investment Products have materially lower performance results than the performances of the model portfolios presented.
This report contains statements that are, or may be considered to be, forward-looking statements. All statements that are not historical facts, including statements about our beliefs or expectations, are “forward-looking statements” within the meaning of The U.S. Private Securities Litigation Reform Act of 1995. These statements may be identified by such forward-looking terminology as “expect,” “estimate,” “plan,” “intend,” “believe,” “anticipate,” “may,” “will,” “should,” “could,” “continue,” “project,” or similar statements or variations of such terms. Our forward-looking statements are based on a series of expectations, assumptions, and projections, are not guarantees of future results or performance, and involve substantial risks and uncertainty as described in Form ADV Part 2A of our filing with the Securities and Exchange Commission (SEC), which is available at www.adviserinfo.sec.gov or by requesting a copy by emailing info@navellier.com. All of our forward-looking statements are as of the date of this report only. We can give no assurance that such expectations or forward-looking statements will prove to be correct. Actual results may differ materially. You are urged to carefully consider all such factors.
FEDERAL TAX ADVICE DISCLAIMER: As required by U.S. Treasury Regulations, you are informed that, to the extent this presentation includes any federal tax advice, the presentation is not written by Navellier to be used, and cannot be used, for the purpose of avoiding federal tax penalties. Navellier does not advise on any income tax requirements or issues. Use of any information presented by Navellier is for general information only and does not represent tax advice either express or implied. You are encouraged to seek professional tax advice for income tax questions and assistance.
IMPORTANT NEWSLETTER DISCLOSURE:The hypothetical performance results for investment newsletters that are authored or edited by Louis Navellier, including Louis Navellier’s Growth Investor, Louis Navellier’s Breakthrough Stocks, Louis Navellier’s Accelerated Profits, and Louis Navellier’s Platinum Club, are not based on any actual securities trading, portfolio, or accounts, and the newsletters’ reported hypothetical performances should be considered mere “paper” or proforma hypothetical performance results and are not actual performance of real world trades. Navellier & Associates, Inc. does not have any relation to or affiliation with the owner of these newsletters. There are material differences between Navellier Investment Products’ portfolios and the InvestorPlace Media, LLC newsletter portfolios authored by Louis Navellier. The InvestorPlace Media, LLC newsletters contain hypothetical performance that do not include transaction costs, advisory fees, or other fees a client might incur if actual investments and trades were being made by an investor. As a result, newsletter performance should not be used to evaluate Navellier Investment services which are separate and different from the newsletters. The owner of the newsletters is InvestorPlace Media, LLC and any questions concerning the newsletters, including any newsletter advertising or hypothetical Newsletter performance claims, (which are calculated solely by Investor Place Media and not Navellier) should be referred to InvestorPlace Media, LLC at (800) 718-8289.
Please note that Navellier & Associates and the Navellier Private Client Group are managed completely independent of the newsletters owned and published by InvestorPlace Media, LLC and written and edited by Louis Navellier, and investment performance of the newsletters should in no way be considered indicative of potential future investment performance for any Navellier & Associates separately managed account portfolio. Potential investors should consult with their financial advisor before investing in any Navellier Investment Product.
Navellier claims compliance with Global Investment Performance Standards (GIPS). To receive a complete list and descriptions of Navellier’s composites and/or a presentation that adheres to the GIPS standards, please contact Navellier or click here. It should not be assumed that any securities recommendations made by Navellier & Associates, Inc. in the future will be profitable or equal the performance of securities made in this report.
FactSet Disclosure: Navellier does not independently calculate the statistical information included in the attached report. The calculation and the information are provided by FactSet, a company not related to Navellier. Although information contained in the report has been obtained from FactSet and is based on sources Navellier believes to be reliable, Navellier does not guarantee its accuracy, and it may be incomplete or condensed. The report and the related FactSet sourced information are provided on an “as is” basis. The user assumes the entire risk of any use made of this information. Investors should consider the report as only a single factor in making their investment decision. The report is for informational purposes only and is not intended as an offer or solicitation for the purchase or sale of a security. FactSet sourced information is the exclusive property of FactSet. Without prior written permission of FactSet, this information may not be reproduced, disseminated or used to create any financial products. All indices are unmanaged and performance of the indices include reinvestment of dividends and interest income, unless otherwise noted, are not illustrative of any particular investment and an investment cannot be made in any index. Past performance is no guarantee of future results.