by Bryan Perry
June 11, 2024
Last Friday, the U.S. Treasury market took it on the chin following the release of the May jobs report data showing that the economy added 272,000 jobs, versus a consensus expectation of 185,000.
The market’s response was an immediate jump in yields. The yield on the 10-year Treasury note settled 15 basis-points higher on the day and eight basis-points lower on the week, to 4.43%. The two-year note yield jumped 15 basis-points, which left it two basis-points lower for the week, ending at 4.87%.
The message to investors is pretty clear: Don’t expect a rate cut in July or maybe even September. The latest CME FedWatch Tool shows a nearly 92% probability of the Fed holding the Fed funds rate at 5.25%-5.50% at the July 31 Federal Open Market Committee (FOMC) meeting. This is up from a 65% probability just one month ago, thereby underscoring the Fed’s “higher for longer” narrative.
The upshot from the Friday jobs report is that good news for the labor market is typically good news for the economy and organic growth for small to medium-sized businesses. But accessing capital to expand one’s business is more costly in today’s lending rate environment, which is a headwind to borrowers, but a major tailwind to lenders, providing easy access to capital. With regional and community banks saddled with billions of dollars in low-yield Treasuries that are trading at deep discounts to par value, plus too much exposure to corporate office properties with high vacancy rates, and more stringent lending standards brought on the by the regional bank collapse of 2023, companies are turning to Business Development Companies (BDCs) to meet their capital needs for borrowing at today’s lofty rates.
For those unfamiliar with the BDC structure, they are a type of closed-end fund that invests in small-to-medium-sized companies, helping firms grow in the initial stages of their development. Many BDCs are public companies whose shares trade on the major stock exchanges.
In light of what Louis Navellier has said about Private Credit Funds, it’s important to note that there is a clear distinction between BDCs and Private Credit Funds that deploy up to 200% leverage to finance a great deal of M&A activity. A majority of Private Credit Funds require investors to hold their money in the funds for 5-10 years, making for a non-liquid investment. The total U.S. fixed income market is valued at around $55 trillion with only about $2 trillion dedicated to the private credit market, of which roughly $545 billion is in dry powder looking for deals; so while there are isolated situations where too much leverage can create risk, such exposure relative to the entire fixed income market I believe is not that high.
The exchange-traded BDC market is currently valued at $156 billion, spread among 79 BDCs with the ability to buy and sell shares. The average BDC has a debt-to-equity ratio of 1.1%, which reflects almost no use of leverage. Like Private Credit Funds, BDCs finance non-listed companies that include liquidity risk. Hence, the higher yield is intended to compensate investors for the risk of an adverse liquidity event.
BDCs are also similar to REITs in that they are Regulated Investment Companies (RICs) and, as such, are required to pass through at least 90% of their earned income to shareholders to avoid paying corporate income taxes. The BDC must be a domestic company and invest at least 70% of its assets in private or public U.S. firms with market values of less than $250 million. There are a few ways BDCs make capital available to private businesses – through the purchase of equity in the companies, issuing a convertible bond, structuring loans or some combination of these. In today’s market, BDCs are heavily weighted in floating-rate loans within their portfolios that adjust to higher rates when short-term rates rise.
The 11 rate hikes the Fed has made from 2022 to 2023 made the BDC business very lucrative, with the top BDC portfolio compositions invested at least 90% in floating rate debt issues tied to Fed Funds, or the Secured Overnight Financing Rate (SOFR), which replaced the London Interbank Offered Rate (LIBOR) in 2023. As of June 6, the SOFR rate stands at 5.33%. Loans issued by BDCs will be crafted as SOFR plus 6%, for example, making the cost of interest to the borrower over 11%.
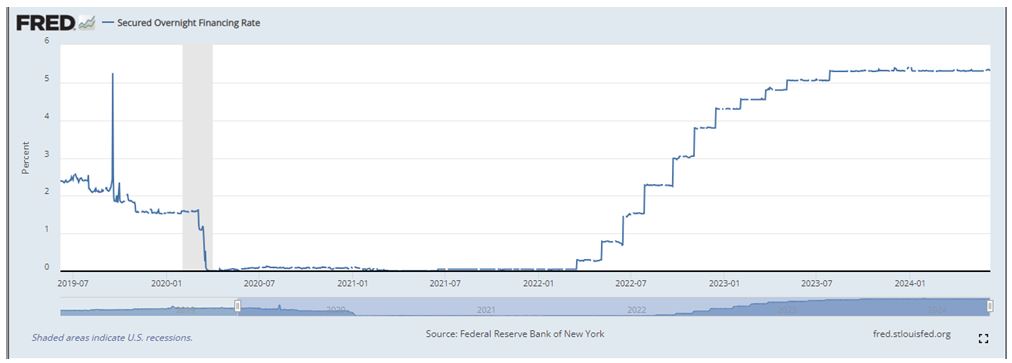
Graphs are for illustrative and discussion purposes only. Please read important disclosures at the end of this commentary.
It is not uncommon for lending rates from BDCs to exceed 13% when one considers they are investing primarily in private illiquid companies. Therefore, investors are on the receiving end of juicy dividend yields range from 8% to 14% annually. The number of portfolio companies invested in by BDCs varies from under 20 to over 100, depending on the BDC’s strategy. One way to diversify the risk for investing in BDCs is to consider an ETF such as the Van Eck BDC Income ETF (BIZD), which owns several of the biggest BDCs by assets under management (AUM).
The 30-day SEC yield for BIZD is 10.03%, and it pays out a quarterly dividend. Several BDCs have implemented monthly payouts – a highly attractive feature to income investors. Because of the squeeze on lending by banks, the demand for capital by private businesses and the Fed’s tighter monetary policy that is showing fresh signs of staying at current higher levels, business conditions for BDCs are downright bullish. The chart of BIZD is similar to that of its holdings – up and to the right.
All content above represents the opinion of Bryan Perry of Navellier & Associates, Inc.
Also In This Issue
A Look Ahead by Louis Navellier
Overseas Rate Cuts Could Help Lower U.S. Yields This Summer
Income Mail by Bryan Perry
Non-Leveraged High Yield Asset Class Pays Double-Digit Yields
Growth Mail by Gary Alexander
High Tech Stocks Can Create (or Crater) Fortunes
Global Mail by Ivan Martchev
Fresh All Time Highs, Now What?
Sector Spotlight by Jason Bodner
Why Do You Invest? To Hoard Wealth, or Spend It?
View Full Archive
Read Past Issues Here

Bryan Perry
SENIOR DIRECTOR
Bryan Perry is a Senior Director with Navellier Private Client Group, advising and facilitating high net worth investors in the pursuit of their financial goals.
Bryan’s financial services career spanning the past three decades includes over 20 years of wealth management experience with Wall Street firms that include Bear Stearns, Lehman Brothers and Paine Webber, working with both retail and institutional clients. Bryan earned a B.A. in Political Science from Virginia Polytechnic Institute & State University and currently holds a Series 65 license. All content of “Income Mail” represents the opinion of Bryan Perry
Important Disclosures:
Although information in these reports has been obtained from and is based upon sources that Navellier believes to be reliable, Navellier does not guarantee its accuracy and it may be incomplete or condensed. All opinions and estimates constitute Navellier’s judgment as of the date the report was created and are subject to change without notice. These reports are for informational purposes only and are not a solicitation for the purchase or sale of a security. Any decision to purchase securities mentioned in these reports must take into account existing public information on such securities or any registered prospectus.To the extent permitted by law, neither Navellier & Associates, Inc., nor any of its affiliates, agents, or service providers assumes any liability or responsibility nor owes any duty of care for any consequences of any person acting or refraining to act in reliance on the information contained in this communication or for any decision based on it.
Past performance is no indication of future results. Investment in securities involves significant risk and has the potential for partial or complete loss of funds invested. It should not be assumed that any securities recommendations made by Navellier. in the future will be profitable or equal the performance of securities made in this report. Dividend payments are not guaranteed. The amount of a dividend payment, if any, can vary over time and issuers may reduce dividends paid on securities in the event of a recession or adverse event affecting a specific industry or issuer.
None of the stock information, data, and company information presented herein constitutes a recommendation by Navellier or a solicitation to buy or sell any securities. Any specific securities identified and described do not represent all of the securities purchased, sold, or recommended for advisory clients. The holdings identified do not represent all of the securities purchased, sold, or recommended for advisory clients and the reader should not assume that investments in the securities identified and discussed were or will be profitable.
Information presented is general information that does not take into account your individual circumstances, financial situation, or needs, nor does it present a personalized recommendation to you. Individual stocks presented may not be suitable for every investor. Investment in securities involves significant risk and has the potential for partial or complete loss of funds invested. Investment in fixed income securities has the potential for the investment return and principal value of an investment to fluctuate so that an investor’s holdings, when redeemed, may be worth less than their original cost.
One cannot invest directly in an index. Index is unmanaged and index performance does not reflect deduction of fees, expenses, or taxes. Presentation of Index data does not reflect a belief by Navellier that any stock index constitutes an investment alternative to any Navellier equity strategy or is necessarily comparable to such strategies. Among the most important differences between the Indices and Navellier strategies are that the Navellier equity strategies may (1) incur material management fees, (2) concentrate its investments in relatively few stocks, industries, or sectors, (3) have significantly greater trading activity and related costs, and (4) be significantly more or less volatile than the Indices.
ETF Risk: We may invest in exchange traded funds (“ETFs”) and some of our investment strategies are generally fully invested in ETFs. Like traditional mutual funds, ETFs charge asset-based fees, but they generally do not charge initial sales charges or redemption fees and investors typically pay only customary brokerage fees to buy and sell ETF shares. The fees and costs charged by ETFs held in client accounts will not be deducted from the compensation the client pays Navellier. ETF prices can fluctuate up or down, and a client account could lose money investing in an ETF if the prices of the securities owned by the ETF go down. ETFs are subject to additional risks:
- ETF shares may trade above or below their net asset value;
- An active trading market for an ETF’s shares may not develop or be maintained;
- The value of an ETF may be more volatile than the underlying portfolio of securities the ETF is designed to track;
- The cost of owning shares of the ETF may exceed those a client would incur by directly investing in the underlying securities; and
- Trading of an ETF’s shares may be halted if the listing exchange’s officials deem it appropriate, the shares are delisted from the exchange, or the activation of market-wide “circuit breakers” (which are tied to large decreases in stock prices) halts stock trading generally.
Grader Disclosures: Investment in equity strategies involves substantial risk and has the potential for partial or complete loss of funds invested. The sample portfolio and any accompanying charts are for informational purposes only and are not to be construed as a solicitation to buy or sell any financial instrument and should not be relied upon as the sole factor in an investment making decision. As a matter of normal and important disclosures to you, as a potential investor, please consider the following: The performance presented is not based on any actual securities trading, portfolio, or accounts, and the reported performance of the A, B, C, D, and F portfolios (collectively the “model portfolios”) should be considered mere “paper” or pro forma performance results based on Navellier’s research.
Investors evaluating any of Navellier & Associates, Inc.’s, (or its affiliates’) Investment Products must not use any information presented here, including the performance figures of the model portfolios, in their evaluation of any Navellier Investment Products. Navellier Investment Products include the firm’s mutual funds and managed accounts. The model portfolios, charts, and other information presented do not represent actual funded trades and are not actual funded portfolios. There are material differences between Navellier Investment Products’ portfolios and the model portfolios, research, and performance figures presented here. The model portfolios and the research results (1) may contain stocks or ETFs that are illiquid and difficult to trade; (2) may contain stock or ETF holdings materially different from actual funded Navellier Investment Product portfolios; (3) include the reinvestment of all dividends and other earnings, estimated trading costs, commissions, or management fees; and, (4) may not reflect prices obtained in an actual funded Navellier Investment Product portfolio. For these and other reasons, the reported performances of model portfolios do not reflect the performance results of Navellier’s actually funded and traded Investment Products. In most cases, Navellier’s Investment Products have materially lower performance results than the performances of the model portfolios presented.
This report contains statements that are, or may be considered to be, forward-looking statements. All statements that are not historical facts, including statements about our beliefs or expectations, are “forward-looking statements” within the meaning of The U.S. Private Securities Litigation Reform Act of 1995. These statements may be identified by such forward-looking terminology as “expect,” “estimate,” “plan,” “intend,” “believe,” “anticipate,” “may,” “will,” “should,” “could,” “continue,” “project,” or similar statements or variations of such terms. Our forward-looking statements are based on a series of expectations, assumptions, and projections, are not guarantees of future results or performance, and involve substantial risks and uncertainty as described in Form ADV Part 2A of our filing with the Securities and Exchange Commission (SEC), which is available at www.adviserinfo.sec.gov or by requesting a copy by emailing info@navellier.com. All of our forward-looking statements are as of the date of this report only. We can give no assurance that such expectations or forward-looking statements will prove to be correct. Actual results may differ materially. You are urged to carefully consider all such factors.
FEDERAL TAX ADVICE DISCLAIMER: As required by U.S. Treasury Regulations, you are informed that, to the extent this presentation includes any federal tax advice, the presentation is not written by Navellier to be used, and cannot be used, for the purpose of avoiding federal tax penalties. Navellier does not advise on any income tax requirements or issues. Use of any information presented by Navellier is for general information only and does not represent tax advice either express or implied. You are encouraged to seek professional tax advice for income tax questions and assistance.
IMPORTANT NEWSLETTER DISCLOSURE:The hypothetical performance results for investment newsletters that are authored or edited by Louis Navellier, including Louis Navellier’s Growth Investor, Louis Navellier’s Breakthrough Stocks, Louis Navellier’s Accelerated Profits, and Louis Navellier’s Platinum Club, are not based on any actual securities trading, portfolio, or accounts, and the newsletters’ reported hypothetical performances should be considered mere “paper” or proforma hypothetical performance results and are not actual performance of real world trades. Navellier & Associates, Inc. does not have any relation to or affiliation with the owner of these newsletters. There are material differences between Navellier Investment Products’ portfolios and the InvestorPlace Media, LLC newsletter portfolios authored by Louis Navellier. The InvestorPlace Media, LLC newsletters contain hypothetical performance that do not include transaction costs, advisory fees, or other fees a client might incur if actual investments and trades were being made by an investor. As a result, newsletter performance should not be used to evaluate Navellier Investment services which are separate and different from the newsletters. The owner of the newsletters is InvestorPlace Media, LLC and any questions concerning the newsletters, including any newsletter advertising or hypothetical Newsletter performance claims, (which are calculated solely by Investor Place Media and not Navellier) should be referred to InvestorPlace Media, LLC at (800) 718-8289.
Please note that Navellier & Associates and the Navellier Private Client Group are managed completely independent of the newsletters owned and published by InvestorPlace Media, LLC and written and edited by Louis Navellier, and investment performance of the newsletters should in no way be considered indicative of potential future investment performance for any Navellier & Associates separately managed account portfolio. Potential investors should consult with their financial advisor before investing in any Navellier Investment Product.
Navellier claims compliance with Global Investment Performance Standards (GIPS). To receive a complete list and descriptions of Navellier’s composites and/or a presentation that adheres to the GIPS standards, please contact Navellier or click here. It should not be assumed that any securities recommendations made by Navellier & Associates, Inc. in the future will be profitable or equal the performance of securities made in this report.
FactSet Disclosure: Navellier does not independently calculate the statistical information included in the attached report. The calculation and the information are provided by FactSet, a company not related to Navellier. Although information contained in the report has been obtained from FactSet and is based on sources Navellier believes to be reliable, Navellier does not guarantee its accuracy, and it may be incomplete or condensed. The report and the related FactSet sourced information are provided on an “as is” basis. The user assumes the entire risk of any use made of this information. Investors should consider the report as only a single factor in making their investment decision. The report is for informational purposes only and is not intended as an offer or solicitation for the purchase or sale of a security. FactSet sourced information is the exclusive property of FactSet. Without prior written permission of FactSet, this information may not be reproduced, disseminated or used to create any financial products. All indices are unmanaged and performance of the indices include reinvestment of dividends and interest income, unless otherwise noted, are not illustrative of any particular investment and an investment cannot be made in any index. Past performance is no guarantee of future results.