by Jason Bodner
May 21, 2024
As a kid, I would sometimes get mad at my mom for not letting me slide a little. If I came up short, she wouldn’t let it go. If I got a “C” on something she knew I could ace, I got skewered. Instead, I wanted sympathy and an excuse for coasting. Instead, I was pushed to be the best I could be. Lessons like that are essential to unlock true potential, she said. Contentment with status-quo results in being average.
Sports often show the reward for pursuing that extra edge of excellence. Kobe Bryant embodied it with his “Mamba Mentality.” He only wanted to be better than the day before. He said, “After years of that, you unveil the masterpiece.” Kobe stepped up when it really mattered. Consider that only two players had more playoff points than Kobe’s 5,640 when he retired, Michael Jordan and Kareem Abdul-Jabbar.
In this election year, we have a great opportunity. But it’s not as simple as just “buy stocks.” I’ll show you the nature of this opportunity. Then I will show you the value of focusing on the best stocks.
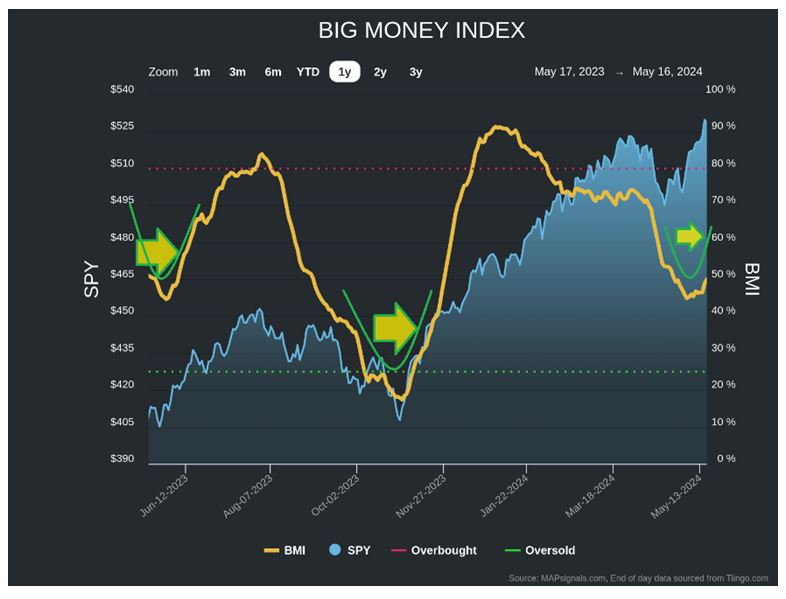
I always check the Big Money Index (BMI) first. It’s our indicator of money flows. Ultimately, money makes the world go around. After a cool April, the cup formation is just about complete. In the chart below, we see two prior instances in the last year when the BMI fell and then quickly reversed back up:
Graphs are for illustrative and discussion purposes only. Please read important disclosures at the end of this commentary.
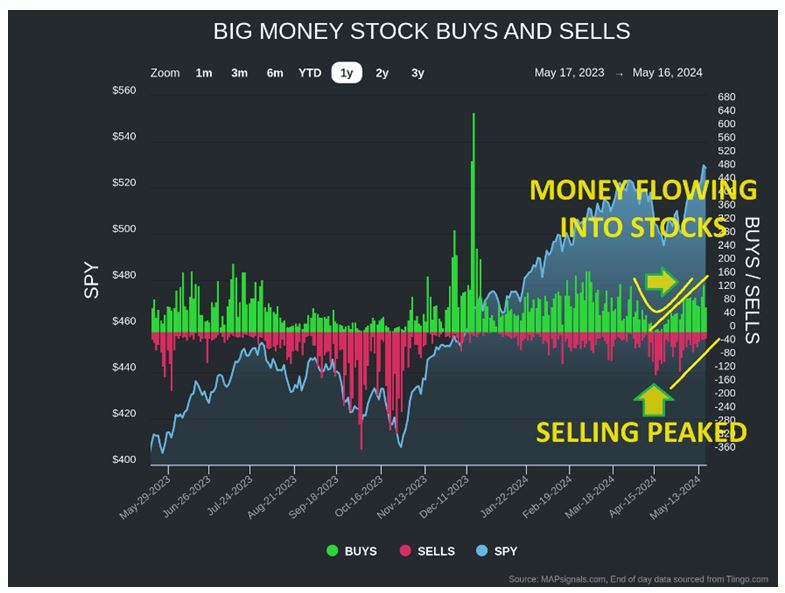
On the surface, that looks great, but the BMI is propelled by daily counts of unusual buying or selling in stocks. That’s where we must look to see if the tides have shifted. We see a similar “V” showing how selling peaked, then vanished, replaced by steady buying. These are meaningful inflows:
Graphs are for illustrative and discussion purposes only. Please read important disclosures at the end of this commentary.
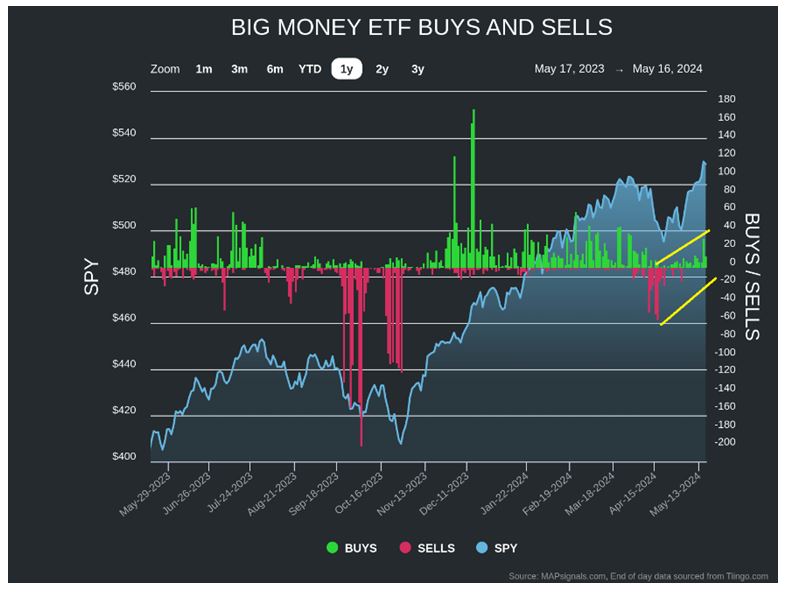
ETFs are great confirmation tools, as many of them are portfolios of stocks. Money managers buying ETFs filled with stocks means risk appetite is rising. Sure enough, we see ETF inflows too:
Graphs are for illustrative and discussion purposes only. Please read important disclosures at the end of this commentary.
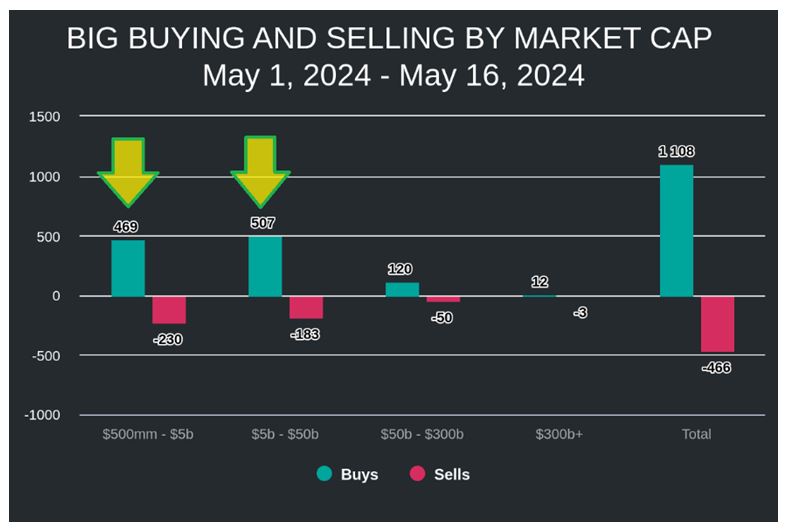
Now that we know money is moving in, let’s see where it’s moving in. Investors have been buying small and mid-caps. We see that in the distribution of buying:
Graphs are for illustrative and discussion purposes only. Please read important disclosures at the end of this commentary.
So, money is flowing into small- and mid-caps, but which sectors are seeing inflows?
The short answer is – most of them.
Looking at sector ranks there is something strange happening. The top three are Financials, Utilities, and Energy. Health Care and Real Estate are near the bottom. I prefer to see Technology and Discretionary leading bull markets. They are great barometers of a healthy consumer economy but are middle of the pack now:
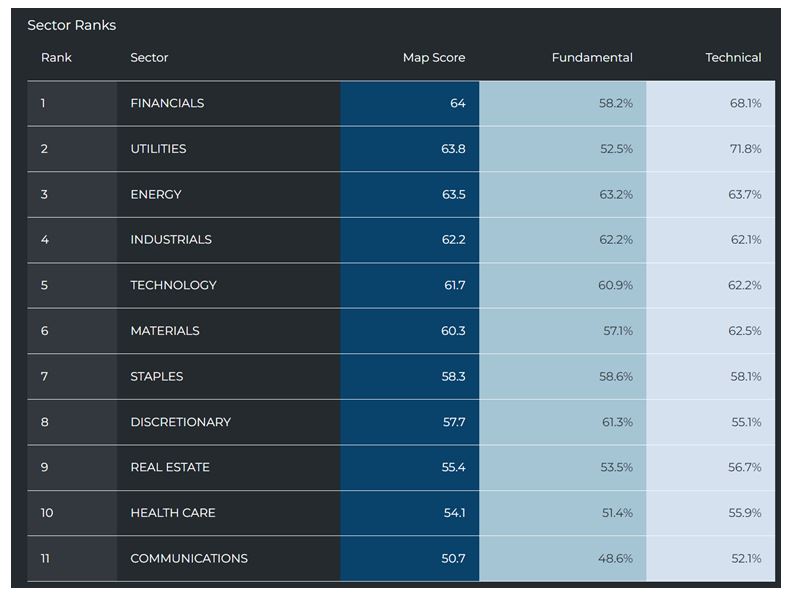
Graphs are for illustrative and discussion purposes only. Please read important disclosures at the end of this commentary.
When we look at charts of unusual buying/selling broken down by sector, we see something glorious! Inflows are mostly rising in each sector:
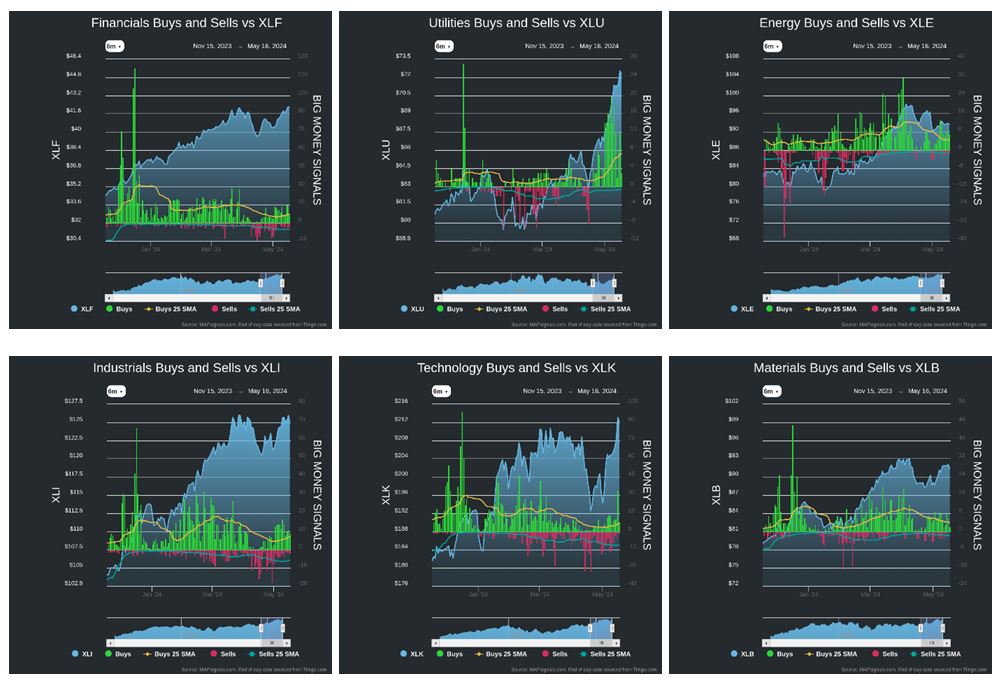
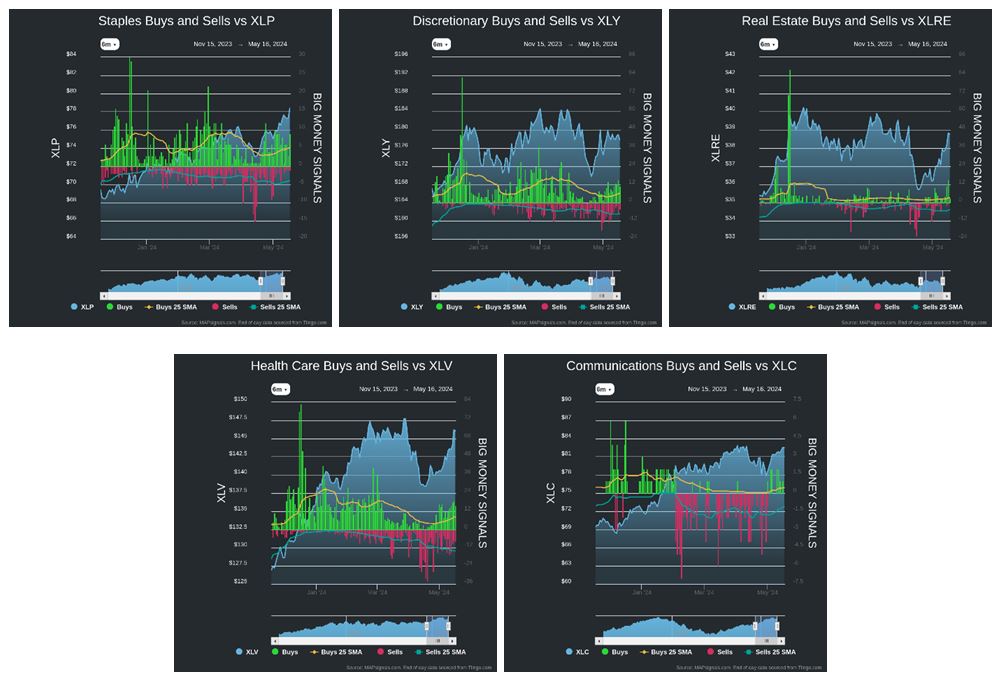
Graphs are for illustrative and discussion purposes only. Please read important disclosures at the end of this commentary.
We see strong buying in Utilities, and constructive inflows in Financials, Energy, Industrials, Technology, Materials, Staples, Discretionary, Real Estate, and Health Care.
Utilities look like the clear anomaly. The sector has risen so fast and buying has become unsustainable. That doesn’t mean it can’t continue, but if there is one sector poised for reversion soon – it’s Utes.
Real Estate is an interesting value opportunity. When rates come down, demand for high-yield stocks will rise. REITs are legally required to pay out 75% to 90% of profits in the form of dividends.
Now you have a target shopping list: small and mid-caps in most sectors… sounds good!
You could just go buy stocks, but, as mentioned, it’s not that simple, unless you want to be the best. If you want solid performance, just buy IWM – the Russell 2000 tracking ETF for small caps, and buy SPY, the S&P 500 tracking ETF for broad based exposure. History and Warren Buffett say you’ll do fine. History and stats also say that money managers won’t necessarily do much better.
According to a 2023 report from S&P Dow Jones Indices, fewer than 10% of actively managed U.S. stock funds have managed to beat the index over a 20-year period ending in 2023. A 2023 Visual Capitalist study also found that 95% of large-cap actively managed funds have under-performed their benchmark over the past 20 years. But…. I think we can beat the market… in fact I know we can.
Here’s where the Mamba Mentality (and my mother’s training) matters. My research ranks thousands of stocks each day in terms of fundamental and technical strength. We then look for when the strongest stocks see unusual money inflows. That becomes a weekly list of the 20 highest ranked stocks seeing unusual inflows. This is where we have found historical out-performance.
This being an election year, I wanted to see how the top 20s from May performed vs, the S&P 500 in prior election years, starting in 1992. Here’s what I found:
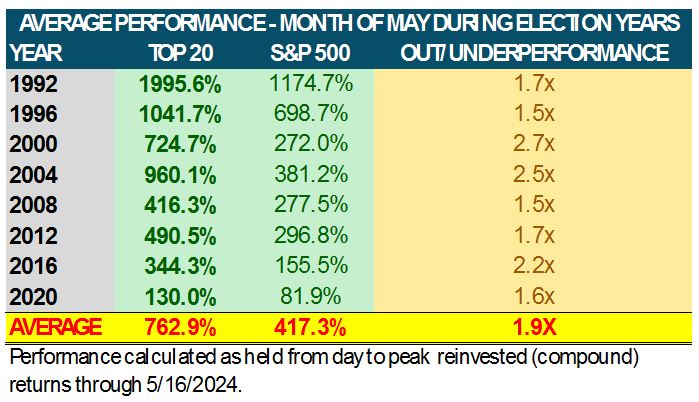
Source: MAPsignals, FactSet
Graphs are for illustrative and discussion purposes only. Please read important disclosures at the end of this commentary.
The Top 20 stocks outperformed the S&P 500 for every election year. Basically, if you bought the Top 20 and the S&P 500 on the same days in May, and held them through their peak returns, that’s what you’re looking at. The Top 20 from May in election years averaged nearly twice the peak reinvested return than the S&P 500. This tells us one simple truth: it matters to seek out the best… Finding the best stocks may seem hard, but they share qualities of superior fundamentals and strong money inflows.
Finding a world class athlete is easy, too… just look for the eye-popping statistics. Being a world class athlete can be more obvious to see, but like stocks, let them do the hard work, and let us just find them.
Adopting the Mamba mindset is simple and best characterized by Bryant himself, in three words:
“I’m chasing perfection.” – Kobe Bryant
All content above represents the opinion of Jason Bodner of Navellier & Associates, Inc.
Also In This Issue
A Look Ahead by Louis Navellier
Thanks to Sky-High Tariffs, China is No Longer Exporting Deflation
Income Mail by Bryan Perry
The Current Bull Market Rally is Built on Three Bullish Pillars
Growth Mail by Gary Alexander
It’s May – The Month for Marketing Marxism
Global Mail by Ivan Martchev
The Big NVIDIA News Arrives Tomorrow
Sector Spotlight by Jason Bodner
Why “Being the Best” Matters
View Full Archive
Read Past Issues Here

Jason Bodner
MARKETMAIL EDITOR FOR SECTOR SPOTLIGHT
Jason Bodner writes Sector Spotlight in the weekly Marketmail publication and has authored several white papers for the company. He is also Co-Founder of Macro Analytics for Professionals which produces proprietary equity accumulation/distribution research for its clients. Previously, Mr. Bodner served as Director of European Equity Derivatives for Cantor Fitzgerald Europe in London, then moved to the role of Head of Equity Derivatives North America for the same company in New York. He also served as S.V.P. Equity Derivatives for Jefferies, LLC. He received a B.S. in business administration in 1996, with honors, from Skidmore College as a member of the Periclean Honors Society. All content of “Sector Spotlight” represents the opinion of Jason Bodner
Important Disclosures:
Jason Bodner is a co-founder and co-owner of Mapsignals. Mr. Bodner is an independent contractor who is occasionally hired by Navellier & Associates to write an article and or provide opinions for possible use in articles that appear in Navellier & Associates weekly Market Mail. Mr. Bodner is not employed or affiliated with Louis Navellier, Navellier & Associates, Inc., or any other Navellier owned entity. The opinions and statements made here are those of Mr. Bodner and not necessarily those of any other persons or entities. This is not an endorsement, or solicitation or testimonial or investment advice regarding the BMI Index or any statements or recommendations or analysis in the article or the BMI Index or Mapsignals or its products or strategies.
Although information in these reports has been obtained from and is based upon sources that Navellier believes to be reliable, Navellier does not guarantee its accuracy and it may be incomplete or condensed. All opinions and estimates constitute Navellier’s judgment as of the date the report was created and are subject to change without notice. These reports are for informational purposes only and are not a solicitation for the purchase or sale of a security. Any decision to purchase securities mentioned in these reports must take into account existing public information on such securities or any registered prospectus.To the extent permitted by law, neither Navellier & Associates, Inc., nor any of its affiliates, agents, or service providers assumes any liability or responsibility nor owes any duty of care for any consequences of any person acting or refraining to act in reliance on the information contained in this communication or for any decision based on it.
Past performance is no indication of future results. Investment in securities involves significant risk and has the potential for partial or complete loss of funds invested. It should not be assumed that any securities recommendations made by Navellier. in the future will be profitable or equal the performance of securities made in this report. Dividend payments are not guaranteed. The amount of a dividend payment, if any, can vary over time and issuers may reduce dividends paid on securities in the event of a recession or adverse event affecting a specific industry or issuer.
None of the stock information, data, and company information presented herein constitutes a recommendation by Navellier or a solicitation to buy or sell any securities. Any specific securities identified and described do not represent all of the securities purchased, sold, or recommended for advisory clients. The holdings identified do not represent all of the securities purchased, sold, or recommended for advisory clients and the reader should not assume that investments in the securities identified and discussed were or will be profitable.
Information presented is general information that does not take into account your individual circumstances, financial situation, or needs, nor does it present a personalized recommendation to you. Individual stocks presented may not be suitable for every investor. Investment in securities involves significant risk and has the potential for partial or complete loss of funds invested. Investment in fixed income securities has the potential for the investment return and principal value of an investment to fluctuate so that an investor’s holdings, when redeemed, may be worth less than their original cost.
One cannot invest directly in an index. Index is unmanaged and index performance does not reflect deduction of fees, expenses, or taxes. Presentation of Index data does not reflect a belief by Navellier that any stock index constitutes an investment alternative to any Navellier equity strategy or is necessarily comparable to such strategies. Among the most important differences between the Indices and Navellier strategies are that the Navellier equity strategies may (1) incur material management fees, (2) concentrate its investments in relatively few stocks, industries, or sectors, (3) have significantly greater trading activity and related costs, and (4) be significantly more or less volatile than the Indices.
ETF Risk: We may invest in exchange traded funds (“ETFs”) and some of our investment strategies are generally fully invested in ETFs. Like traditional mutual funds, ETFs charge asset-based fees, but they generally do not charge initial sales charges or redemption fees and investors typically pay only customary brokerage fees to buy and sell ETF shares. The fees and costs charged by ETFs held in client accounts will not be deducted from the compensation the client pays Navellier. ETF prices can fluctuate up or down, and a client account could lose money investing in an ETF if the prices of the securities owned by the ETF go down. ETFs are subject to additional risks:
- ETF shares may trade above or below their net asset value;
- An active trading market for an ETF’s shares may not develop or be maintained;
- The value of an ETF may be more volatile than the underlying portfolio of securities the ETF is designed to track;
- The cost of owning shares of the ETF may exceed those a client would incur by directly investing in the underlying securities; and
- Trading of an ETF’s shares may be halted if the listing exchange’s officials deem it appropriate, the shares are delisted from the exchange, or the activation of market-wide “circuit breakers” (which are tied to large decreases in stock prices) halts stock trading generally.
Grader Disclosures: Investment in equity strategies involves substantial risk and has the potential for partial or complete loss of funds invested. The sample portfolio and any accompanying charts are for informational purposes only and are not to be construed as a solicitation to buy or sell any financial instrument and should not be relied upon as the sole factor in an investment making decision. As a matter of normal and important disclosures to you, as a potential investor, please consider the following: The performance presented is not based on any actual securities trading, portfolio, or accounts, and the reported performance of the A, B, C, D, and F portfolios (collectively the “model portfolios”) should be considered mere “paper” or pro forma performance results based on Navellier’s research.
Investors evaluating any of Navellier & Associates, Inc.’s, (or its affiliates’) Investment Products must not use any information presented here, including the performance figures of the model portfolios, in their evaluation of any Navellier Investment Products. Navellier Investment Products include the firm’s mutual funds and managed accounts. The model portfolios, charts, and other information presented do not represent actual funded trades and are not actual funded portfolios. There are material differences between Navellier Investment Products’ portfolios and the model portfolios, research, and performance figures presented here. The model portfolios and the research results (1) may contain stocks or ETFs that are illiquid and difficult to trade; (2) may contain stock or ETF holdings materially different from actual funded Navellier Investment Product portfolios; (3) include the reinvestment of all dividends and other earnings, estimated trading costs, commissions, or management fees; and, (4) may not reflect prices obtained in an actual funded Navellier Investment Product portfolio. For these and other reasons, the reported performances of model portfolios do not reflect the performance results of Navellier’s actually funded and traded Investment Products. In most cases, Navellier’s Investment Products have materially lower performance results than the performances of the model portfolios presented.
This report contains statements that are, or may be considered to be, forward-looking statements. All statements that are not historical facts, including statements about our beliefs or expectations, are “forward-looking statements” within the meaning of The U.S. Private Securities Litigation Reform Act of 1995. These statements may be identified by such forward-looking terminology as “expect,” “estimate,” “plan,” “intend,” “believe,” “anticipate,” “may,” “will,” “should,” “could,” “continue,” “project,” or similar statements or variations of such terms. Our forward-looking statements are based on a series of expectations, assumptions, and projections, are not guarantees of future results or performance, and involve substantial risks and uncertainty as described in Form ADV Part 2A of our filing with the Securities and Exchange Commission (SEC), which is available at www.adviserinfo.sec.gov or by requesting a copy by emailing info@navellier.com. All of our forward-looking statements are as of the date of this report only. We can give no assurance that such expectations or forward-looking statements will prove to be correct. Actual results may differ materially. You are urged to carefully consider all such factors.
FEDERAL TAX ADVICE DISCLAIMER: As required by U.S. Treasury Regulations, you are informed that, to the extent this presentation includes any federal tax advice, the presentation is not written by Navellier to be used, and cannot be used, for the purpose of avoiding federal tax penalties. Navellier does not advise on any income tax requirements or issues. Use of any information presented by Navellier is for general information only and does not represent tax advice either express or implied. You are encouraged to seek professional tax advice for income tax questions and assistance.
IMPORTANT NEWSLETTER DISCLOSURE:The hypothetical performance results for investment newsletters that are authored or edited by Louis Navellier, including Louis Navellier’s Growth Investor, Louis Navellier’s Breakthrough Stocks, Louis Navellier’s Accelerated Profits, and Louis Navellier’s Platinum Club, are not based on any actual securities trading, portfolio, or accounts, and the newsletters’ reported hypothetical performances should be considered mere “paper” or proforma hypothetical performance results and are not actual performance of real world trades. Navellier & Associates, Inc. does not have any relation to or affiliation with the owner of these newsletters. There are material differences between Navellier Investment Products’ portfolios and the InvestorPlace Media, LLC newsletter portfolios authored by Louis Navellier. The InvestorPlace Media, LLC newsletters contain hypothetical performance that do not include transaction costs, advisory fees, or other fees a client might incur if actual investments and trades were being made by an investor. As a result, newsletter performance should not be used to evaluate Navellier Investment services which are separate and different from the newsletters. The owner of the newsletters is InvestorPlace Media, LLC and any questions concerning the newsletters, including any newsletter advertising or hypothetical Newsletter performance claims, (which are calculated solely by Investor Place Media and not Navellier) should be referred to InvestorPlace Media, LLC at (800) 718-8289.
Please note that Navellier & Associates and the Navellier Private Client Group are managed completely independent of the newsletters owned and published by InvestorPlace Media, LLC and written and edited by Louis Navellier, and investment performance of the newsletters should in no way be considered indicative of potential future investment performance for any Navellier & Associates separately managed account portfolio. Potential investors should consult with their financial advisor before investing in any Navellier Investment Product.
Navellier claims compliance with Global Investment Performance Standards (GIPS). To receive a complete list and descriptions of Navellier’s composites and/or a presentation that adheres to the GIPS standards, please contact Navellier or click here. It should not be assumed that any securities recommendations made by Navellier & Associates, Inc. in the future will be profitable or equal the performance of securities made in this report.
FactSet Disclosure: Navellier does not independently calculate the statistical information included in the attached report. The calculation and the information are provided by FactSet, a company not related to Navellier. Although information contained in the report has been obtained from FactSet and is based on sources Navellier believes to be reliable, Navellier does not guarantee its accuracy, and it may be incomplete or condensed. The report and the related FactSet sourced information are provided on an “as is” basis. The user assumes the entire risk of any use made of this information. Investors should consider the report as only a single factor in making their investment decision. The report is for informational purposes only and is not intended as an offer or solicitation for the purchase or sale of a security. FactSet sourced information is the exclusive property of FactSet. Without prior written permission of FactSet, this information may not be reproduced, disseminated or used to create any financial products. All indices are unmanaged and performance of the indices include reinvestment of dividends and interest income, unless otherwise noted, are not illustrative of any particular investment and an investment cannot be made in any index. Past performance is no guarantee of future results.