by Jason Bodner
February 27, 2024
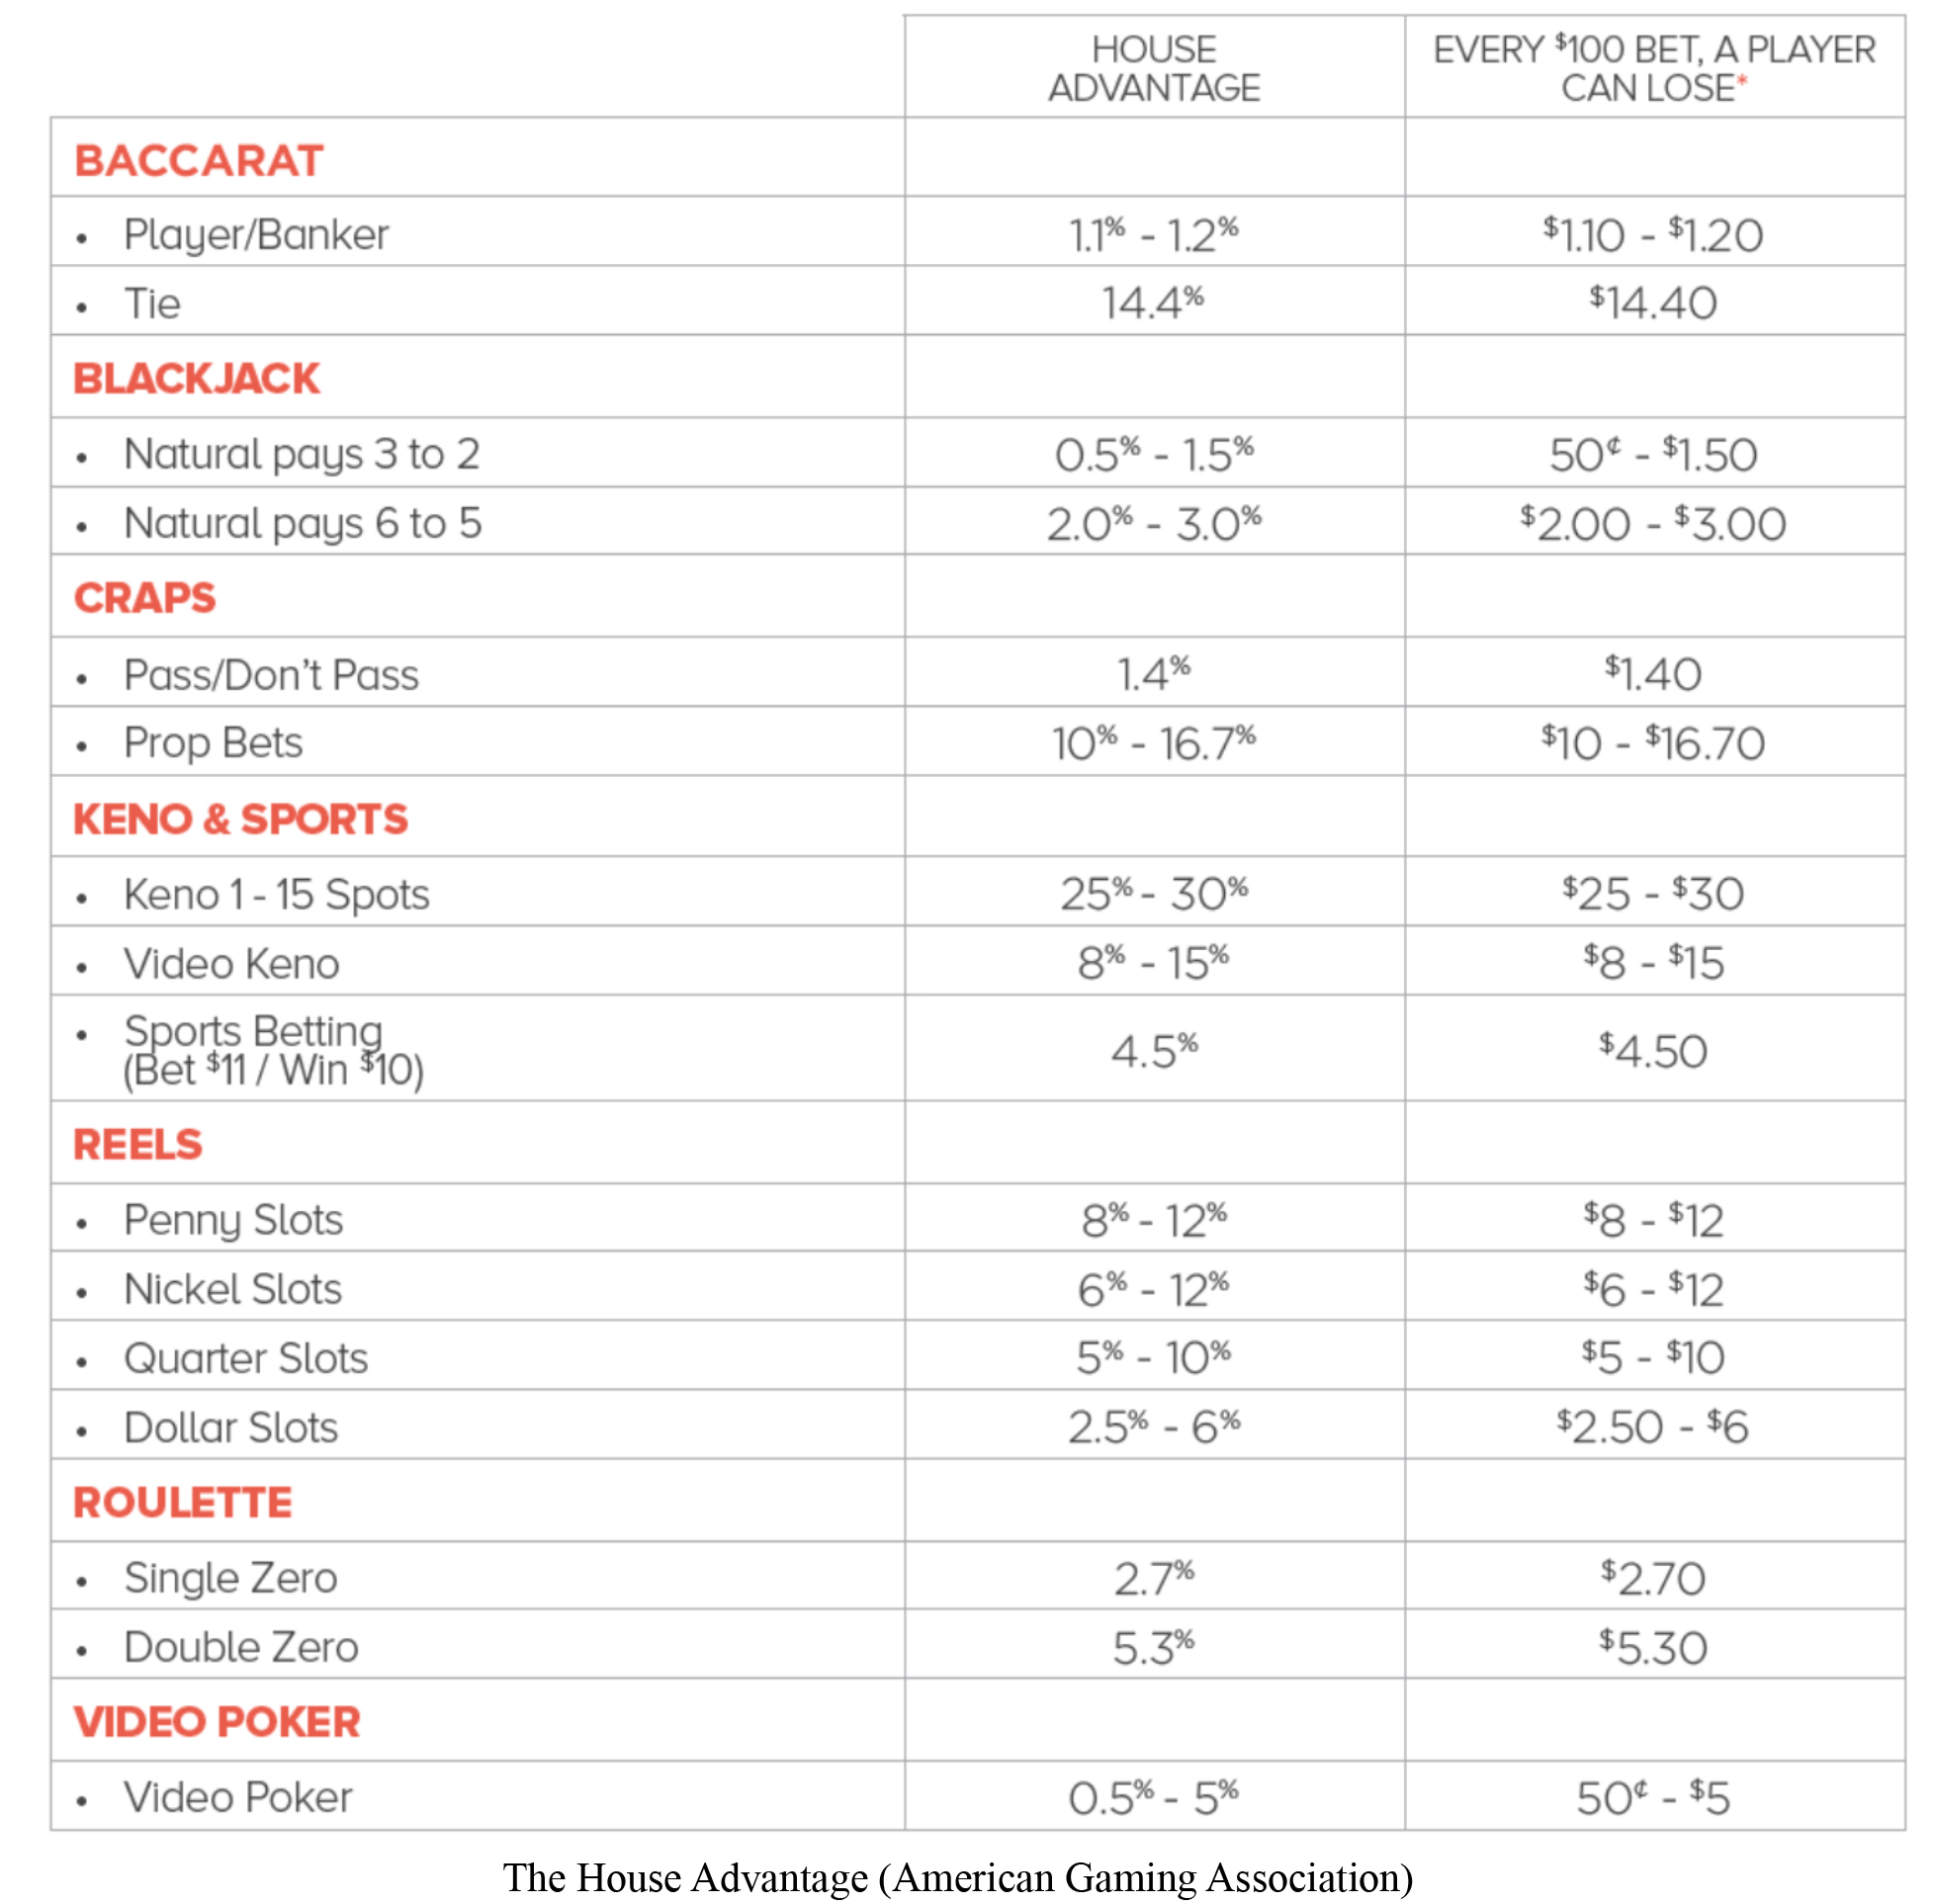
Most people know that when you walk into a casino, the odds are already against you. That doesn’t mean you can’t walk out a big winner, but if you do, don’t expect a warm welcome next time. Casinos are in the business of making money and they do so by shifting the odds in their favor – in all of their games.
According to the American Gaming Association, Blackjack offers you the best odds. That said, the house still has an advantage of up to 1.5% on a natural game of 21. Over the long run, that’s a guaranteed loss.
Maybe you’re better off playing something like keno? No, sir! According to the same data, the house edge on video Keno is 8% to 15%. With odds like that, Keno must be a huge profit center for casinos:
Graphs are for illustrative and discussion purposes only. Please read important disclosures at the end of this commentary.
Interestingly, this table excludes Texas Hold ‘Em Poker. This is likely due to the fact that the above are games of chance and Hold ‘Em is a game of skill. Same with Video Poker. If you bet perfectly there, you still lose by a margin of at least 0.5%. In games of luck, on any given toss of the dice, you might win big, but if you keep playing long term, you’ll lose. It’s written into the DNA of the odds. However, with poker, you can master strategies that shift the odds in your favor. This is how professional poker players can rake in big pots time and time again. According to pokernews.com, the top 25 poker players in the world have won a staggering $1 billion, with the top five being Bryn Kenney (winning $65,115,882), Justin Bonomo ($63,405,743), Jason Koon ($55,762,108), Stephen Chidwick ($55,543,12) and Dan Smith ($52,438,566).
The great irony is that investing in stocks can seem like a sure thing, but our behavior in real life can turn the odds back to “the house,” making the odds pretty discouraging. In a 2017 paper, Professor Hedrik Bessembinder asked: “Do Stocks Outperform Treasury Bills?” To find the answer, he used 100 years of stock data spanning over 26,000 stocks. The answer was mixed: Yes, they do, but only 4% of listed stocks accounted for the entire surplus gain of stocks over Treasury Bills for those 100 years. The moral of the story? If you want to win, you need an edge over the world’s best players. My preferred edge is data.
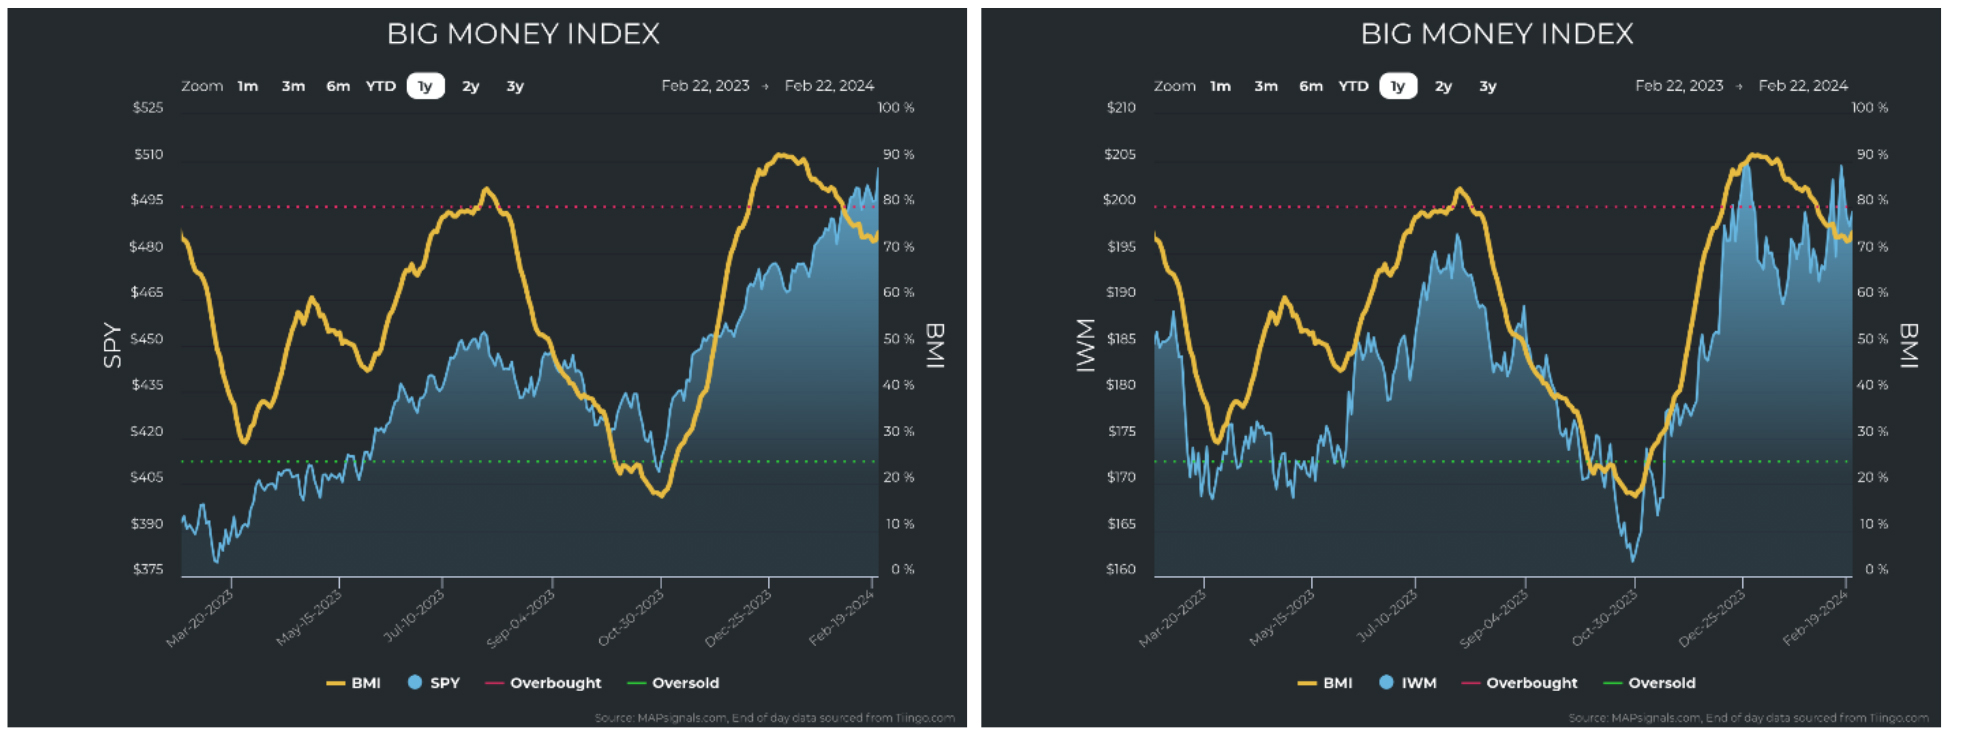
Last week’s market action was a roller coaster. After a monstrous rally starting late last October, the momentum seemed to peter out in mid-February, as some major themes seemed to lose steam, and profit taking commenced. The Big Money Index (BMI) fell from overbought, and it seemed that the implied volatility arrived right on cue. The charts below show the BMI falling from overbought (in amber).
The left chart, below, shows the S&P 500 tracking ETF (SPY) in blue. It didn’t seem to be that volatile. But if you look at the Russell 2000 tracking ETF (IWM) on the right, we see a more volatile picture:
Graphs are for illustrative and discussion purposes only. Please read important disclosures at the end of this commentary.
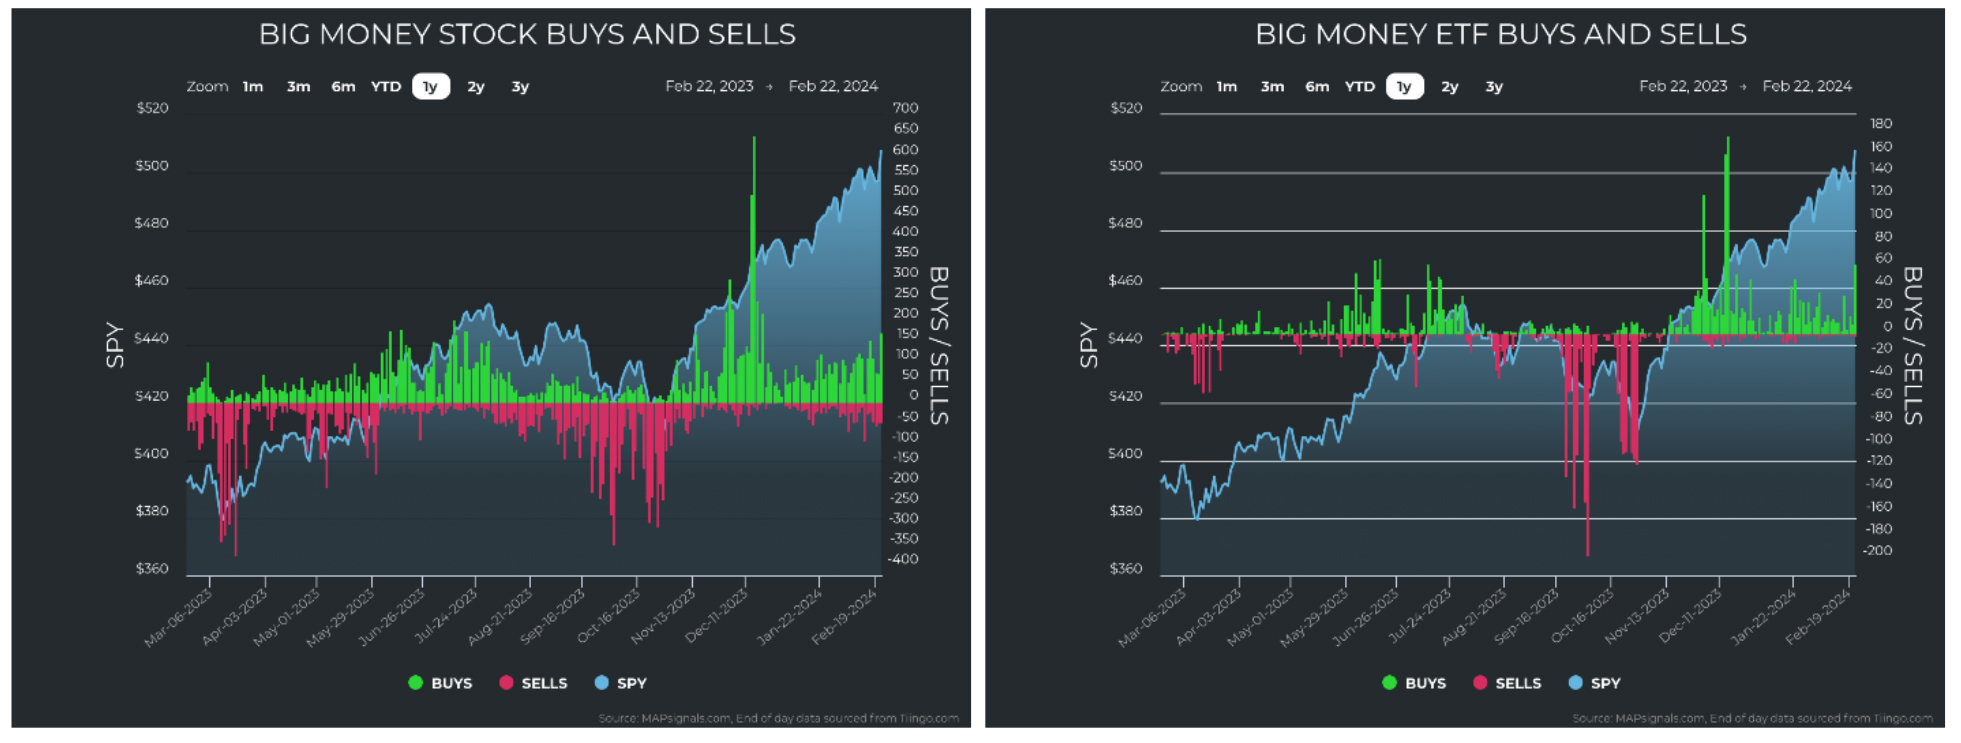
I wrote last week how history suggested a falling BMI is a risk reduction signal, but with this caveat: We must focus on the buying and selling pressure. Looking below, we see that the BMI fell not from increased selling, but mostly due to a wave of massive buying falling out of the 25-day moving average.
We see unusually large stock buying and selling on the left and the same for ETFs on the right. You can clearly see there’s just not much red (selling) recently… certainly nothing to get worried about:
Graphs are for illustrative and discussion purposes only. Please read important disclosures at the end of this commentary.
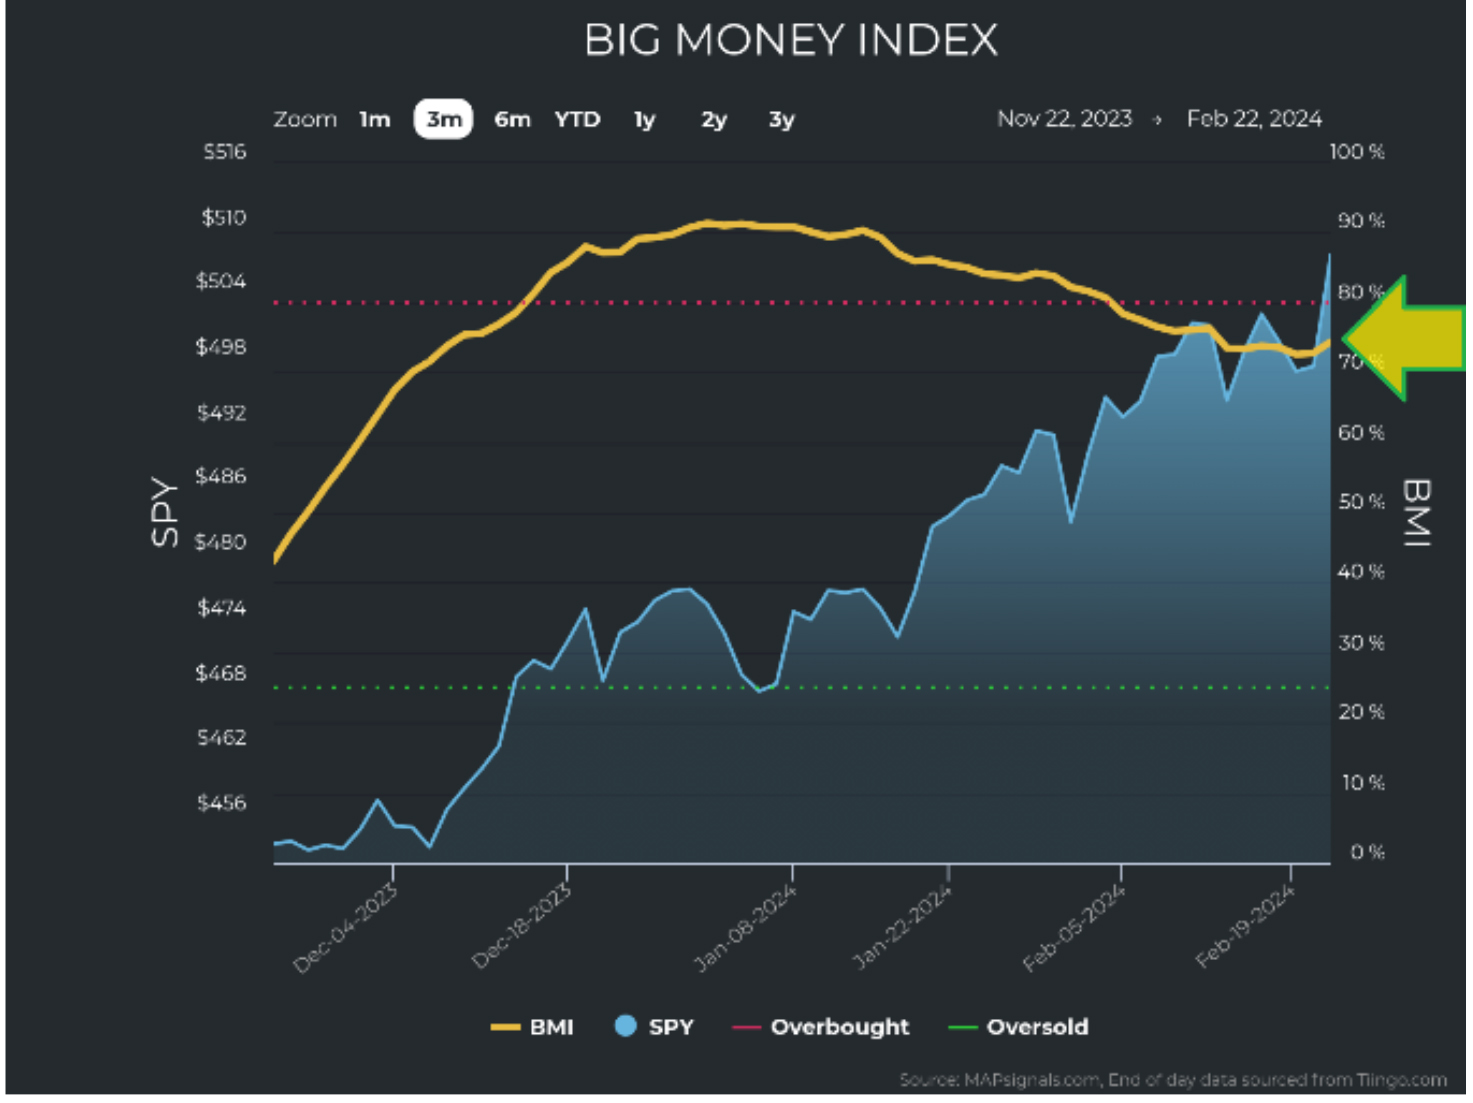
If anything – we see steady buying after a minor drop-off. This is helping push the BMI back up! Below we can see , major buying is shifting the BMI higher:
Graphs are for illustrative and discussion purposes only. Please read important disclosures at the end of this commentary.
We need to see obvious signs of selling for this bull market to pause. That has not happened yet. In fact, buying still heavily outweighs selling. Here we see the start of the year in comparison to just last week:
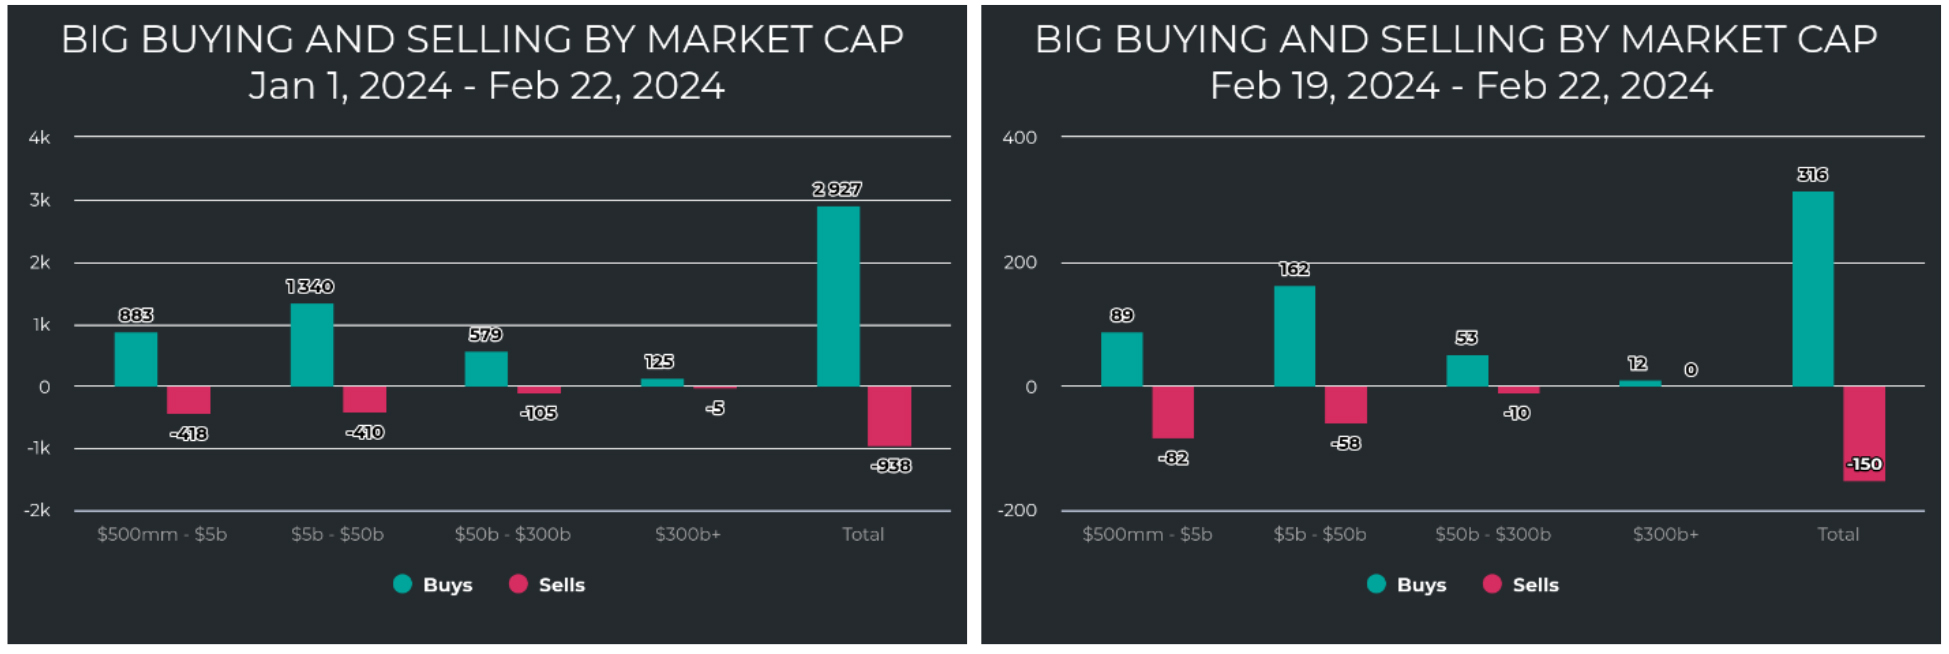
Graphs are for illustrative and discussion purposes only. Please read important disclosures at the end of this commentary.
Next, we look into the sectors for any possible cracks in the wall. Looking at the sector strength and weakness table, we see strong growth sectors at the top and weaker defensive sectors at the bottom.
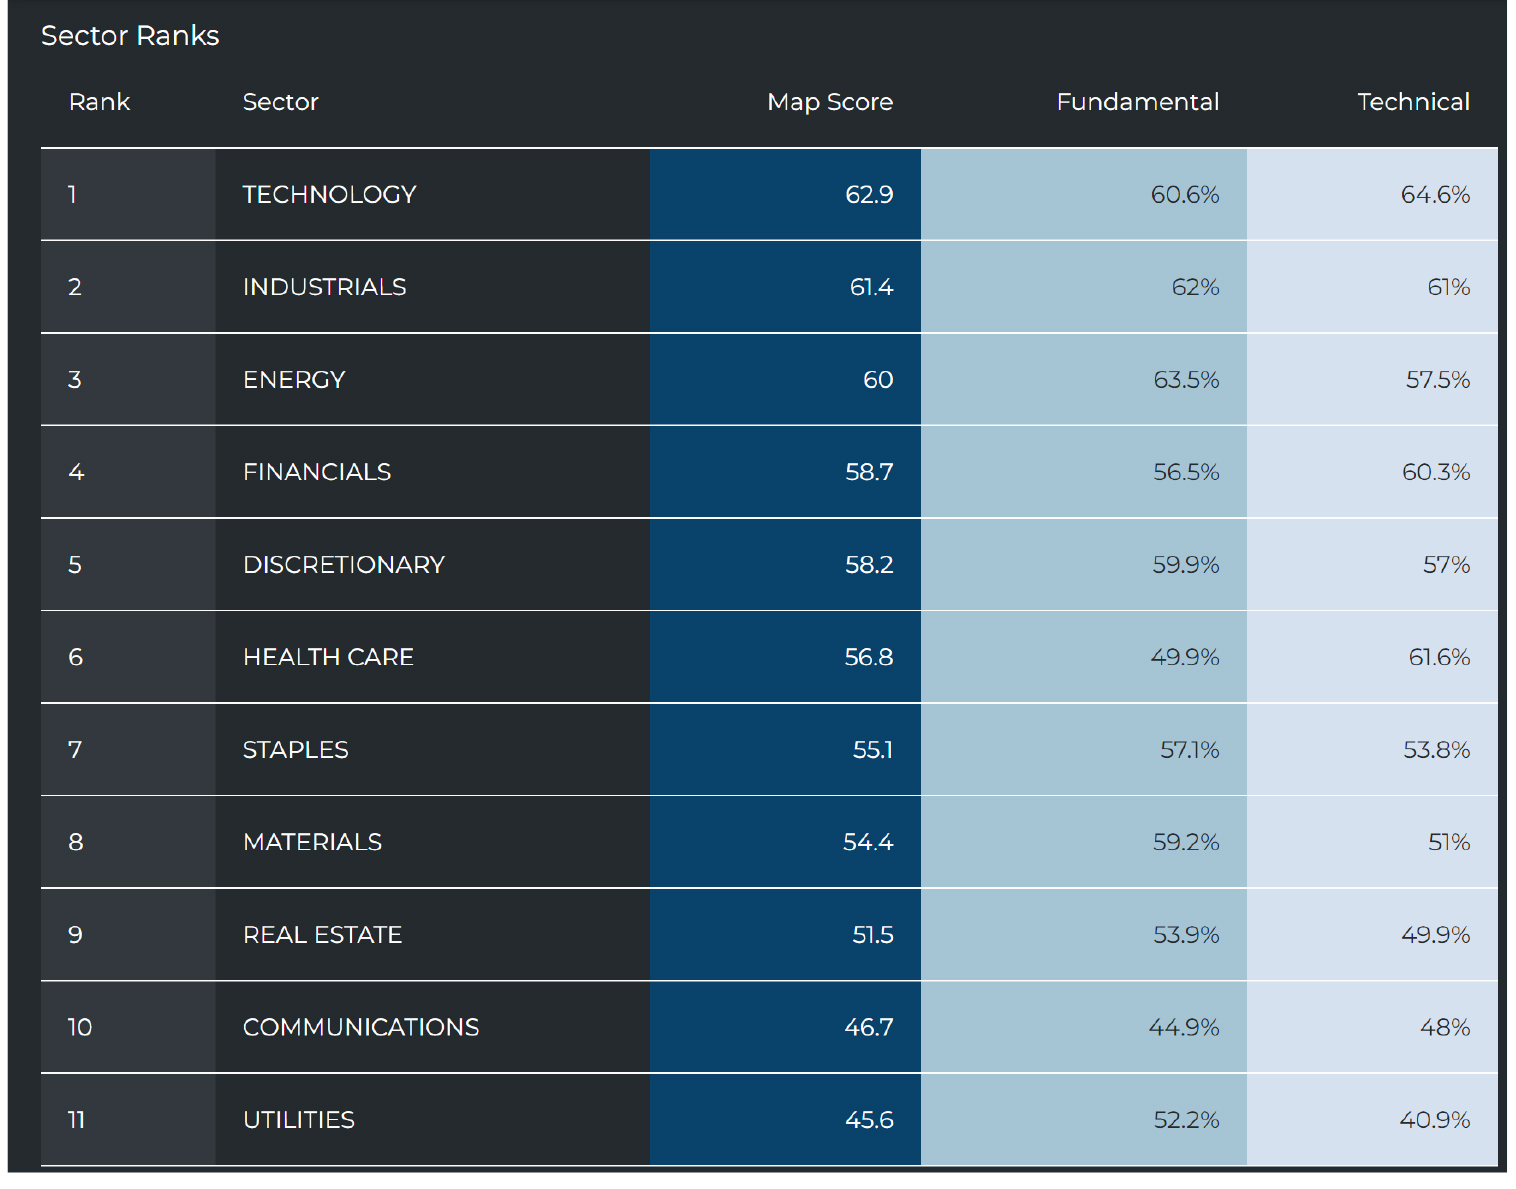
Graphs are for illustrative and discussion purposes only. Please read important disclosures at the end of this commentary.
What’s more interesting is the buying and selling distribution of these sectors. In short – there’s no notable selling in any sector:
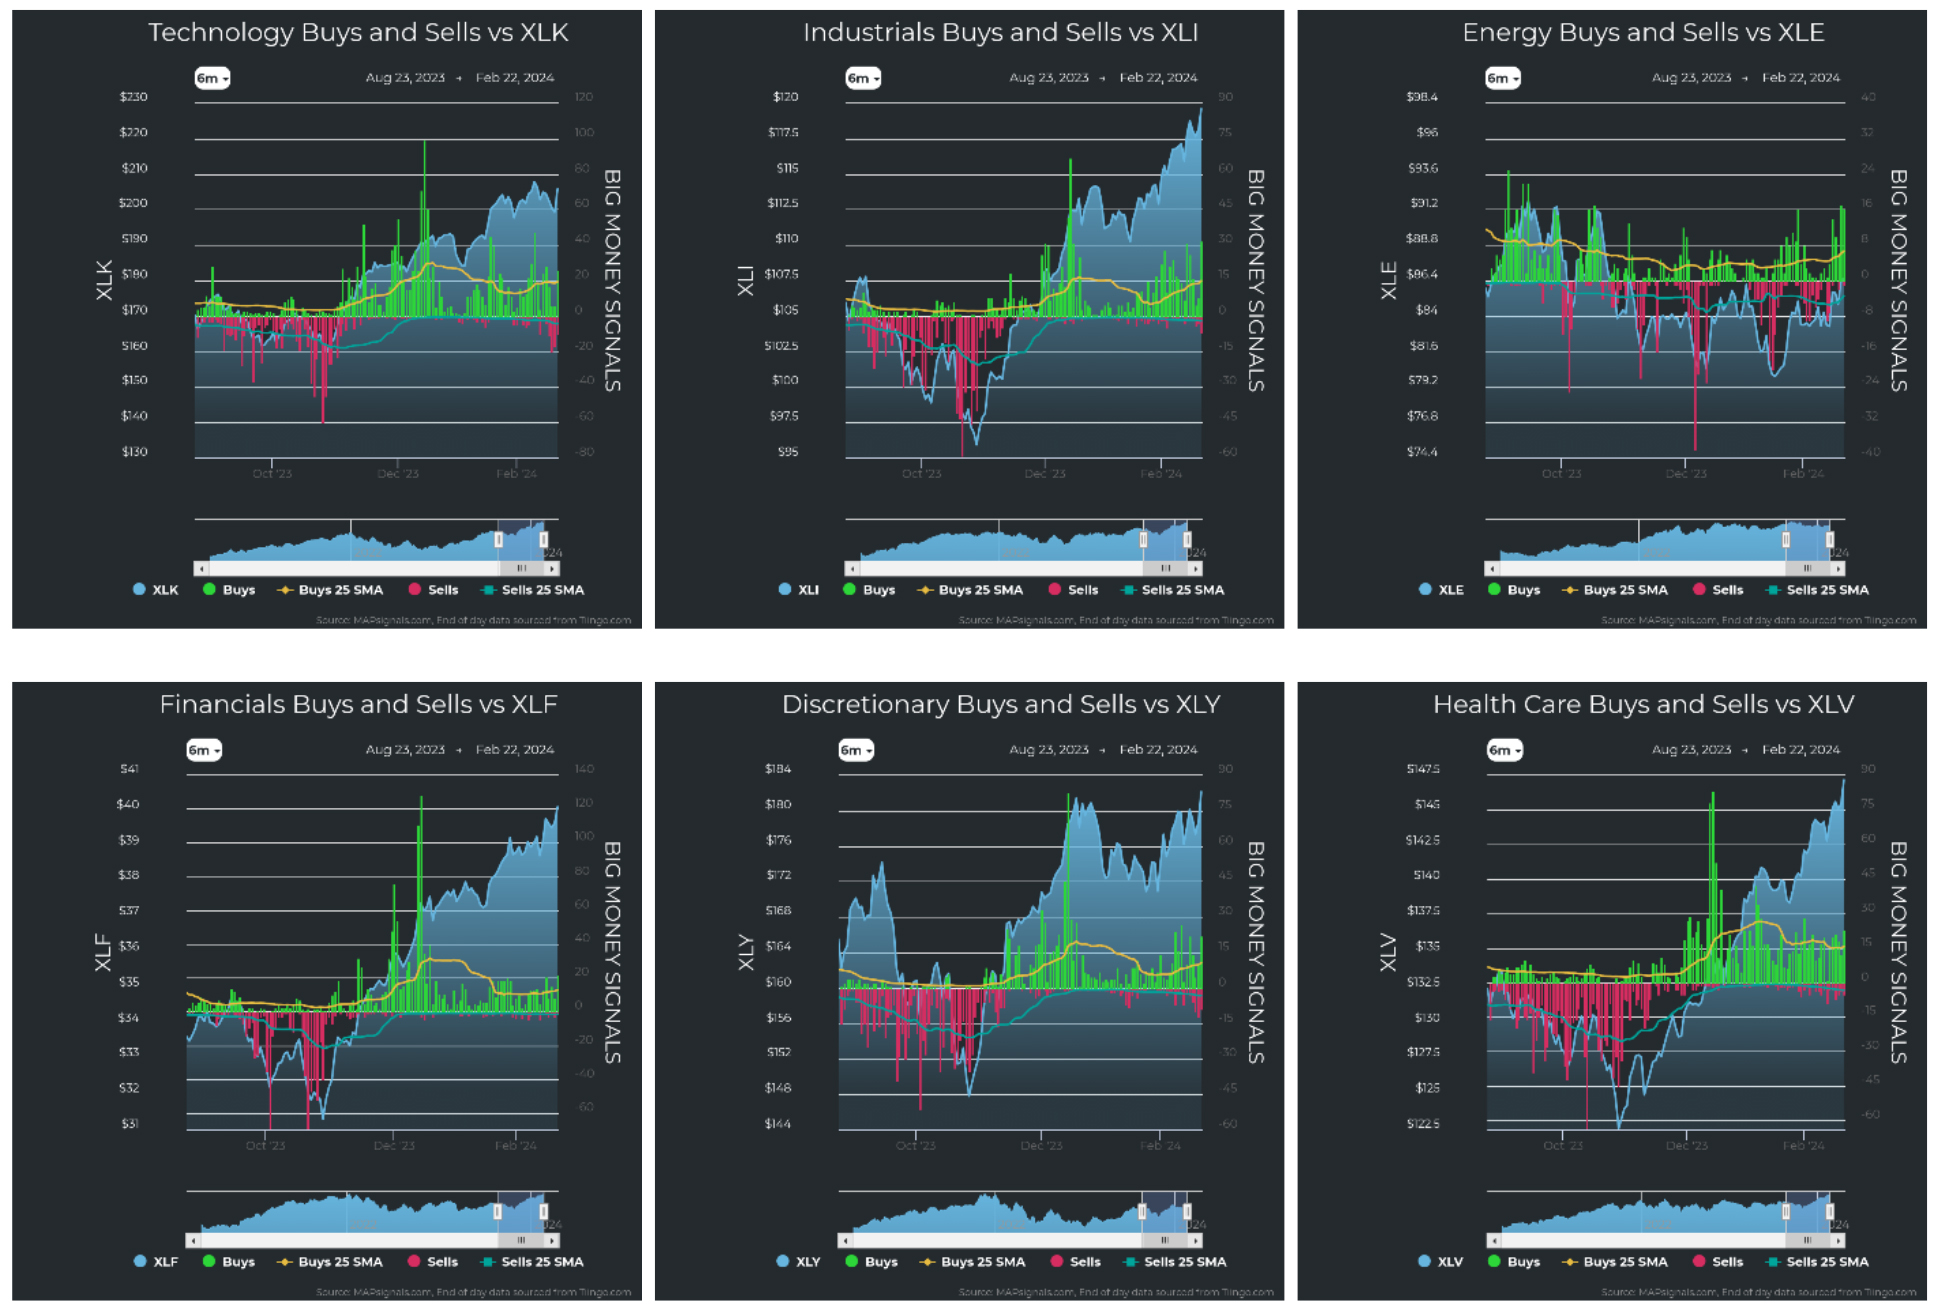
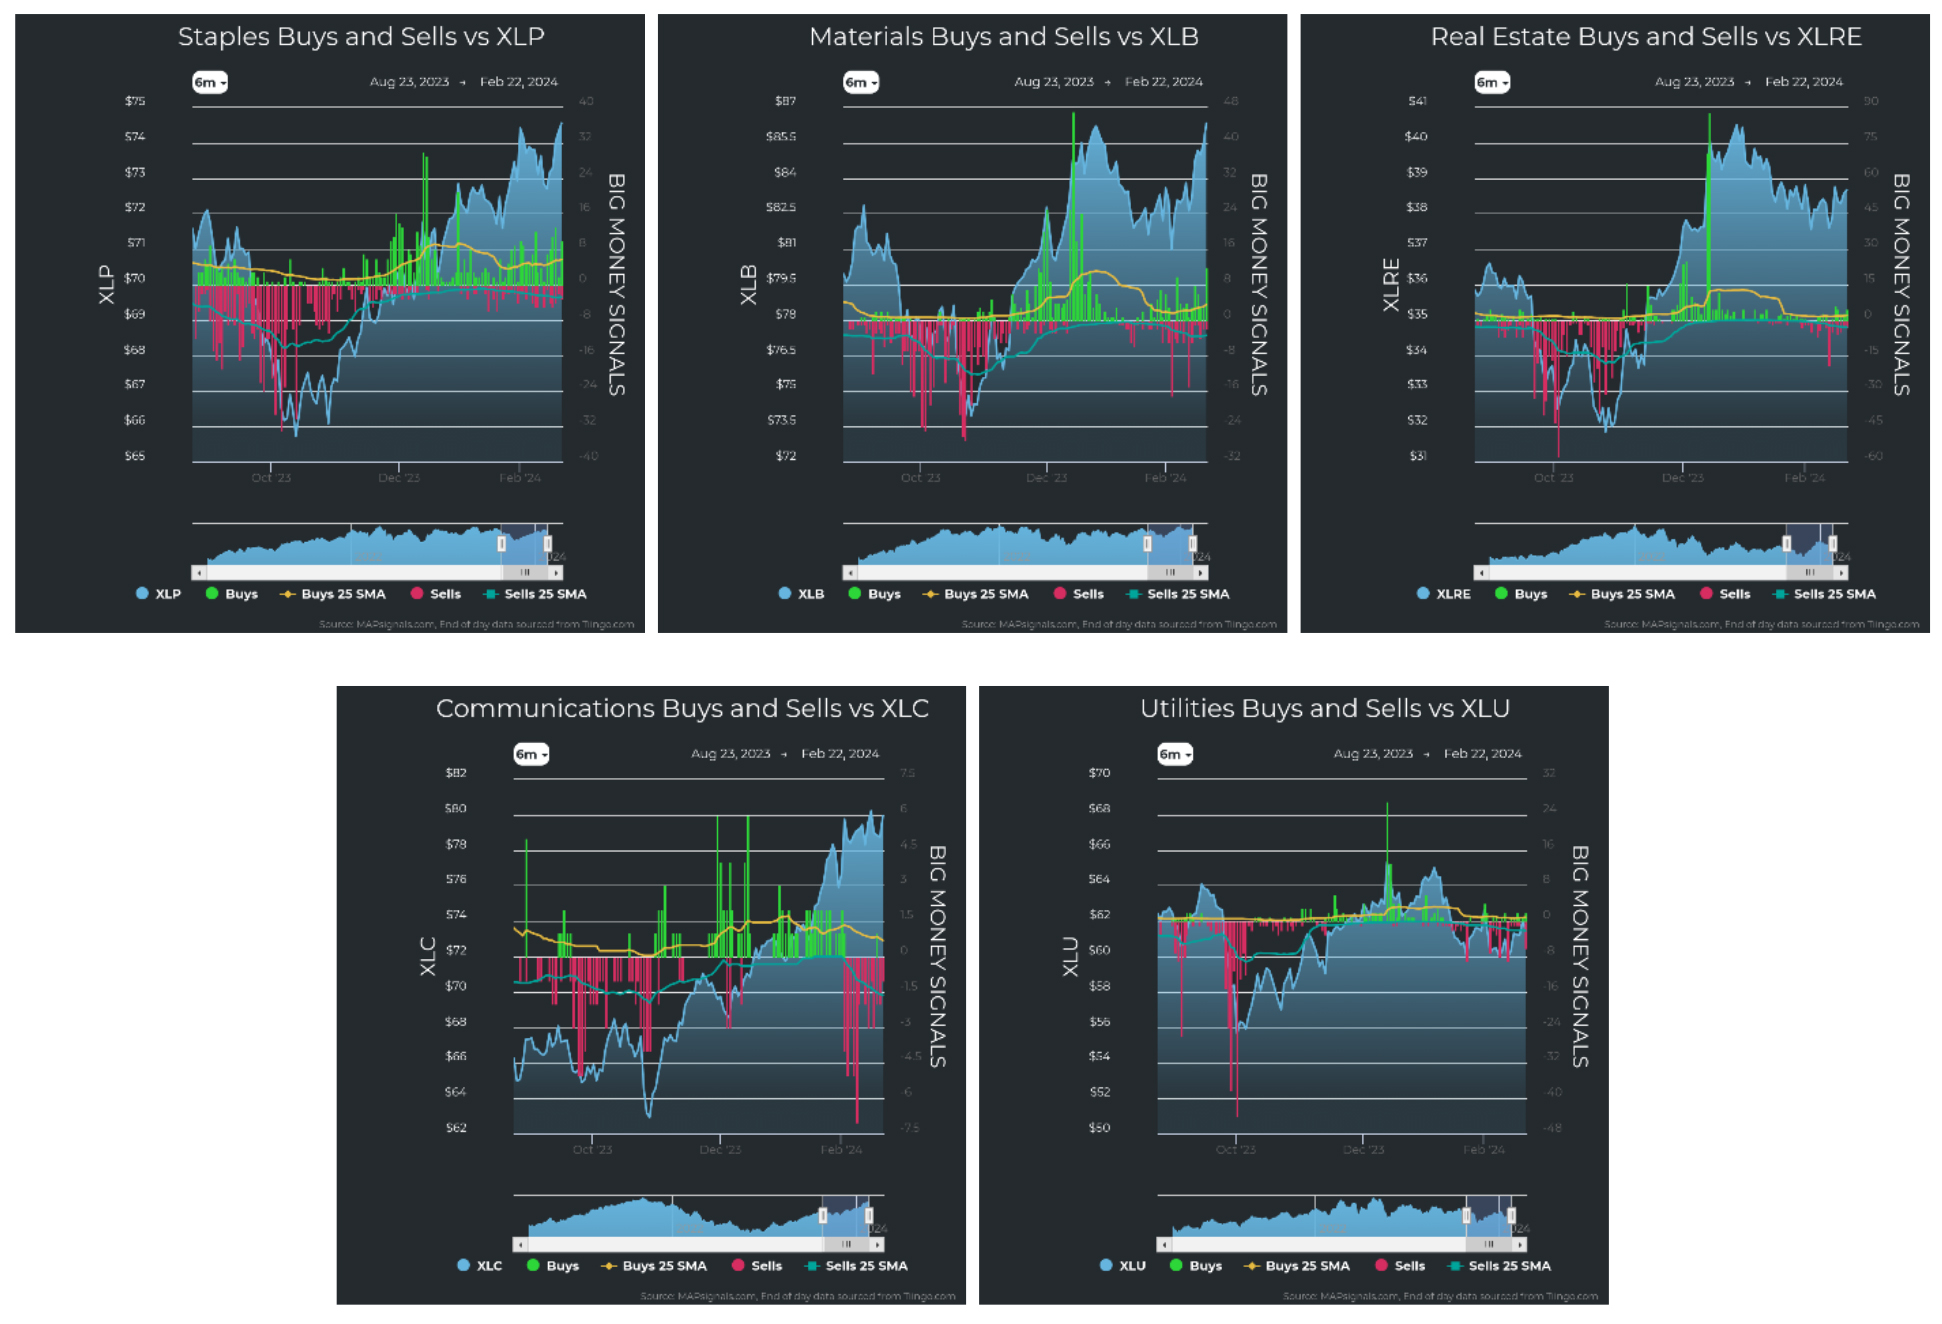
Graphs are for illustrative and discussion purposes only. Please read important disclosures at the end of this commentary.
What little selling that took place in tech shares quickly retreated and the rest of the market along with it. The only possible warning flag in such a rise is if the higher market action was “ghost” action, that is, if the market rally were taking place on light volume.
In the charts below, we can see unusually large trades based on volume and volatility alone. No highs or lows indicating buying or selling are considered. Here, I am just looking for whopper trades:
Graphs are for illustrative and discussion purposes only. Please read important disclosures at the end of this commentary.
My takeaway is that this rally is still very much intact. I won’t change my view until I see contradictory evidence. In fact, I see earnings that just keep on beating expectations. According to the latest available data from FactSet Earnings Insight for Q4 2023, 79% of S&P 500 companies have reported, with 75% registering an EPS surprise and 65% beating on revenue. The blended (year-over-year) earnings growth for the S&P 500 is 3.2%, marking the second-straight quarter that the index has reported earnings growth.
For me, approaching investing with a “gut instinct’ is comparable to walking up to the casino craps table with “high conviction.” Confidence in a casino is not based on quantifiable data, but my data on today’s market shows me that market strength is intact. Thus far, we have only one negative indicator (the BMI falling from overbought). On the other hand, we have several positive indicators, such as heavy volume buying, strength across sectors, growth-heavy sectors leading the surge, and excellent earnings.
The best strategy is to ride the predominant wave until the data says otherwise.
I prefer to use data to earn an investing edge. I risk real money in markets. It is up to me to manage that risk and understand it. Quantifiable data is the best tool I know to help with that. Otherwise, to me, it’s gambling. And as Wilson Mizner said: “Gambling is the sure way of getting nothing for something.”
All content above represents the opinion of Jason Bodner of Navellier & Associates, Inc.
Also In This Issue
A Look Ahead by Louis Navellier
Inside NVidia’s Stunning Report, and its Impact
Income Mail by Bryan Perry
What Could Stop the Market’s Mojo?
Growth Mail by Gary Alexander
Are We in Market Bubble Territory Yet?
Global Mail by Ivan Martchev
The Broad Market is Not Extended at All
Sector Spotlight by Jason Bodner
Is the Market a Short-Term Casino, or a Long-Term Sure Thing?
View Full Archive
Read Past Issues Here

Jason Bodner
MARKETMAIL EDITOR FOR SECTOR SPOTLIGHT
Jason Bodner writes Sector Spotlight in the weekly Marketmail publication and has authored several white papers for the company. He is also Co-Founder of Macro Analytics for Professionals which produces proprietary equity accumulation/distribution research for its clients. Previously, Mr. Bodner served as Director of European Equity Derivatives for Cantor Fitzgerald Europe in London, then moved to the role of Head of Equity Derivatives North America for the same company in New York. He also served as S.V.P. Equity Derivatives for Jefferies, LLC. He received a B.S. in business administration in 1996, with honors, from Skidmore College as a member of the Periclean Honors Society. All content of “Sector Spotlight” represents the opinion of Jason Bodner
Important Disclosures:
Jason Bodner is a co-founder and co-owner of Mapsignals. Mr. Bodner is an independent contractor who is occasionally hired by Navellier & Associates to write an article and or provide opinions for possible use in articles that appear in Navellier & Associates weekly Market Mail. Mr. Bodner is not employed or affiliated with Louis Navellier, Navellier & Associates, Inc., or any other Navellier owned entity. The opinions and statements made here are those of Mr. Bodner and not necessarily those of any other persons or entities. This is not an endorsement, or solicitation or testimonial or investment advice regarding the BMI Index or any statements or recommendations or analysis in the article or the BMI Index or Mapsignals or its products or strategies.
Although information in these reports has been obtained from and is based upon sources that Navellier believes to be reliable, Navellier does not guarantee its accuracy and it may be incomplete or condensed. All opinions and estimates constitute Navellier’s judgment as of the date the report was created and are subject to change without notice. These reports are for informational purposes only and are not a solicitation for the purchase or sale of a security. Any decision to purchase securities mentioned in these reports must take into account existing public information on such securities or any registered prospectus.To the extent permitted by law, neither Navellier & Associates, Inc., nor any of its affiliates, agents, or service providers assumes any liability or responsibility nor owes any duty of care for any consequences of any person acting or refraining to act in reliance on the information contained in this communication or for any decision based on it.
Past performance is no indication of future results. Investment in securities involves significant risk and has the potential for partial or complete loss of funds invested. It should not be assumed that any securities recommendations made by Navellier. in the future will be profitable or equal the performance of securities made in this report. Dividend payments are not guaranteed. The amount of a dividend payment, if any, can vary over time and issuers may reduce dividends paid on securities in the event of a recession or adverse event affecting a specific industry or issuer.
None of the stock information, data, and company information presented herein constitutes a recommendation by Navellier or a solicitation to buy or sell any securities. Any specific securities identified and described do not represent all of the securities purchased, sold, or recommended for advisory clients. The holdings identified do not represent all of the securities purchased, sold, or recommended for advisory clients and the reader should not assume that investments in the securities identified and discussed were or will be profitable.
Information presented is general information that does not take into account your individual circumstances, financial situation, or needs, nor does it present a personalized recommendation to you. Individual stocks presented may not be suitable for every investor. Investment in securities involves significant risk and has the potential for partial or complete loss of funds invested. Investment in fixed income securities has the potential for the investment return and principal value of an investment to fluctuate so that an investor’s holdings, when redeemed, may be worth less than their original cost.
One cannot invest directly in an index. Index is unmanaged and index performance does not reflect deduction of fees, expenses, or taxes. Presentation of Index data does not reflect a belief by Navellier that any stock index constitutes an investment alternative to any Navellier equity strategy or is necessarily comparable to such strategies. Among the most important differences between the Indices and Navellier strategies are that the Navellier equity strategies may (1) incur material management fees, (2) concentrate its investments in relatively few stocks, industries, or sectors, (3) have significantly greater trading activity and related costs, and (4) be significantly more or less volatile than the Indices.
ETF Risk: We may invest in exchange traded funds (“ETFs”) and some of our investment strategies are generally fully invested in ETFs. Like traditional mutual funds, ETFs charge asset-based fees, but they generally do not charge initial sales charges or redemption fees and investors typically pay only customary brokerage fees to buy and sell ETF shares. The fees and costs charged by ETFs held in client accounts will not be deducted from the compensation the client pays Navellier. ETF prices can fluctuate up or down, and a client account could lose money investing in an ETF if the prices of the securities owned by the ETF go down. ETFs are subject to additional risks:
- ETF shares may trade above or below their net asset value;
- An active trading market for an ETF’s shares may not develop or be maintained;
- The value of an ETF may be more volatile than the underlying portfolio of securities the ETF is designed to track;
- The cost of owning shares of the ETF may exceed those a client would incur by directly investing in the underlying securities; and
- Trading of an ETF’s shares may be halted if the listing exchange’s officials deem it appropriate, the shares are delisted from the exchange, or the activation of market-wide “circuit breakers” (which are tied to large decreases in stock prices) halts stock trading generally.
Grader Disclosures: Investment in equity strategies involves substantial risk and has the potential for partial or complete loss of funds invested. The sample portfolio and any accompanying charts are for informational purposes only and are not to be construed as a solicitation to buy or sell any financial instrument and should not be relied upon as the sole factor in an investment making decision. As a matter of normal and important disclosures to you, as a potential investor, please consider the following: The performance presented is not based on any actual securities trading, portfolio, or accounts, and the reported performance of the A, B, C, D, and F portfolios (collectively the “model portfolios”) should be considered mere “paper” or pro forma performance results based on Navellier’s research.
Investors evaluating any of Navellier & Associates, Inc.’s, (or its affiliates’) Investment Products must not use any information presented here, including the performance figures of the model portfolios, in their evaluation of any Navellier Investment Products. Navellier Investment Products include the firm’s mutual funds and managed accounts. The model portfolios, charts, and other information presented do not represent actual funded trades and are not actual funded portfolios. There are material differences between Navellier Investment Products’ portfolios and the model portfolios, research, and performance figures presented here. The model portfolios and the research results (1) may contain stocks or ETFs that are illiquid and difficult to trade; (2) may contain stock or ETF holdings materially different from actual funded Navellier Investment Product portfolios; (3) include the reinvestment of all dividends and other earnings, estimated trading costs, commissions, or management fees; and, (4) may not reflect prices obtained in an actual funded Navellier Investment Product portfolio. For these and other reasons, the reported performances of model portfolios do not reflect the performance results of Navellier’s actually funded and traded Investment Products. In most cases, Navellier’s Investment Products have materially lower performance results than the performances of the model portfolios presented.
This report contains statements that are, or may be considered to be, forward-looking statements. All statements that are not historical facts, including statements about our beliefs or expectations, are “forward-looking statements” within the meaning of The U.S. Private Securities Litigation Reform Act of 1995. These statements may be identified by such forward-looking terminology as “expect,” “estimate,” “plan,” “intend,” “believe,” “anticipate,” “may,” “will,” “should,” “could,” “continue,” “project,” or similar statements or variations of such terms. Our forward-looking statements are based on a series of expectations, assumptions, and projections, are not guarantees of future results or performance, and involve substantial risks and uncertainty as described in Form ADV Part 2A of our filing with the Securities and Exchange Commission (SEC), which is available at www.adviserinfo.sec.gov or by requesting a copy by emailing info@navellier.com. All of our forward-looking statements are as of the date of this report only. We can give no assurance that such expectations or forward-looking statements will prove to be correct. Actual results may differ materially. You are urged to carefully consider all such factors.
FEDERAL TAX ADVICE DISCLAIMER: As required by U.S. Treasury Regulations, you are informed that, to the extent this presentation includes any federal tax advice, the presentation is not written by Navellier to be used, and cannot be used, for the purpose of avoiding federal tax penalties. Navellier does not advise on any income tax requirements or issues. Use of any information presented by Navellier is for general information only and does not represent tax advice either express or implied. You are encouraged to seek professional tax advice for income tax questions and assistance.
IMPORTANT NEWSLETTER DISCLOSURE:The hypothetical performance results for investment newsletters that are authored or edited by Louis Navellier, including Louis Navellier’s Growth Investor, Louis Navellier’s Breakthrough Stocks, Louis Navellier’s Accelerated Profits, and Louis Navellier’s Platinum Club, are not based on any actual securities trading, portfolio, or accounts, and the newsletters’ reported hypothetical performances should be considered mere “paper” or proforma hypothetical performance results and are not actual performance of real world trades. Navellier & Associates, Inc. does not have any relation to or affiliation with the owner of these newsletters. There are material differences between Navellier Investment Products’ portfolios and the InvestorPlace Media, LLC newsletter portfolios authored by Louis Navellier. The InvestorPlace Media, LLC newsletters contain hypothetical performance that do not include transaction costs, advisory fees, or other fees a client might incur if actual investments and trades were being made by an investor. As a result, newsletter performance should not be used to evaluate Navellier Investment services which are separate and different from the newsletters. The owner of the newsletters is InvestorPlace Media, LLC and any questions concerning the newsletters, including any newsletter advertising or hypothetical Newsletter performance claims, (which are calculated solely by Investor Place Media and not Navellier) should be referred to InvestorPlace Media, LLC at (800) 718-8289.
Please note that Navellier & Associates and the Navellier Private Client Group are managed completely independent of the newsletters owned and published by InvestorPlace Media, LLC and written and edited by Louis Navellier, and investment performance of the newsletters should in no way be considered indicative of potential future investment performance for any Navellier & Associates separately managed account portfolio. Potential investors should consult with their financial advisor before investing in any Navellier Investment Product.
Navellier claims compliance with Global Investment Performance Standards (GIPS). To receive a complete list and descriptions of Navellier’s composites and/or a presentation that adheres to the GIPS standards, please contact Navellier or click here. It should not be assumed that any securities recommendations made by Navellier & Associates, Inc. in the future will be profitable or equal the performance of securities made in this report.
FactSet Disclosure: Navellier does not independently calculate the statistical information included in the attached report. The calculation and the information are provided by FactSet, a company not related to Navellier. Although information contained in the report has been obtained from FactSet and is based on sources Navellier believes to be reliable, Navellier does not guarantee its accuracy, and it may be incomplete or condensed. The report and the related FactSet sourced information are provided on an “as is” basis. The user assumes the entire risk of any use made of this information. Investors should consider the report as only a single factor in making their investment decision. The report is for informational purposes only and is not intended as an offer or solicitation for the purchase or sale of a security. FactSet sourced information is the exclusive property of FactSet. Without prior written permission of FactSet, this information may not be reproduced, disseminated or used to create any financial products. All indices are unmanaged and performance of the indices include reinvestment of dividends and interest income, unless otherwise noted, are not illustrative of any particular investment and an investment cannot be made in any index. Past performance is no guarantee of future results.