by Bryan Perry
January 3, 2024
It is widely understood that the U.S. dollar is still the world’s reserve currency, primarily because of its stability and acceptance in international trade. Ever since the 1944 Bretton Woods Agreement formalized the U.S. dollar’s status as the world’s reserve currency, backed by the largest gold reserves, the dollar has remained King, although it was officially de-pegged from gold on August 15, 1971, by President Nixon in a series of economic measures known as the Nixon Shock. The dollar then suffered during the 1970s versus the German mark, Swiss franc, Japanese yen and other currencies, until reviving strongly in the early ‘80s.
Nixon’s 1971 gold de-pegging was done in response to rising inflation and a soaring trade deficit, which made it increasingly difficult to maintain the gold exchange standard. From that time to today, the dollar trades as a “fiat” currency, meaning that its value is not backed by any physical commodity, but instead trades on the full faith and credit of the U.S. Treasury. It has continued to hold the mantle as the world’s reserve currency based on trust, being backed by the world’s #1 economy and dominant military power.
Several other countries have sought stability in their sovereign currencies by pegging their exchange rates to the dollar, with much of the global financial system dependent on the stability of the dollar for the smooth free flow of international trade. For instance, most crude oil transactions today are denominated in U.S. dollars, despite efforts by China to undermine the dollar standard in global oil trading.
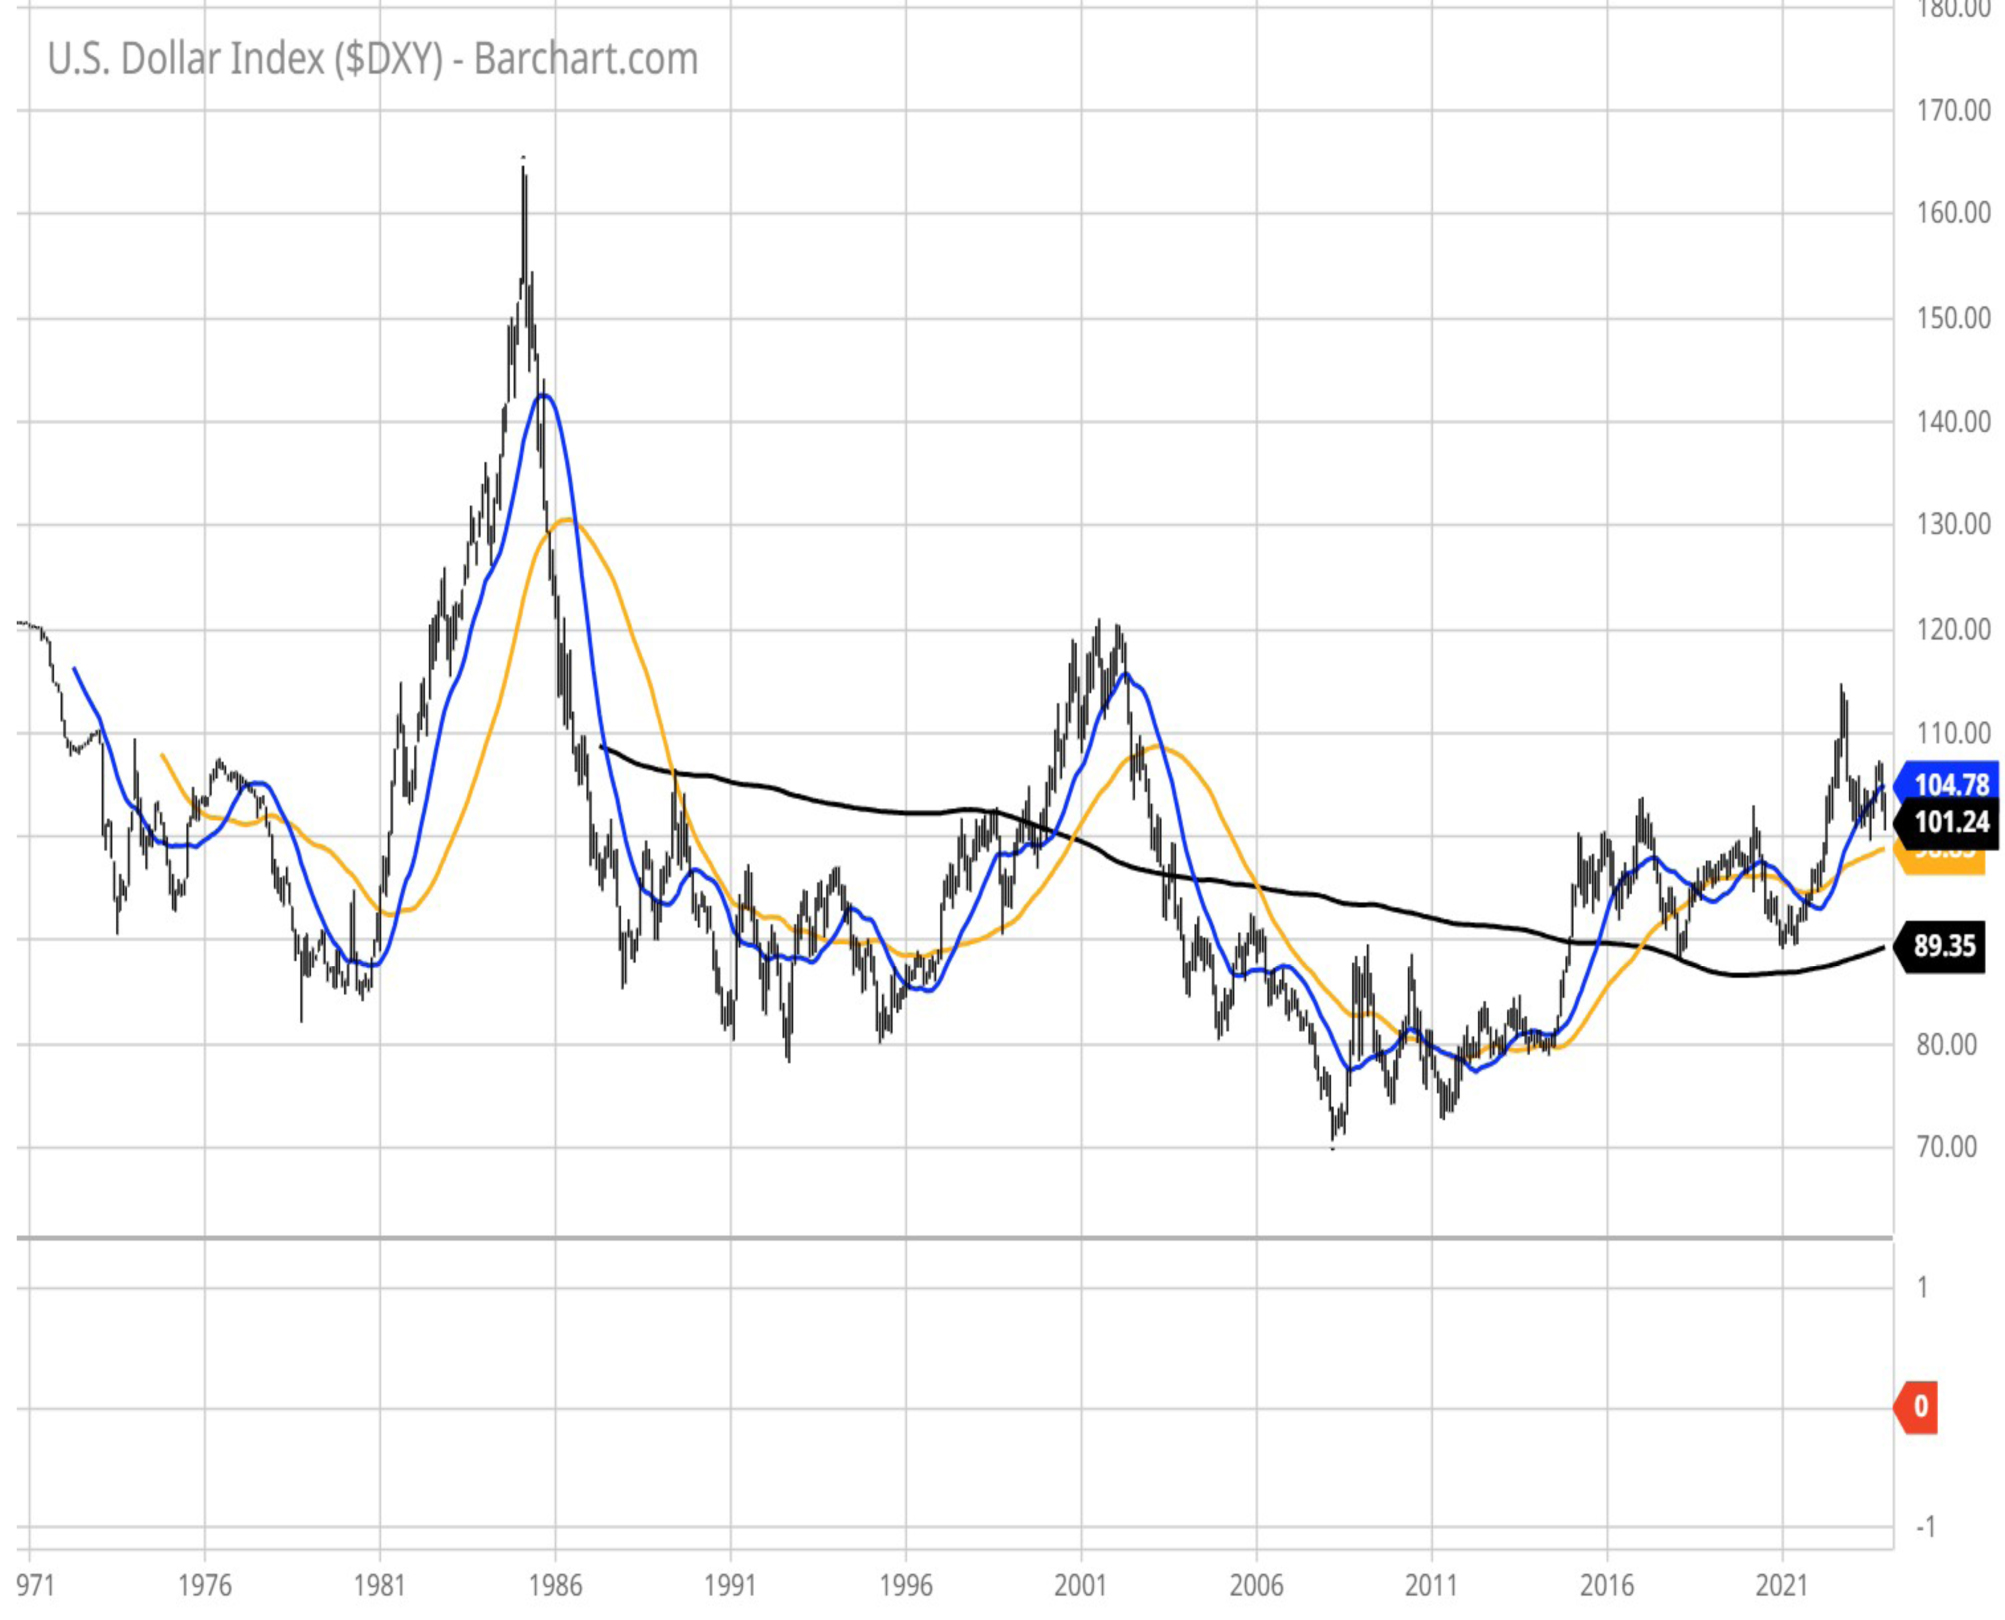
After the United States abandoned the gold standard, the U.S. dollar index (DXY) was established in 1973 as a measure of the value of the U.S. dollar relative to a basket of foreign currencies. After the euro took over the previous role of the German mark, French franc, Italian lira, Spanish peso and other eurozone currencies in 1999, the euro became the largest component of the U.S. Dollar index, making up 57.6% of the basket. The weights of the rest of the currencies in the index are, in order, the Japanese yen (13.6%), British pound (11.9%), Canadian dollar (9.1%), Swedish krona (4.2%) and Swiss franc (3.6%).
The history of the dollar index (DXY) going back to 1973 has shown a path of relative stability, with the exception of the major dollar spike in the 1984-1985 period. Big increases in government spending to revive the economy back then drove up long-term interest rates, thereby attracting capital inflows which, in turn, pushed the value of the dollar up, as dollar-denominated Treasuries were highly desirable.
Going back to early October 2023, bond traders started sniffing out that the Fed was about to change the narrative as the inflation data cooled. And they were right. Treasury yields on the long end of the curve have plunged a full 125 basis points since then. When bond yields decrease, the value of the underlying currency tends to decrease as well, especially when factoring in more than $33 trillion in national debt.
Graphs are for illustrative and discussion purposes only. Please read important disclosures at the end of this commentary.
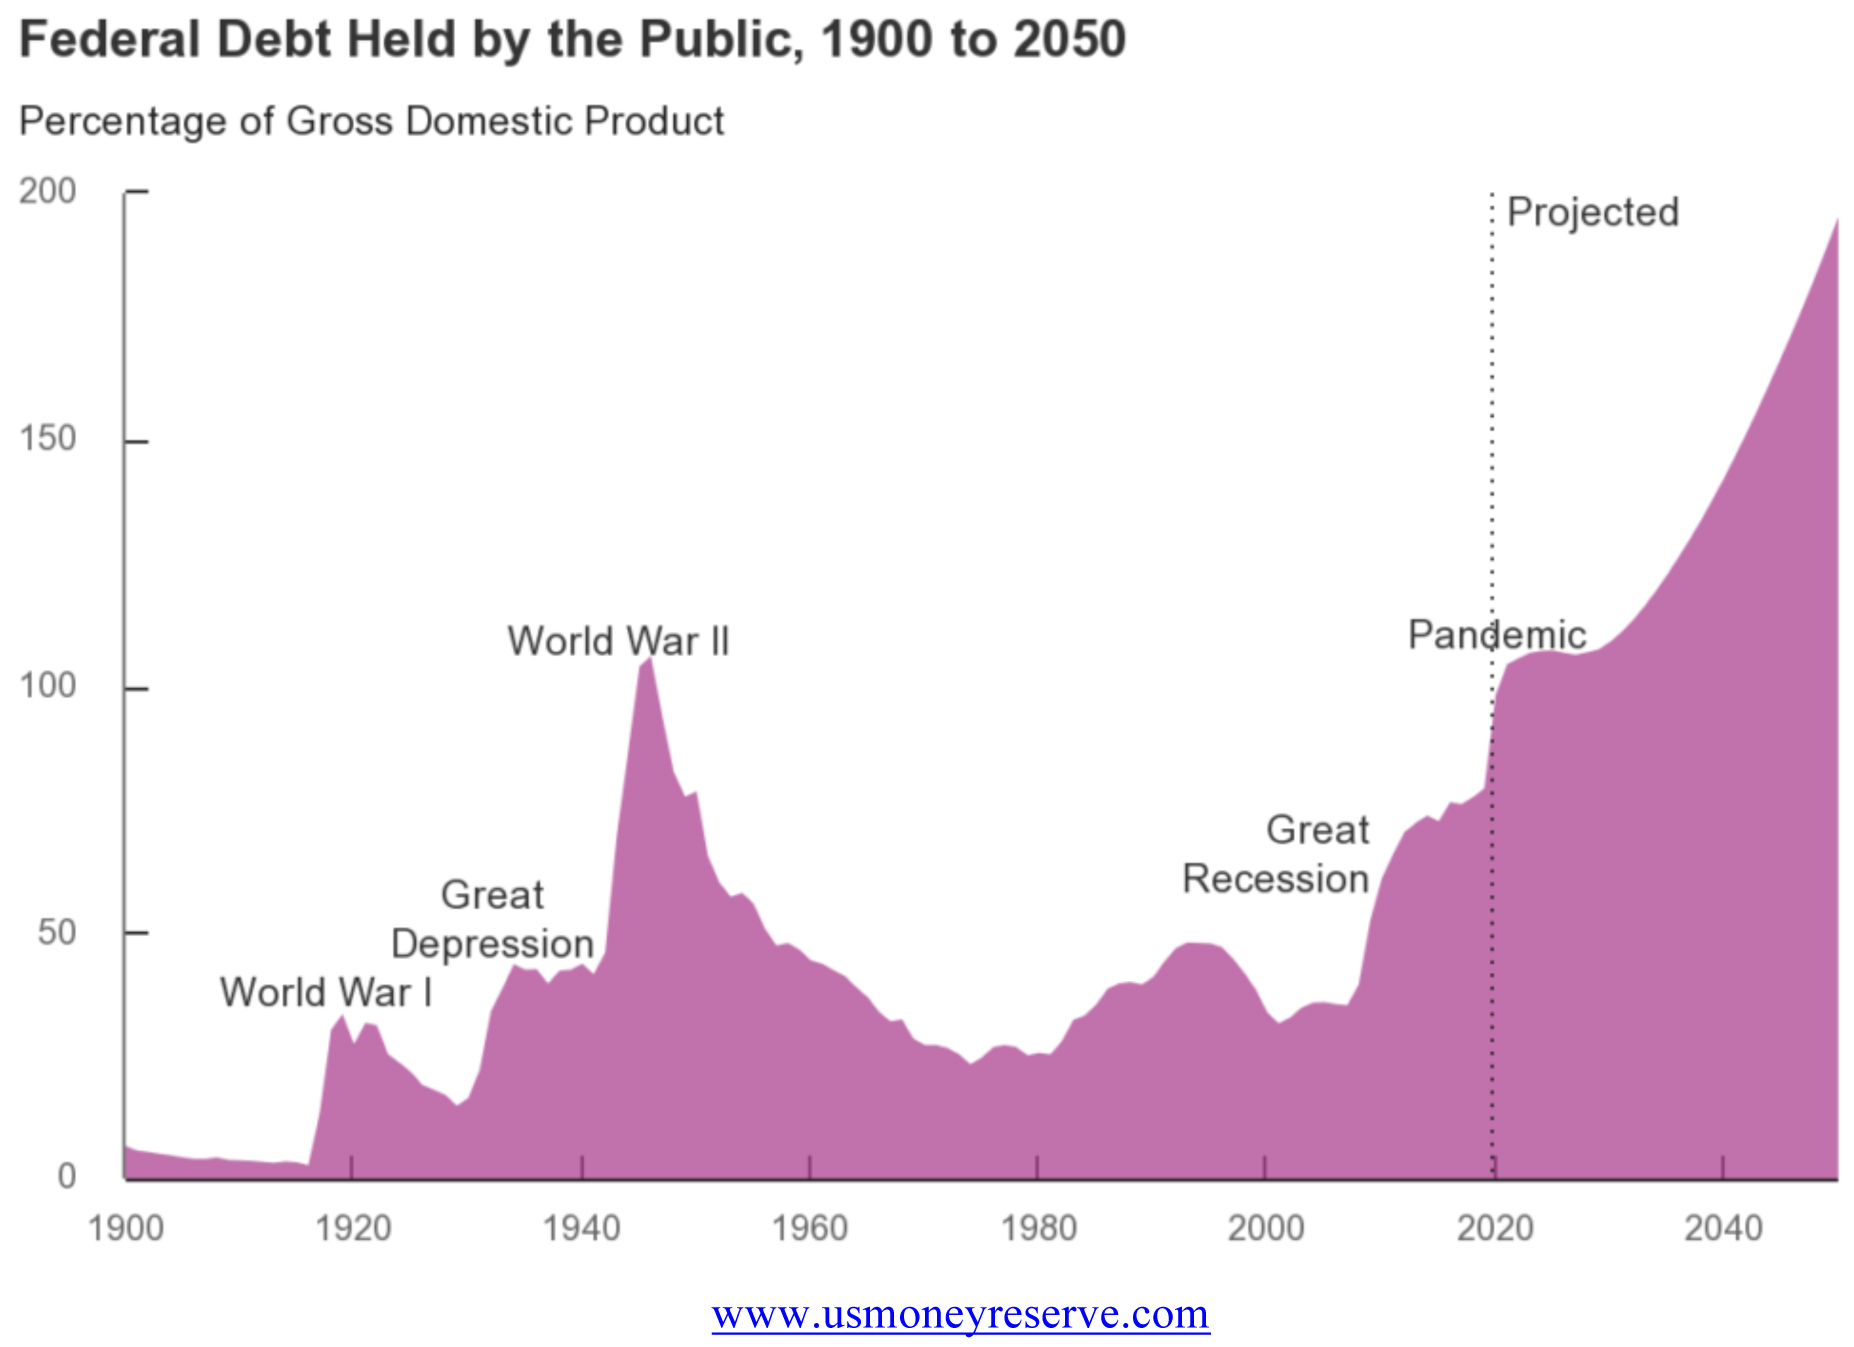
In the past 15 months, the DXY has fallen from 113.3 to 101.2, representing a big devaluation against the basket of currencies noted above. A breach of the 100 level would be technically bearish for the dollar over the near term, inviting another 10-point downside risk. The quandary for the Fed is that they need to see interest rates at exceptionally low levels in order to service the soaring interest on the federal debt.
At the same time, in doing so, currency traders will likely pressure the dollar lower until there is serious conviction at the Congressional level to tackle the budget deficit and the long-term debt balloon.
Graphs are for illustrative and discussion purposes only. Please read important disclosures at the end of this commentary.
This is a problematic scenario that must be addressed soon. If the world begins to lose faith in the ability of the United States to resolve its debt burden, then the value of the dollar will very likely break down, forcing bond yields higher to attract capital at Treasury auctions to finance spending and debt service.
This is a monumental problem that has been in the making for years and is now approaching an inflection point. While there is no other world currency that can realistically replace King dollar, there is much consternation about where to find safety from highly leveraged fiat currencies that are losing value, because central banks of developed countries binged on quantitative easing and now sit on tens of trillions of dollars in debt with little to no realistic plans to pay down the debt anytime soon.
Hence, the value of the euro, yen, pound and even Canada’s Loonie are also in protracted downtrends.
So, where is the safe zone?
The Swiss franc.
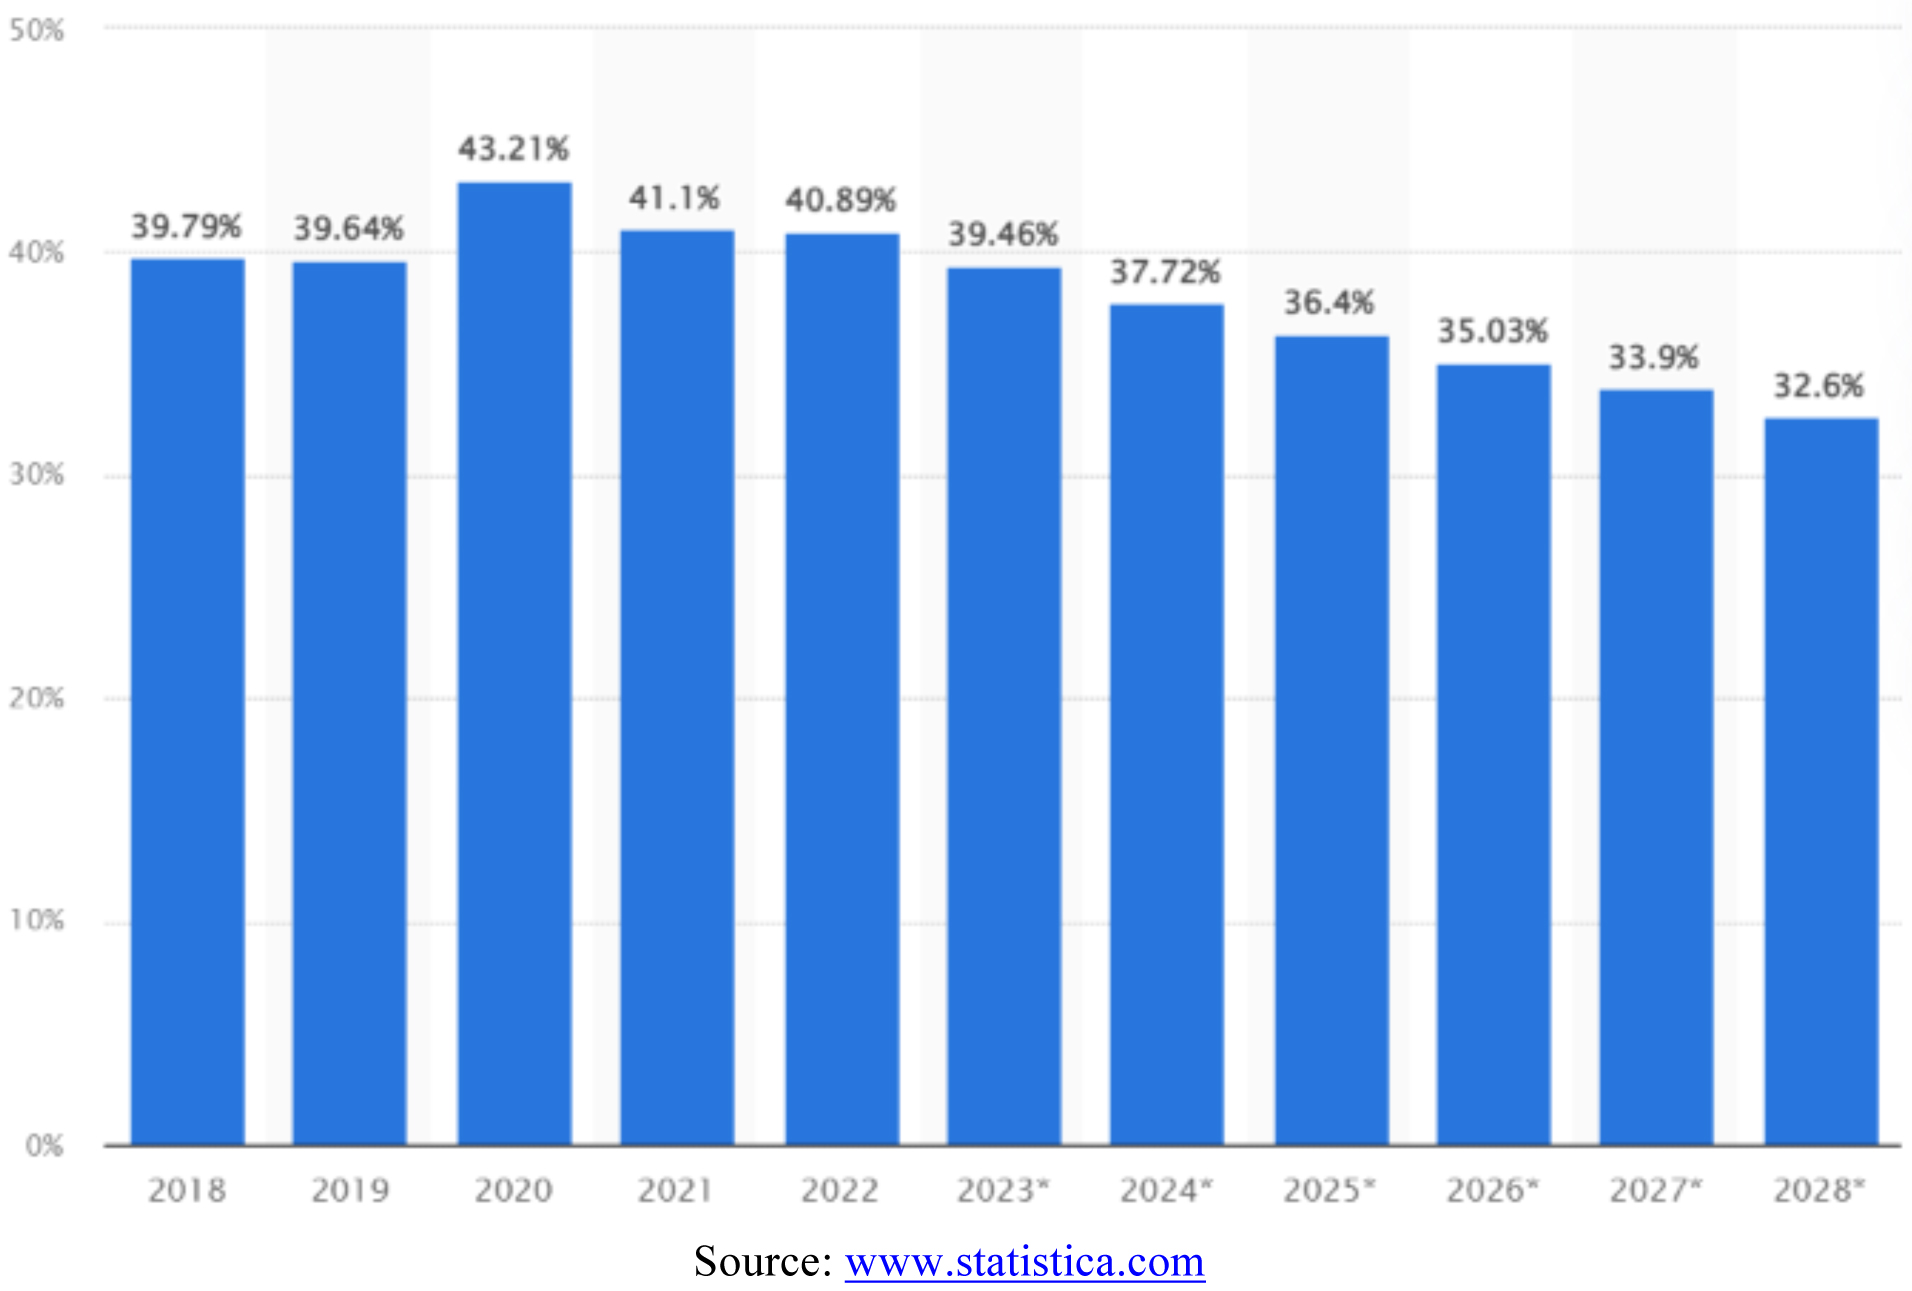
With a debt-to-GDP ratio under 40%, Switzerland has one of the lowest debt levels in terms of its national output of any developed country, and this ratio is forecast to decrease to 32.6% by 2028.
Switzerland: Falling national debt in relation to GDP, 2018 to 2028
Graphs are for illustrative and discussion purposes only. Please read important disclosures at the end of this commentary.
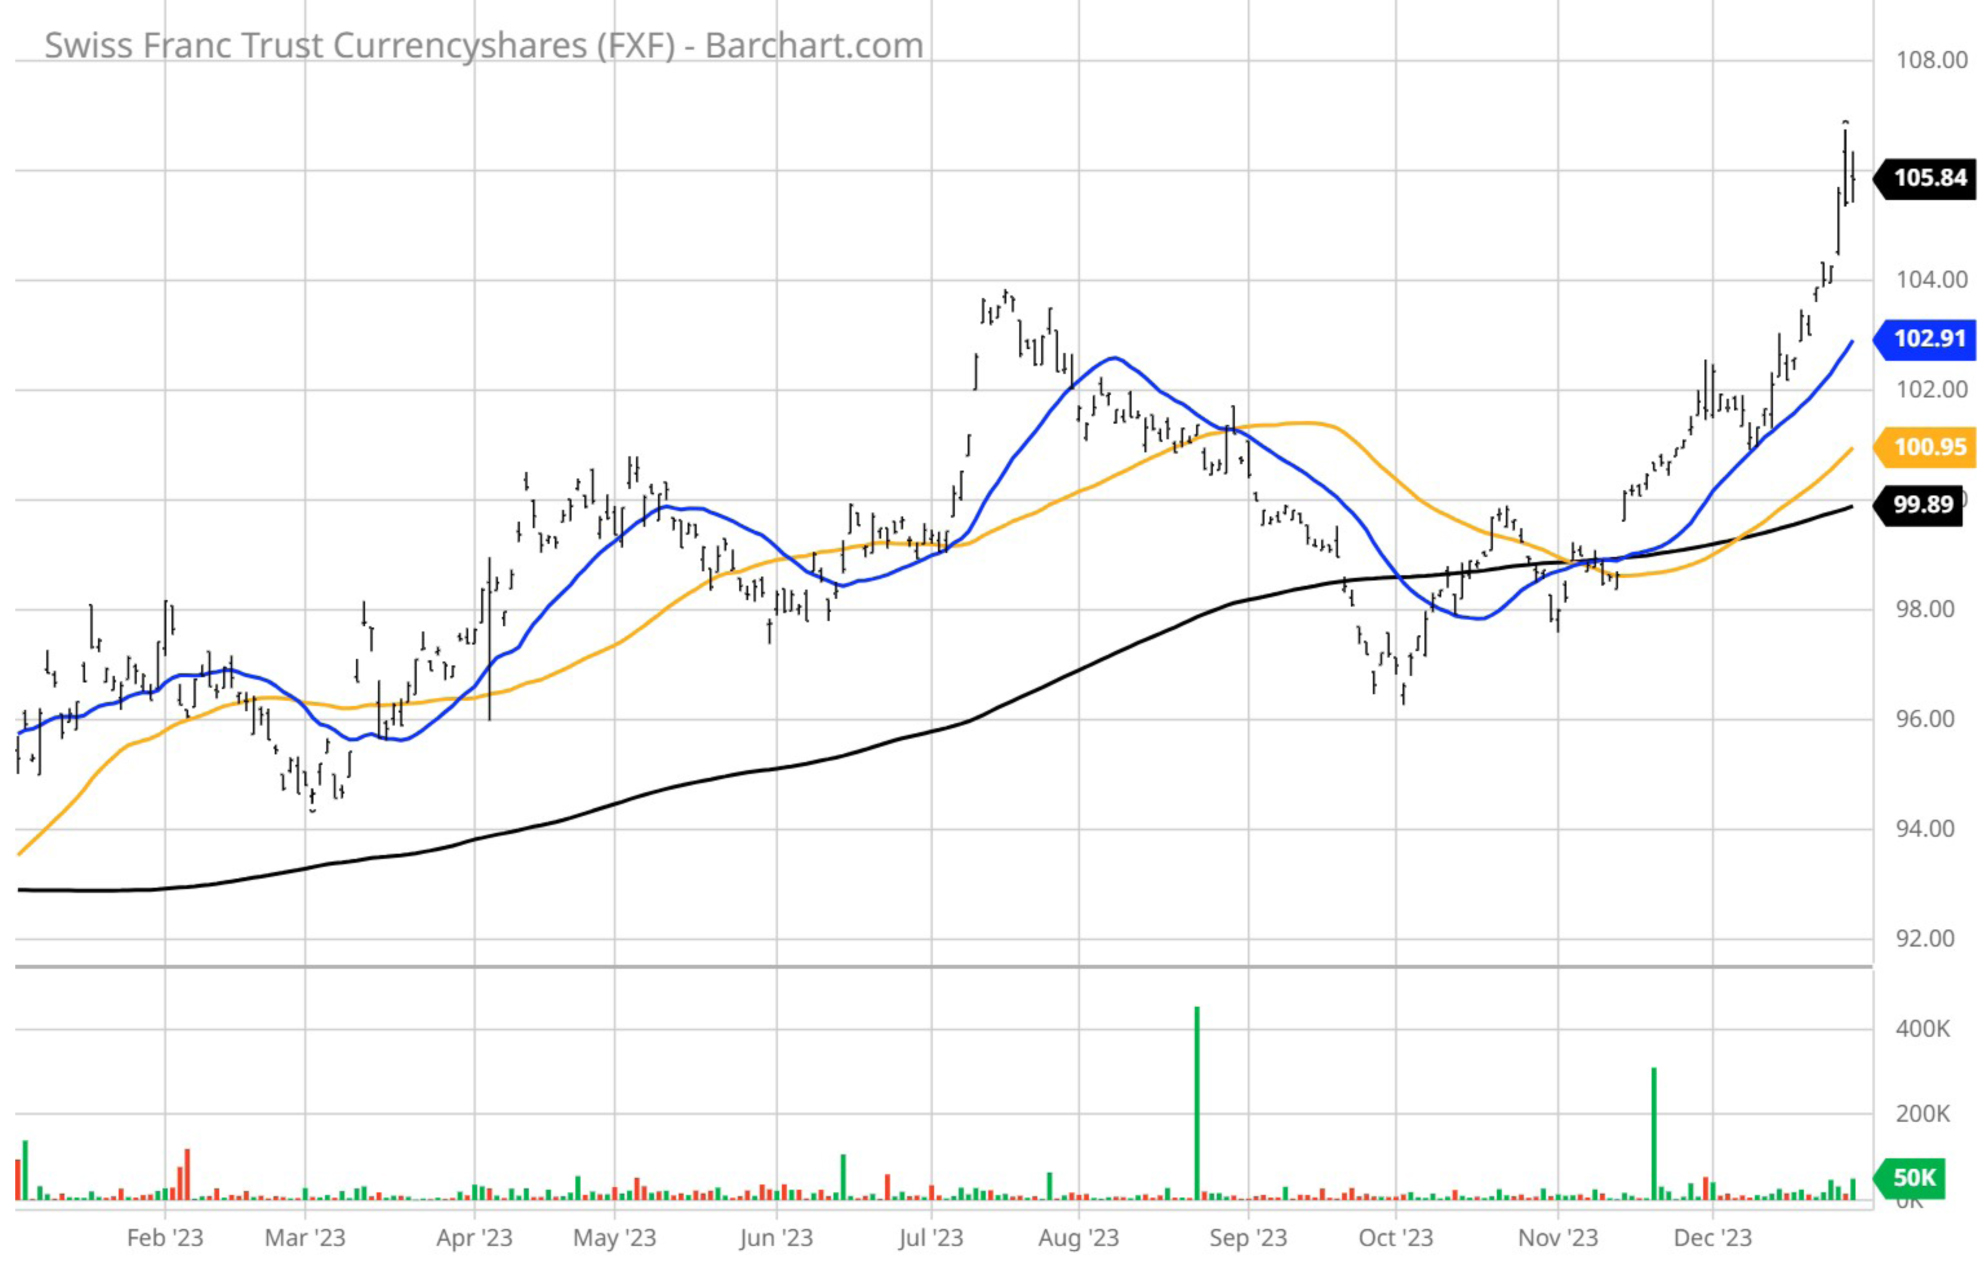
In this world of rising debts, this trend is remarkable. Plus, Swiss accounts have always been a storehouse of wealth over generations of global financial upheaval and wars. Shares of the Invesco Currency Shares Swiss Franc Trust ETF (FXF) are, in my view, a strong place to own Swiss Francs in the form of an ETF without having to store the physical currency in a safe or in a safety deposit box at a bank.
The bullish move by FXF shares is a strong indicator of where money is flowing to offset the devaluation of the dollar. Unless the 2024 U.S. election reveals a new voter attitude and conviction to address the debt bomb facing the U.S., owning FXF could be one of the bigger winning trades of 2024 and well beyond.
Graphs are for illustrative and discussion purposes only. Please read important disclosures at the end of this commentary.
All content above represents the opinion of Bryan Perry of Navellier & Associates, Inc.
Also In This Issue
A Look Ahead by Louis Navellier
Will Guyana Become Britain’s Next “Falklands War”?
Income Mail by Bryan Perry
Rising Debt is Weighing Down King Dollar’s Reign
Growth Mail by Gary Alexander
It’s Decision Time: Roaring ‘20s or Stagnant ‘70s?
Global Mail by Ivan Martchev
Emerging Markets are Overdue to Outperform
Sector Spotlight by Jason Bodner
Comparing Rapid Recoveries: Late 2023 vs. Mid-2020
View Full Archive
Read Past Issues Here

Bryan Perry
SENIOR DIRECTOR
Bryan Perry is a Senior Director with Navellier Private Client Group, advising and facilitating high net worth investors in the pursuit of their financial goals.
Bryan’s financial services career spanning the past three decades includes over 20 years of wealth management experience with Wall Street firms that include Bear Stearns, Lehman Brothers and Paine Webber, working with both retail and institutional clients. Bryan earned a B.A. in Political Science from Virginia Polytechnic Institute & State University and currently holds a Series 65 license. All content of “Income Mail” represents the opinion of Bryan Perry
Important Disclosures:
Although information in these reports has been obtained from and is based upon sources that Navellier believes to be reliable, Navellier does not guarantee its accuracy and it may be incomplete or condensed. All opinions and estimates constitute Navellier’s judgment as of the date the report was created and are subject to change without notice. These reports are for informational purposes only and are not a solicitation for the purchase or sale of a security. Any decision to purchase securities mentioned in these reports must take into account existing public information on such securities or any registered prospectus.To the extent permitted by law, neither Navellier & Associates, Inc., nor any of its affiliates, agents, or service providers assumes any liability or responsibility nor owes any duty of care for any consequences of any person acting or refraining to act in reliance on the information contained in this communication or for any decision based on it.
Past performance is no indication of future results. Investment in securities involves significant risk and has the potential for partial or complete loss of funds invested. It should not be assumed that any securities recommendations made by Navellier. in the future will be profitable or equal the performance of securities made in this report. Dividend payments are not guaranteed. The amount of a dividend payment, if any, can vary over time and issuers may reduce dividends paid on securities in the event of a recession or adverse event affecting a specific industry or issuer.
None of the stock information, data, and company information presented herein constitutes a recommendation by Navellier or a solicitation to buy or sell any securities. Any specific securities identified and described do not represent all of the securities purchased, sold, or recommended for advisory clients. The holdings identified do not represent all of the securities purchased, sold, or recommended for advisory clients and the reader should not assume that investments in the securities identified and discussed were or will be profitable.
Information presented is general information that does not take into account your individual circumstances, financial situation, or needs, nor does it present a personalized recommendation to you. Individual stocks presented may not be suitable for every investor. Investment in securities involves significant risk and has the potential for partial or complete loss of funds invested. Investment in fixed income securities has the potential for the investment return and principal value of an investment to fluctuate so that an investor’s holdings, when redeemed, may be worth less than their original cost.
One cannot invest directly in an index. Index is unmanaged and index performance does not reflect deduction of fees, expenses, or taxes. Presentation of Index data does not reflect a belief by Navellier that any stock index constitutes an investment alternative to any Navellier equity strategy or is necessarily comparable to such strategies. Among the most important differences between the Indices and Navellier strategies are that the Navellier equity strategies may (1) incur material management fees, (2) concentrate its investments in relatively few stocks, industries, or sectors, (3) have significantly greater trading activity and related costs, and (4) be significantly more or less volatile than the Indices.
ETF Risk: We may invest in exchange traded funds (“ETFs”) and some of our investment strategies are generally fully invested in ETFs. Like traditional mutual funds, ETFs charge asset-based fees, but they generally do not charge initial sales charges or redemption fees and investors typically pay only customary brokerage fees to buy and sell ETF shares. The fees and costs charged by ETFs held in client accounts will not be deducted from the compensation the client pays Navellier. ETF prices can fluctuate up or down, and a client account could lose money investing in an ETF if the prices of the securities owned by the ETF go down. ETFs are subject to additional risks:
- ETF shares may trade above or below their net asset value;
- An active trading market for an ETF’s shares may not develop or be maintained;
- The value of an ETF may be more volatile than the underlying portfolio of securities the ETF is designed to track;
- The cost of owning shares of the ETF may exceed those a client would incur by directly investing in the underlying securities; and
- Trading of an ETF’s shares may be halted if the listing exchange’s officials deem it appropriate, the shares are delisted from the exchange, or the activation of market-wide “circuit breakers” (which are tied to large decreases in stock prices) halts stock trading generally.
Grader Disclosures: Investment in equity strategies involves substantial risk and has the potential for partial or complete loss of funds invested. The sample portfolio and any accompanying charts are for informational purposes only and are not to be construed as a solicitation to buy or sell any financial instrument and should not be relied upon as the sole factor in an investment making decision. As a matter of normal and important disclosures to you, as a potential investor, please consider the following: The performance presented is not based on any actual securities trading, portfolio, or accounts, and the reported performance of the A, B, C, D, and F portfolios (collectively the “model portfolios”) should be considered mere “paper” or pro forma performance results based on Navellier’s research.
Investors evaluating any of Navellier & Associates, Inc.’s, (or its affiliates’) Investment Products must not use any information presented here, including the performance figures of the model portfolios, in their evaluation of any Navellier Investment Products. Navellier Investment Products include the firm’s mutual funds and managed accounts. The model portfolios, charts, and other information presented do not represent actual funded trades and are not actual funded portfolios. There are material differences between Navellier Investment Products’ portfolios and the model portfolios, research, and performance figures presented here. The model portfolios and the research results (1) may contain stocks or ETFs that are illiquid and difficult to trade; (2) may contain stock or ETF holdings materially different from actual funded Navellier Investment Product portfolios; (3) include the reinvestment of all dividends and other earnings, estimated trading costs, commissions, or management fees; and, (4) may not reflect prices obtained in an actual funded Navellier Investment Product portfolio. For these and other reasons, the reported performances of model portfolios do not reflect the performance results of Navellier’s actually funded and traded Investment Products. In most cases, Navellier’s Investment Products have materially lower performance results than the performances of the model portfolios presented.
This report contains statements that are, or may be considered to be, forward-looking statements. All statements that are not historical facts, including statements about our beliefs or expectations, are “forward-looking statements” within the meaning of The U.S. Private Securities Litigation Reform Act of 1995. These statements may be identified by such forward-looking terminology as “expect,” “estimate,” “plan,” “intend,” “believe,” “anticipate,” “may,” “will,” “should,” “could,” “continue,” “project,” or similar statements or variations of such terms. Our forward-looking statements are based on a series of expectations, assumptions, and projections, are not guarantees of future results or performance, and involve substantial risks and uncertainty as described in Form ADV Part 2A of our filing with the Securities and Exchange Commission (SEC), which is available at www.adviserinfo.sec.gov or by requesting a copy by emailing info@navellier.com. All of our forward-looking statements are as of the date of this report only. We can give no assurance that such expectations or forward-looking statements will prove to be correct. Actual results may differ materially. You are urged to carefully consider all such factors.
FEDERAL TAX ADVICE DISCLAIMER: As required by U.S. Treasury Regulations, you are informed that, to the extent this presentation includes any federal tax advice, the presentation is not written by Navellier to be used, and cannot be used, for the purpose of avoiding federal tax penalties. Navellier does not advise on any income tax requirements or issues. Use of any information presented by Navellier is for general information only and does not represent tax advice either express or implied. You are encouraged to seek professional tax advice for income tax questions and assistance.
IMPORTANT NEWSLETTER DISCLOSURE:The hypothetical performance results for investment newsletters that are authored or edited by Louis Navellier, including Louis Navellier’s Growth Investor, Louis Navellier’s Breakthrough Stocks, Louis Navellier’s Accelerated Profits, and Louis Navellier’s Platinum Club, are not based on any actual securities trading, portfolio, or accounts, and the newsletters’ reported hypothetical performances should be considered mere “paper” or proforma hypothetical performance results and are not actual performance of real world trades. Navellier & Associates, Inc. does not have any relation to or affiliation with the owner of these newsletters. There are material differences between Navellier Investment Products’ portfolios and the InvestorPlace Media, LLC newsletter portfolios authored by Louis Navellier. The InvestorPlace Media, LLC newsletters contain hypothetical performance that do not include transaction costs, advisory fees, or other fees a client might incur if actual investments and trades were being made by an investor. As a result, newsletter performance should not be used to evaluate Navellier Investment services which are separate and different from the newsletters. The owner of the newsletters is InvestorPlace Media, LLC and any questions concerning the newsletters, including any newsletter advertising or hypothetical Newsletter performance claims, (which are calculated solely by Investor Place Media and not Navellier) should be referred to InvestorPlace Media, LLC at (800) 718-8289.
Please note that Navellier & Associates and the Navellier Private Client Group are managed completely independent of the newsletters owned and published by InvestorPlace Media, LLC and written and edited by Louis Navellier, and investment performance of the newsletters should in no way be considered indicative of potential future investment performance for any Navellier & Associates separately managed account portfolio. Potential investors should consult with their financial advisor before investing in any Navellier Investment Product.
Navellier claims compliance with Global Investment Performance Standards (GIPS). To receive a complete list and descriptions of Navellier’s composites and/or a presentation that adheres to the GIPS standards, please contact Navellier or click here. It should not be assumed that any securities recommendations made by Navellier & Associates, Inc. in the future will be profitable or equal the performance of securities made in this report.
FactSet Disclosure: Navellier does not independently calculate the statistical information included in the attached report. The calculation and the information are provided by FactSet, a company not related to Navellier. Although information contained in the report has been obtained from FactSet and is based on sources Navellier believes to be reliable, Navellier does not guarantee its accuracy, and it may be incomplete or condensed. The report and the related FactSet sourced information are provided on an “as is” basis. The user assumes the entire risk of any use made of this information. Investors should consider the report as only a single factor in making their investment decision. The report is for informational purposes only and is not intended as an offer or solicitation for the purchase or sale of a security. FactSet sourced information is the exclusive property of FactSet. Without prior written permission of FactSet, this information may not be reproduced, disseminated or used to create any financial products. All indices are unmanaged and performance of the indices include reinvestment of dividends and interest income, unless otherwise noted, are not illustrative of any particular investment and an investment cannot be made in any index. Past performance is no guarantee of future results.