by Jason Bodner
December 12, 2023
Time distorts perspective. Most of us have heard of the Pony Express – that romanticized mail service of the 1860s. Many think it lasted for years, but it turns out that the Pony Express only lasted 18 months and it was a colossal financial failure, losing $13 per letter in today’s money!
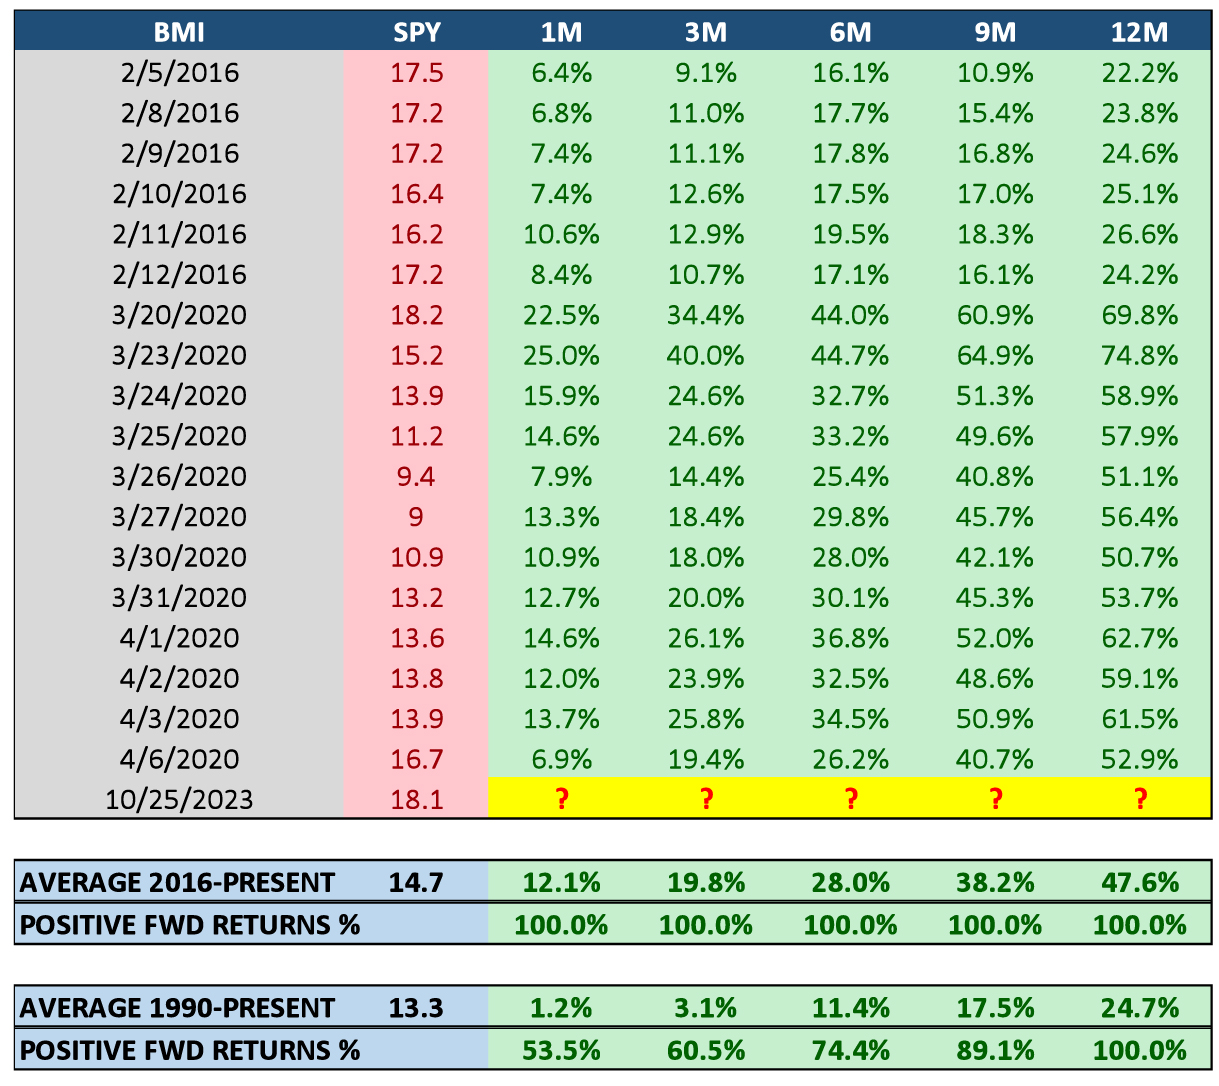
The same phenomenon happens when we look at our brokerage accounts. Our down periods feel like they last forever, and our good times never seem to last long enough. Well, I hope you’ve been enjoying the market’s recovery. The three-month swoon from July 31 to October 30 has given way to a flood of capital back into stocks. November was one the best months in the last 30+ years for the S&P 500, but you had plenty of data on your side to tell you that this might come. The Big Money Index (BMI) went oversold in late October, and once it fell below 19, I showed you how that 100% of the time (since 1990) stocks were higher after 1, 3, 6, 9, and 12 months. In fact, I showed you this table on October 31:
Graphs are for illustrative and discussion purposes only. Please read important disclosures at the end of this commentary.
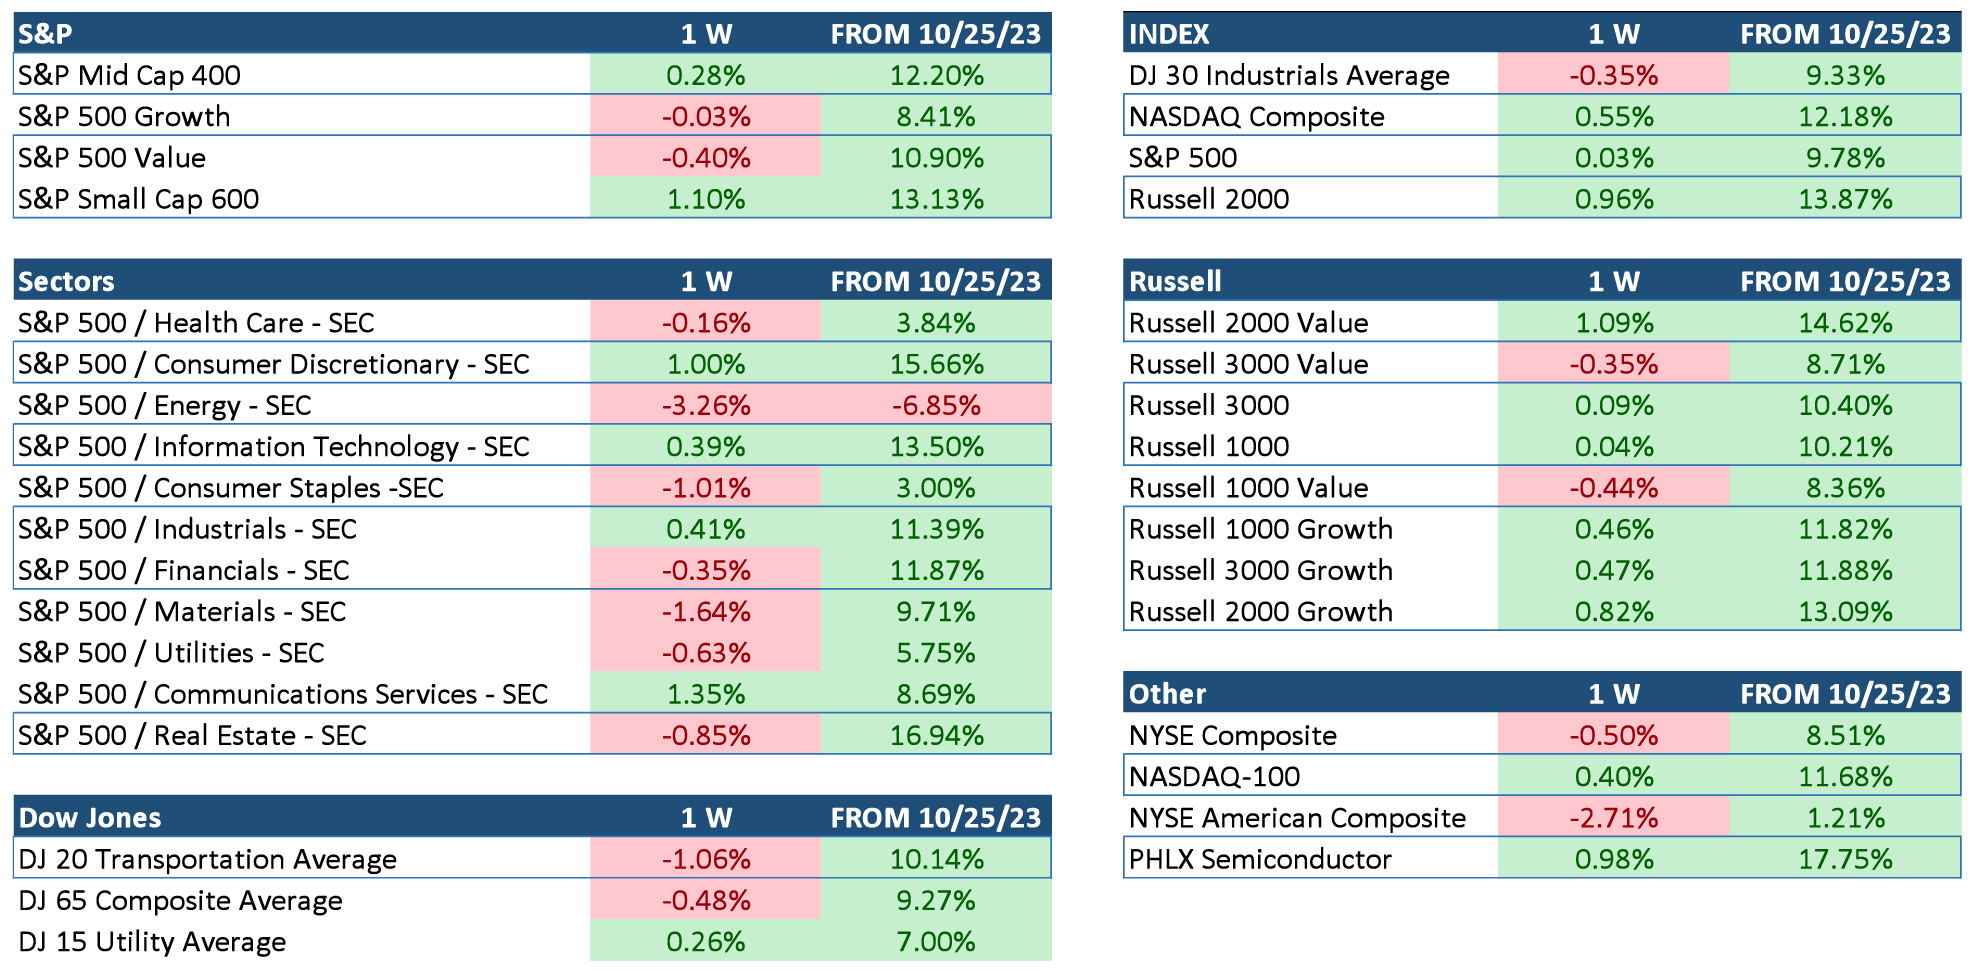
Now, the numbers are in, and with November’s stellar performance, the 1-month statistics remain “undefeated” at 100% wins. It is interesting to see what led us higher since then. I highlighted (below), the indexes that surged by 10% or more. There is a common theme here – growth and small caps:
Graphs are for illustrative and discussion purposes only. Please read important disclosures at the end of this commentary.
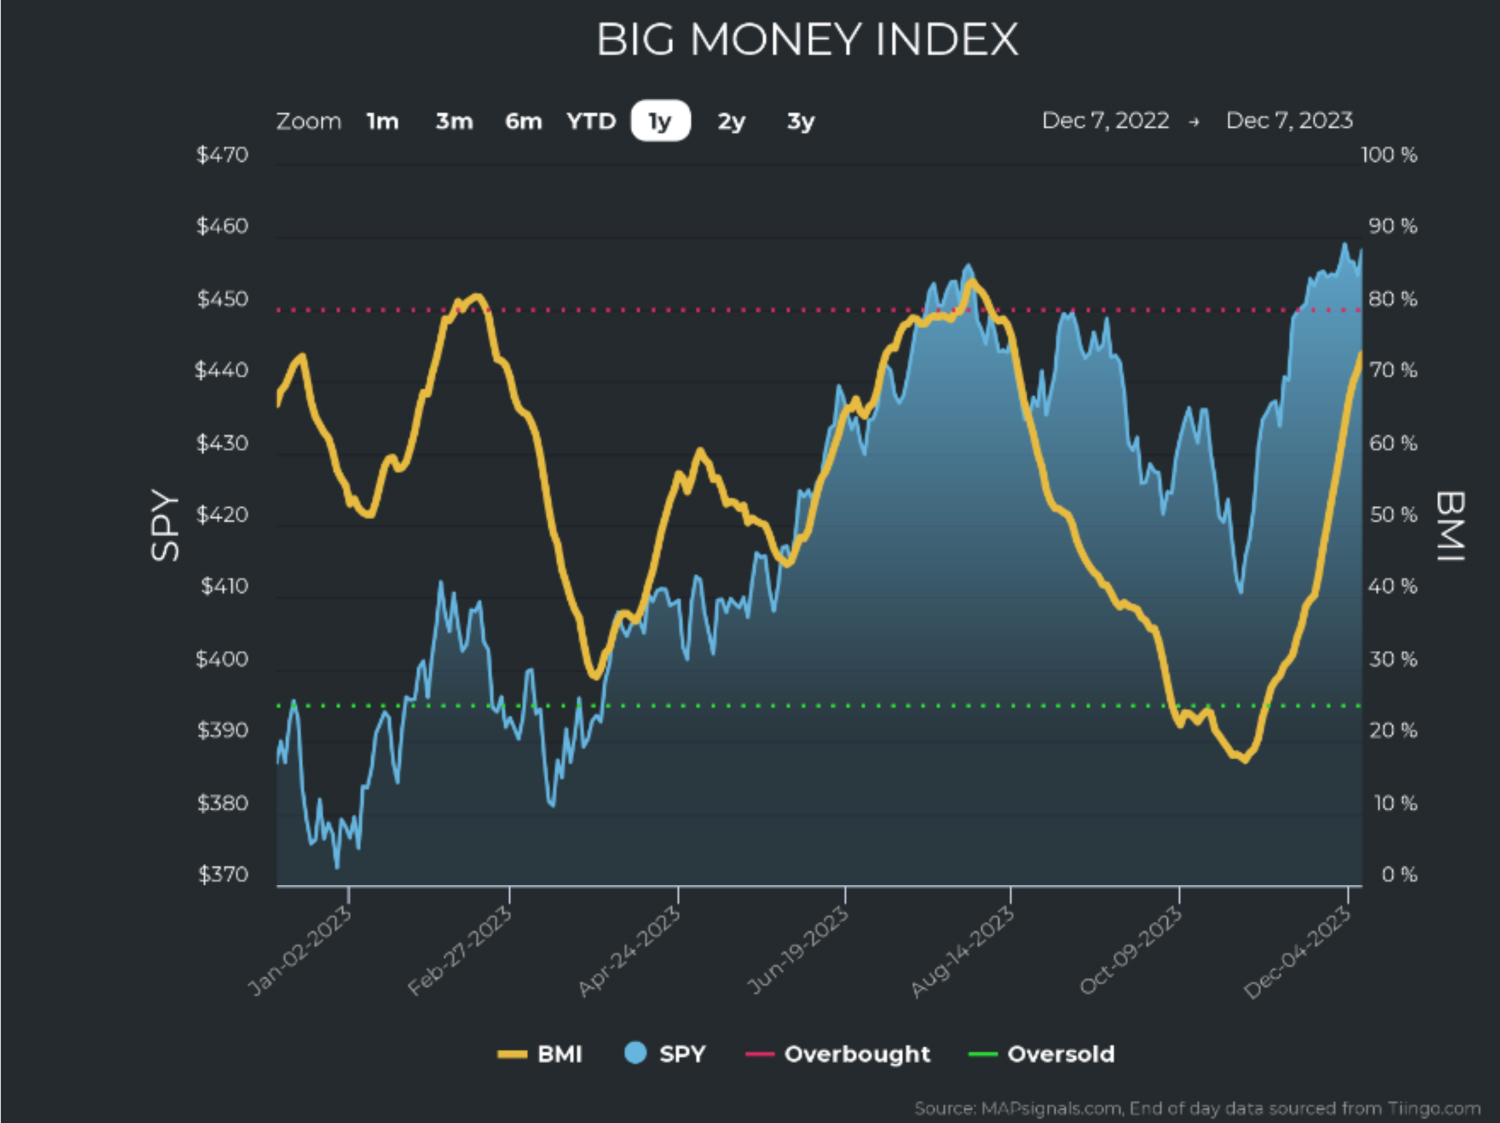
Now, when that table went out, on October 31, the BMI was below 19%, meaning that 19% or fewer of all unusually large trading signals were buys. At that time I predicted a rise, and look at how things went from there: The BMI is now over 70%, and it shows no sign of slowing down:
Graphs are for illustrative and discussion purposes only. Please read important disclosures at the end of this commentary.
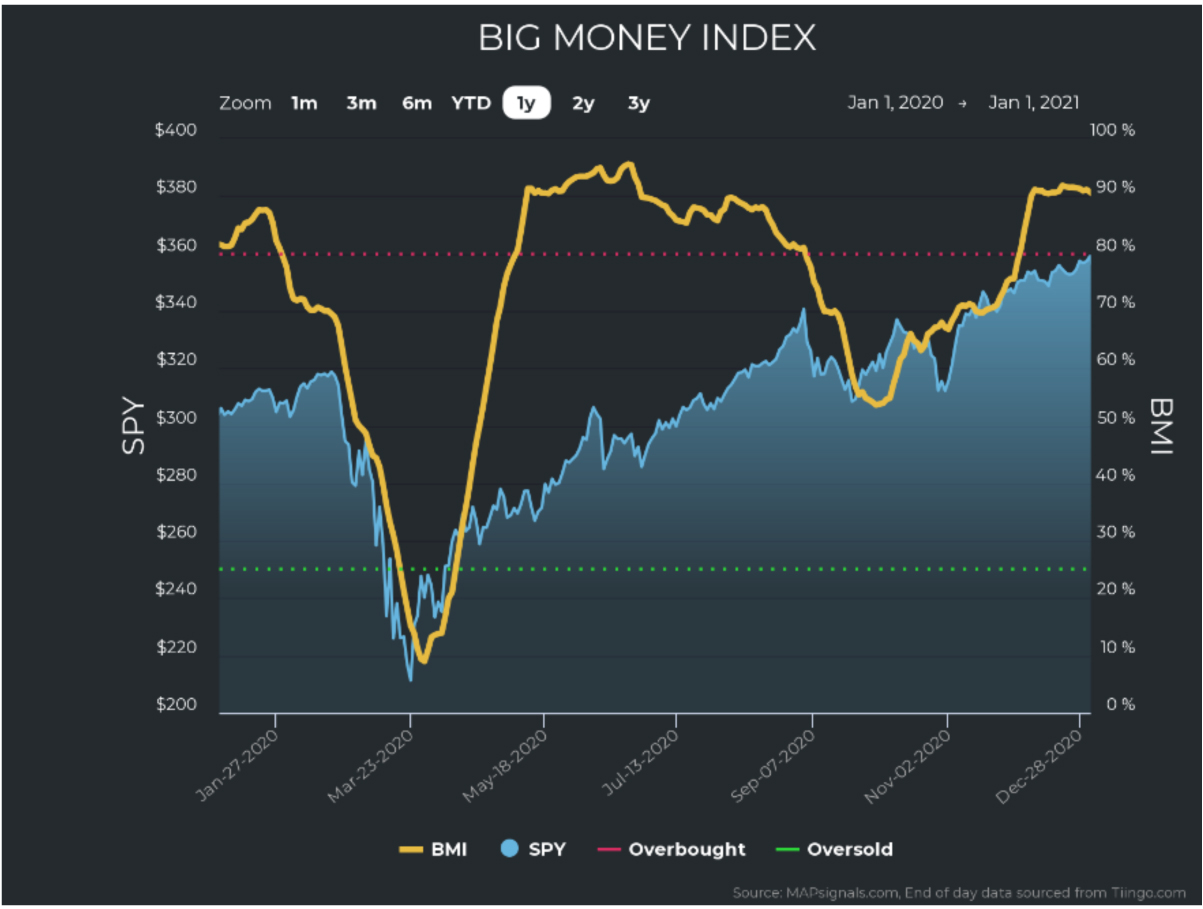
This euphoria could feel a bit disconcerting, as in – “oh no – here we go again.” It would be natural to be wary of another downdraft in stocks – especially after such a meteoric rise. That’s because the Big Money Index is now headed towards overbought territory. But it is important to understand that it’s not so much when the BMI goes overbought as when it falls from overbought. A perfect way to illustrate this is by looking at the BMI during COVID. As the world entered lock-down, the BMI fell like a rock. Then, we all remember, a spectacular rally followed. Within a few weeks, the BMI went from oversold to overbought.
If traders had dumped stocks as soon as the BMI hit overbought, they would have missed out on huge gains. In 2020, the BMI stayed overbought for a stunning 87 days! Only when it fell from overbought did we enter a sustained period of volatility:
Graphs are for illustrative and discussion purposes only. Please read important disclosures at the end of this commentary.
We can also see how the selling evaporated and gave way to significant buying. On the left, we see that unusual buying in stocks spiked significantly in November. The same is seen for ETFs, on the right.
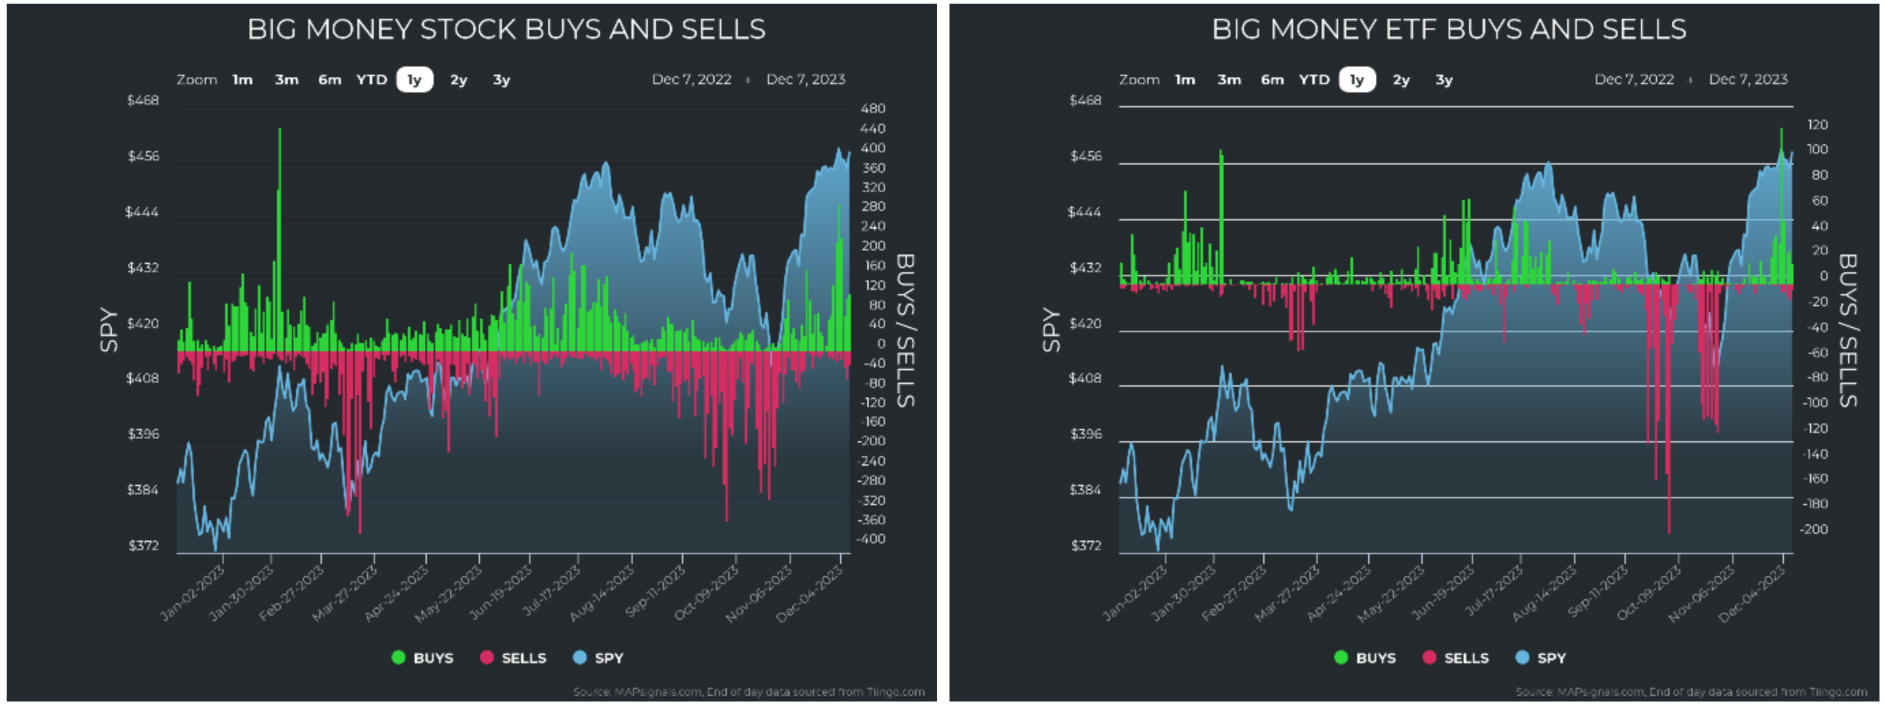
Graphs are for illustrative and discussion purposes only. Please read important disclosures at the end of this commentary.
What’s conspicuous is the lack of red bars lately, indicating that the selling has almost vanished:
Since the rally began in November, the inflows were focused on small-cap and mid-cap stocks:
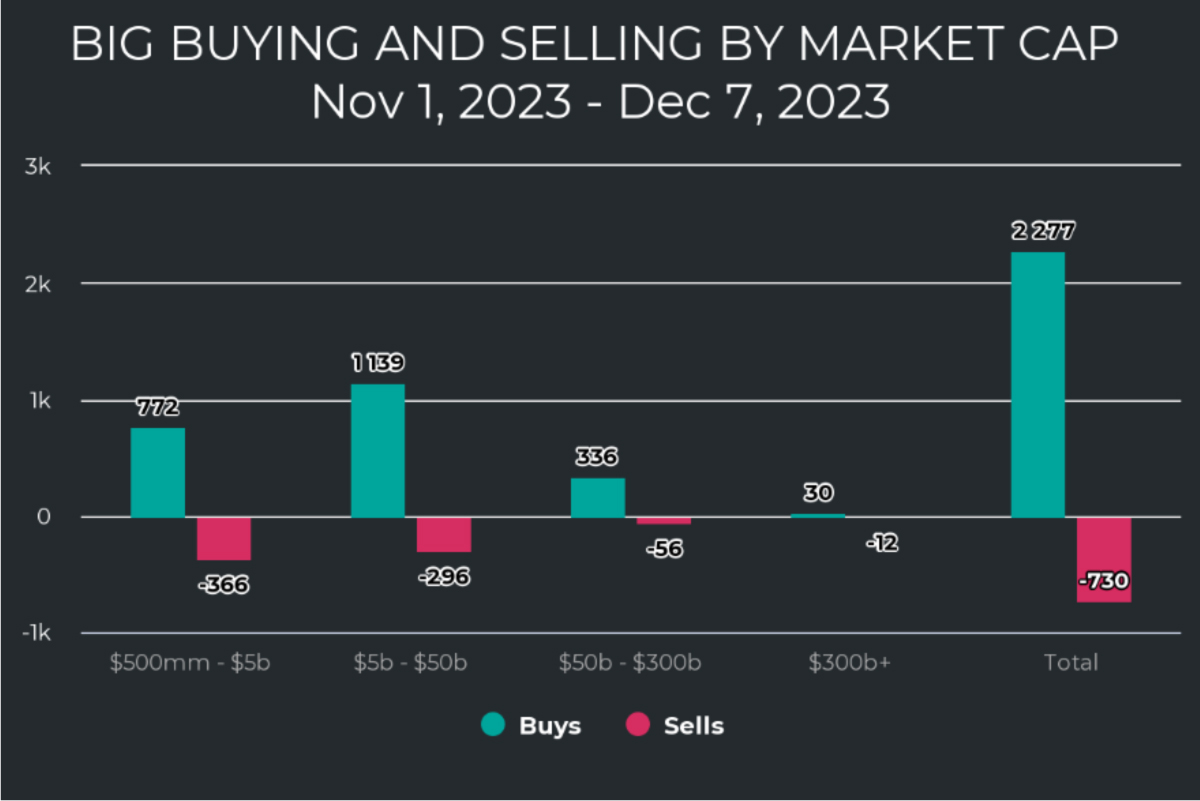
Graphs are for illustrative and discussion purposes only. Please read important disclosures at the end of this commentary.
These observations help contextualize that this rally is real and could last for quite a while.
Now, let’s look at the leading sectors. What is interesting is that we see growth areas collecting capital, the seeds of long-term bull markets. Tech, Discretionary, Industrials, and Financials powered this rally. Perhaps the biggest surprise is Real Estate surging nearly 17%. This is a mean reversion phenomenon, but it also highlights the fact that investors feel that rates have peaked and will potentially fall next year.
REITs (which litter the Real Estate sector) are legally required to pay out between 70% and 90% of their profits in the form of a dividend. This typically gives the sector an enticing place to find yield. Yet as rates rose of late, the sector became less compelling. Also, with real estate development in question, the sector became undesirable. Yet now, here we are with a massive rally as rates seem certain to head lower.
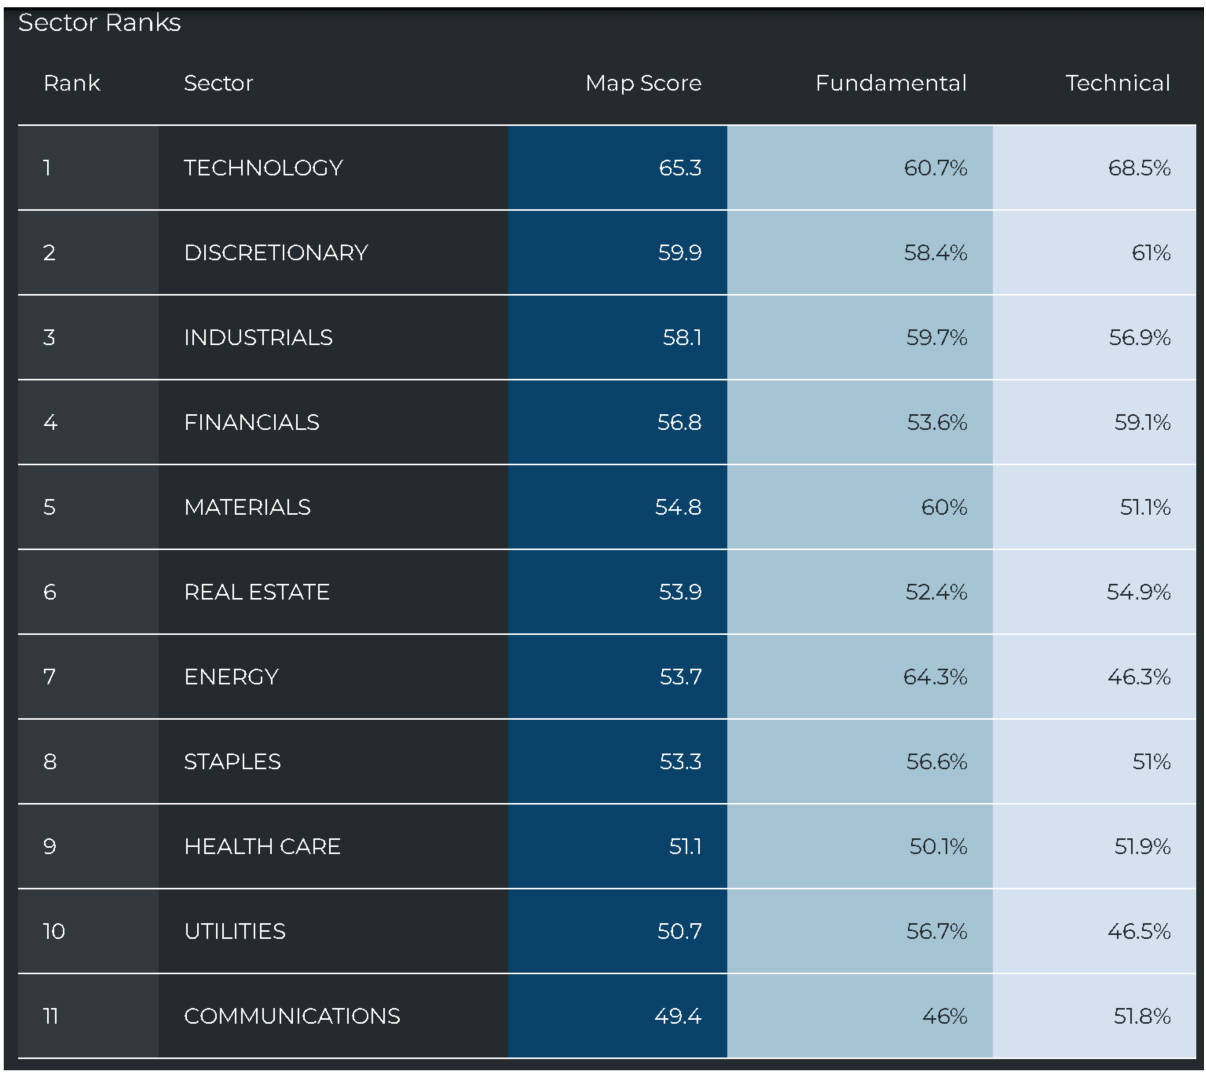
Graphs are for illustrative and discussion purposes only. Please read important disclosures at the end of this commentary.
Looking at the distribution of buying and selling on a sector level, we see very constructive action. Nearly every sector (9 of 11) has seen notable unusual buying. Tech, Discretionary, Industrials, and Financials lead the way in terms of buying. We can also see a surge in Materials and the aforementioned Real Estate:
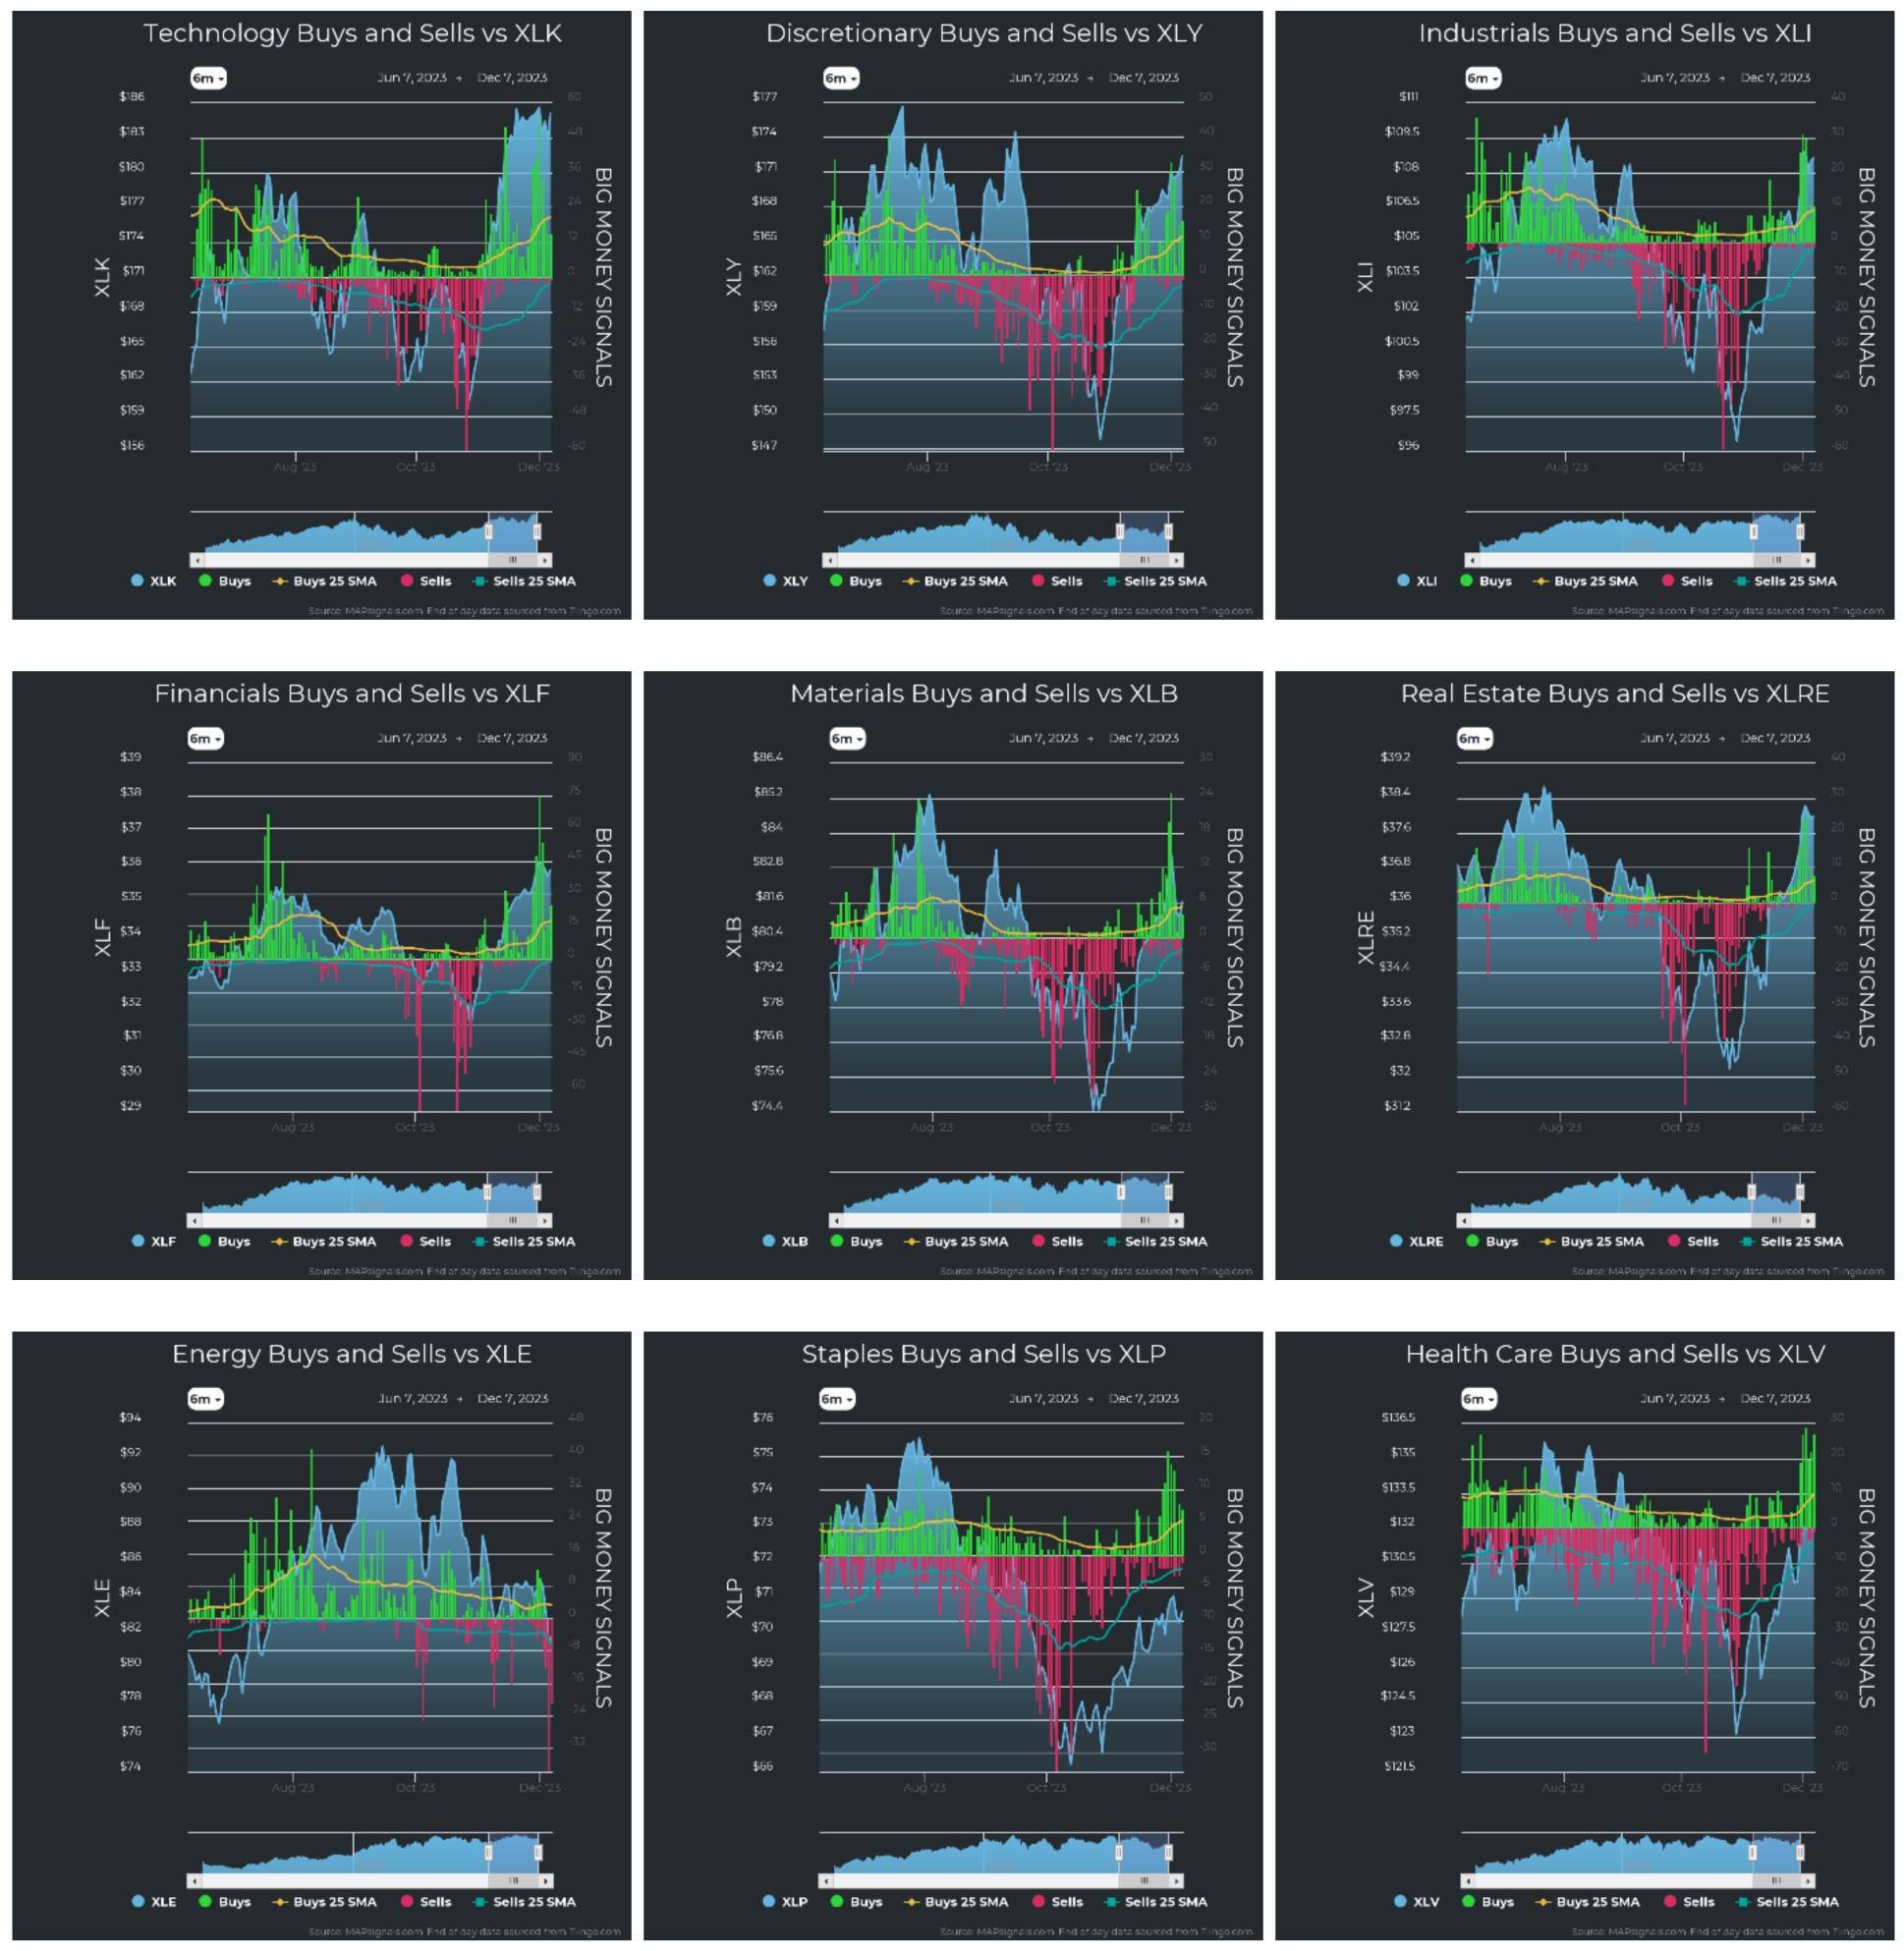
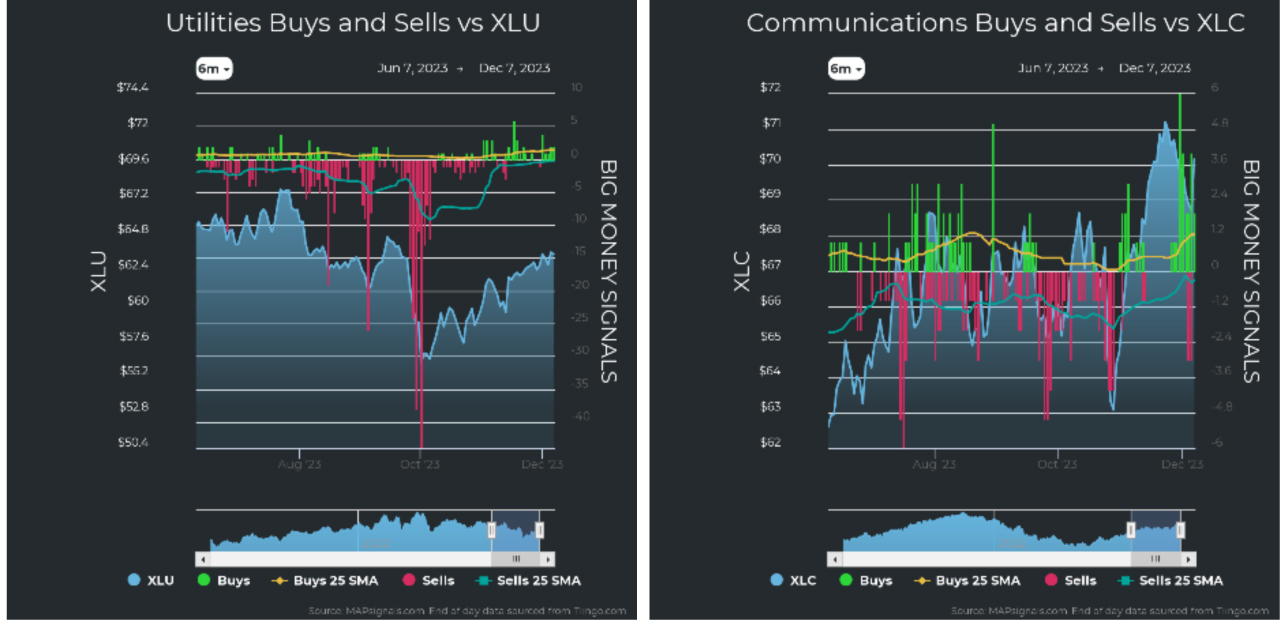
Graphs are for illustrative and discussion purposes only. Please read important disclosures at the end of this commentary.
As for the two sectors not seeing buying, Utilities haven’t seen much, but remember the sector is small, when considering the number of stocks that make it up. That leaves us with Energy. As you can see, it’s the only sector that has seen notable selling lately. But this is also a bit of mean-reversion, as it was such a big out-performer for so long. It doesn’t help the sector that the price of oil has fallen 24% from a peak of $93.68 to $70.86. Still, what hurts energy investors helps the consumer. The price at the pump is falling, which means more discretionary dollars. Should this trend continue, it could further fuel a growth rally.
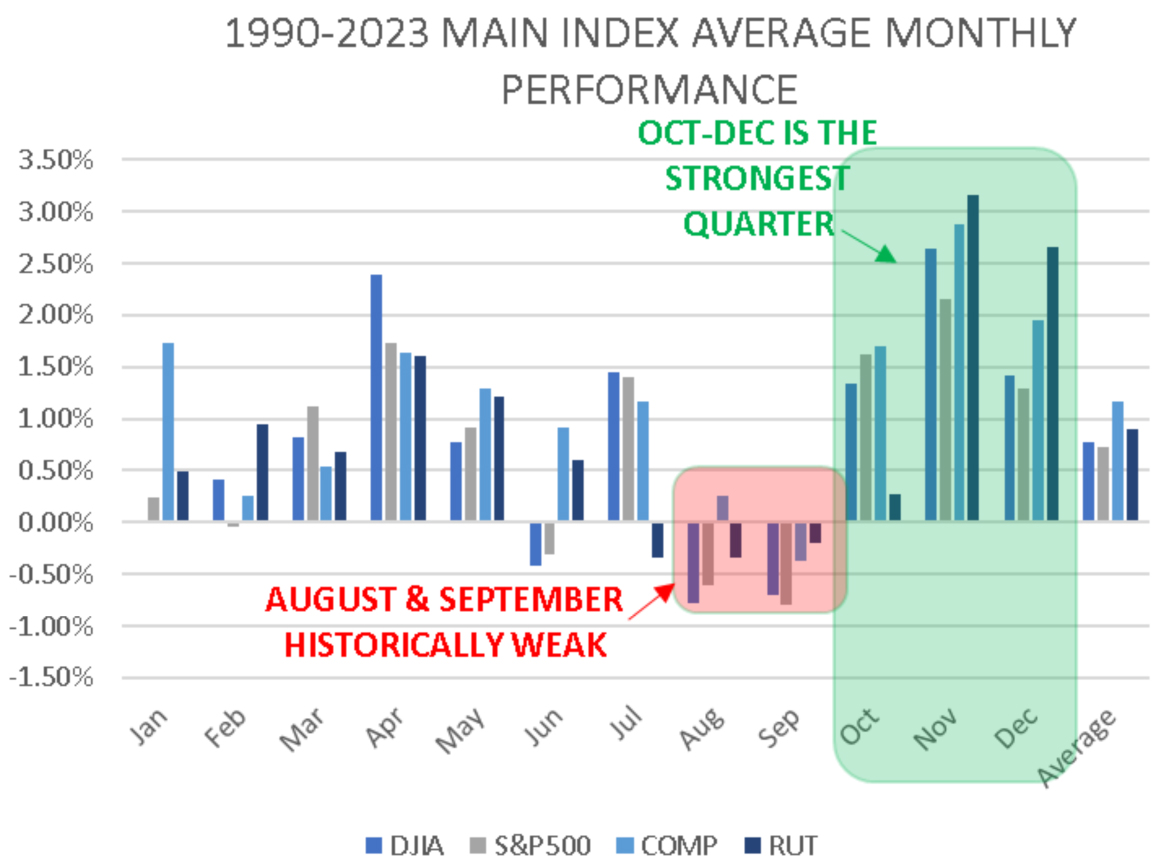
Lastly, it is pretty much a consensus that the Fed is done raising rates. With rates set to fall in 2024, and a major rally underway, we see a potential setup for a massive rally to develop. We’ve already witnessed a nearly 10% rally in the S&P 500 and more in the growth-heavy NASDAQ and Russell 2000 indexes. Should this continue, as we have every indication it will, the question is how long? History suggests the market might rally through April, or longer, as we can see on this historical performance chart since 1990:
Graphs are for illustrative and discussion purposes only. Please read important disclosures at the end of this commentary.
Should this happen – as rates fall – we could see an immense FOMO trade (Fear of Missing Out) develop. When safe money market accounts no longer yield 5%, at the same time that stocks are staging a huge rally, with economic dark clouds behind us, investors will clamor for the gains they missed in stocks.
Time will tell, but I see this coming rally as a distinct possibility – or even a likelihood.
“The only thing you have control over is perspective” – Chris Pine
All content above represents the opinion of Jason Bodner of Navellier & Associates, Inc.
Also In This Issue
A Look Ahead by Louis Navellier
Global Conflicts Escalate in Some Energy Hot Spots
Income Mail by Bryan Perry
Investors Face a Mix of Year-End Bullish and Bearish Forces
Growth Mail by Gary Alexander
The Fed’s Latest Bumbling Invites King Midas to the Rescue
Global Mail by Ivan Martchev
There Could be A Simple Explanation for the Dax Moonshot Move
Sector Spotlight by Jason Bodner
From “Oversold” to “Overbought” in a New York Minute
View Full Archive
Read Past Issues Here

Jason Bodner
MARKETMAIL EDITOR FOR SECTOR SPOTLIGHT
Jason Bodner writes Sector Spotlight in the weekly Marketmail publication and has authored several white papers for the company. He is also Co-Founder of Macro Analytics for Professionals which produces proprietary equity accumulation/distribution research for its clients. Previously, Mr. Bodner served as Director of European Equity Derivatives for Cantor Fitzgerald Europe in London, then moved to the role of Head of Equity Derivatives North America for the same company in New York. He also served as S.V.P. Equity Derivatives for Jefferies, LLC. He received a B.S. in business administration in 1996, with honors, from Skidmore College as a member of the Periclean Honors Society. All content of “Sector Spotlight” represents the opinion of Jason Bodner
Important Disclosures:
Jason Bodner is a co-founder and co-owner of Mapsignals. Mr. Bodner is an independent contractor who is occasionally hired by Navellier & Associates to write an article and or provide opinions for possible use in articles that appear in Navellier & Associates weekly Market Mail. Mr. Bodner is not employed or affiliated with Louis Navellier, Navellier & Associates, Inc., or any other Navellier owned entity. The opinions and statements made here are those of Mr. Bodner and not necessarily those of any other persons or entities. This is not an endorsement, or solicitation or testimonial or investment advice regarding the BMI Index or any statements or recommendations or analysis in the article or the BMI Index or Mapsignals or its products or strategies.
Although information in these reports has been obtained from and is based upon sources that Navellier believes to be reliable, Navellier does not guarantee its accuracy and it may be incomplete or condensed. All opinions and estimates constitute Navellier’s judgment as of the date the report was created and are subject to change without notice. These reports are for informational purposes only and are not a solicitation for the purchase or sale of a security. Any decision to purchase securities mentioned in these reports must take into account existing public information on such securities or any registered prospectus.To the extent permitted by law, neither Navellier & Associates, Inc., nor any of its affiliates, agents, or service providers assumes any liability or responsibility nor owes any duty of care for any consequences of any person acting or refraining to act in reliance on the information contained in this communication or for any decision based on it.
Past performance is no indication of future results. Investment in securities involves significant risk and has the potential for partial or complete loss of funds invested. It should not be assumed that any securities recommendations made by Navellier. in the future will be profitable or equal the performance of securities made in this report. Dividend payments are not guaranteed. The amount of a dividend payment, if any, can vary over time and issuers may reduce dividends paid on securities in the event of a recession or adverse event affecting a specific industry or issuer.
None of the stock information, data, and company information presented herein constitutes a recommendation by Navellier or a solicitation to buy or sell any securities. Any specific securities identified and described do not represent all of the securities purchased, sold, or recommended for advisory clients. The holdings identified do not represent all of the securities purchased, sold, or recommended for advisory clients and the reader should not assume that investments in the securities identified and discussed were or will be profitable.
Information presented is general information that does not take into account your individual circumstances, financial situation, or needs, nor does it present a personalized recommendation to you. Individual stocks presented may not be suitable for every investor. Investment in securities involves significant risk and has the potential for partial or complete loss of funds invested. Investment in fixed income securities has the potential for the investment return and principal value of an investment to fluctuate so that an investor’s holdings, when redeemed, may be worth less than their original cost.
One cannot invest directly in an index. Index is unmanaged and index performance does not reflect deduction of fees, expenses, or taxes. Presentation of Index data does not reflect a belief by Navellier that any stock index constitutes an investment alternative to any Navellier equity strategy or is necessarily comparable to such strategies. Among the most important differences between the Indices and Navellier strategies are that the Navellier equity strategies may (1) incur material management fees, (2) concentrate its investments in relatively few stocks, industries, or sectors, (3) have significantly greater trading activity and related costs, and (4) be significantly more or less volatile than the Indices.
ETF Risk: We may invest in exchange traded funds (“ETFs”) and some of our investment strategies are generally fully invested in ETFs. Like traditional mutual funds, ETFs charge asset-based fees, but they generally do not charge initial sales charges or redemption fees and investors typically pay only customary brokerage fees to buy and sell ETF shares. The fees and costs charged by ETFs held in client accounts will not be deducted from the compensation the client pays Navellier. ETF prices can fluctuate up or down, and a client account could lose money investing in an ETF if the prices of the securities owned by the ETF go down. ETFs are subject to additional risks:
- ETF shares may trade above or below their net asset value;
- An active trading market for an ETF’s shares may not develop or be maintained;
- The value of an ETF may be more volatile than the underlying portfolio of securities the ETF is designed to track;
- The cost of owning shares of the ETF may exceed those a client would incur by directly investing in the underlying securities; and
- Trading of an ETF’s shares may be halted if the listing exchange’s officials deem it appropriate, the shares are delisted from the exchange, or the activation of market-wide “circuit breakers” (which are tied to large decreases in stock prices) halts stock trading generally.
Grader Disclosures: Investment in equity strategies involves substantial risk and has the potential for partial or complete loss of funds invested. The sample portfolio and any accompanying charts are for informational purposes only and are not to be construed as a solicitation to buy or sell any financial instrument and should not be relied upon as the sole factor in an investment making decision. As a matter of normal and important disclosures to you, as a potential investor, please consider the following: The performance presented is not based on any actual securities trading, portfolio, or accounts, and the reported performance of the A, B, C, D, and F portfolios (collectively the “model portfolios”) should be considered mere “paper” or pro forma performance results based on Navellier’s research.
Investors evaluating any of Navellier & Associates, Inc.’s, (or its affiliates’) Investment Products must not use any information presented here, including the performance figures of the model portfolios, in their evaluation of any Navellier Investment Products. Navellier Investment Products include the firm’s mutual funds and managed accounts. The model portfolios, charts, and other information presented do not represent actual funded trades and are not actual funded portfolios. There are material differences between Navellier Investment Products’ portfolios and the model portfolios, research, and performance figures presented here. The model portfolios and the research results (1) may contain stocks or ETFs that are illiquid and difficult to trade; (2) may contain stock or ETF holdings materially different from actual funded Navellier Investment Product portfolios; (3) include the reinvestment of all dividends and other earnings, estimated trading costs, commissions, or management fees; and, (4) may not reflect prices obtained in an actual funded Navellier Investment Product portfolio. For these and other reasons, the reported performances of model portfolios do not reflect the performance results of Navellier’s actually funded and traded Investment Products. In most cases, Navellier’s Investment Products have materially lower performance results than the performances of the model portfolios presented.
This report contains statements that are, or may be considered to be, forward-looking statements. All statements that are not historical facts, including statements about our beliefs or expectations, are “forward-looking statements” within the meaning of The U.S. Private Securities Litigation Reform Act of 1995. These statements may be identified by such forward-looking terminology as “expect,” “estimate,” “plan,” “intend,” “believe,” “anticipate,” “may,” “will,” “should,” “could,” “continue,” “project,” or similar statements or variations of such terms. Our forward-looking statements are based on a series of expectations, assumptions, and projections, are not guarantees of future results or performance, and involve substantial risks and uncertainty as described in Form ADV Part 2A of our filing with the Securities and Exchange Commission (SEC), which is available at www.adviserinfo.sec.gov or by requesting a copy by emailing info@navellier.com. All of our forward-looking statements are as of the date of this report only. We can give no assurance that such expectations or forward-looking statements will prove to be correct. Actual results may differ materially. You are urged to carefully consider all such factors.
FEDERAL TAX ADVICE DISCLAIMER: As required by U.S. Treasury Regulations, you are informed that, to the extent this presentation includes any federal tax advice, the presentation is not written by Navellier to be used, and cannot be used, for the purpose of avoiding federal tax penalties. Navellier does not advise on any income tax requirements or issues. Use of any information presented by Navellier is for general information only and does not represent tax advice either express or implied. You are encouraged to seek professional tax advice for income tax questions and assistance.
IMPORTANT NEWSLETTER DISCLOSURE:The hypothetical performance results for investment newsletters that are authored or edited by Louis Navellier, including Louis Navellier’s Growth Investor, Louis Navellier’s Breakthrough Stocks, Louis Navellier’s Accelerated Profits, and Louis Navellier’s Platinum Club, are not based on any actual securities trading, portfolio, or accounts, and the newsletters’ reported hypothetical performances should be considered mere “paper” or proforma hypothetical performance results and are not actual performance of real world trades. Navellier & Associates, Inc. does not have any relation to or affiliation with the owner of these newsletters. There are material differences between Navellier Investment Products’ portfolios and the InvestorPlace Media, LLC newsletter portfolios authored by Louis Navellier. The InvestorPlace Media, LLC newsletters contain hypothetical performance that do not include transaction costs, advisory fees, or other fees a client might incur if actual investments and trades were being made by an investor. As a result, newsletter performance should not be used to evaluate Navellier Investment services which are separate and different from the newsletters. The owner of the newsletters is InvestorPlace Media, LLC and any questions concerning the newsletters, including any newsletter advertising or hypothetical Newsletter performance claims, (which are calculated solely by Investor Place Media and not Navellier) should be referred to InvestorPlace Media, LLC at (800) 718-8289.
Please note that Navellier & Associates and the Navellier Private Client Group are managed completely independent of the newsletters owned and published by InvestorPlace Media, LLC and written and edited by Louis Navellier, and investment performance of the newsletters should in no way be considered indicative of potential future investment performance for any Navellier & Associates separately managed account portfolio. Potential investors should consult with their financial advisor before investing in any Navellier Investment Product.
Navellier claims compliance with Global Investment Performance Standards (GIPS). To receive a complete list and descriptions of Navellier’s composites and/or a presentation that adheres to the GIPS standards, please contact Navellier or click here. It should not be assumed that any securities recommendations made by Navellier & Associates, Inc. in the future will be profitable or equal the performance of securities made in this report.
FactSet Disclosure: Navellier does not independently calculate the statistical information included in the attached report. The calculation and the information are provided by FactSet, a company not related to Navellier. Although information contained in the report has been obtained from FactSet and is based on sources Navellier believes to be reliable, Navellier does not guarantee its accuracy, and it may be incomplete or condensed. The report and the related FactSet sourced information are provided on an “as is” basis. The user assumes the entire risk of any use made of this information. Investors should consider the report as only a single factor in making their investment decision. The report is for informational purposes only and is not intended as an offer or solicitation for the purchase or sale of a security. FactSet sourced information is the exclusive property of FactSet. Without prior written permission of FactSet, this information may not be reproduced, disseminated or used to create any financial products. All indices are unmanaged and performance of the indices include reinvestment of dividends and interest income, unless otherwise noted, are not illustrative of any particular investment and an investment cannot be made in any index. Past performance is no guarantee of future results.