by Jason Bodner
September 9, 2025
We’ve all heard the pilot say something like this. “Fasten your seat belts, folks. Things might get bumpy.”
Don’t worry when your flight shakes you up a bit. Airplanes are built to withstand a level of turbulence far greater than we might imagine. The wings of a modern jet can bend 30-feet without breaking, flexing with the wind like a bird’s feathers. So, when the cabin rattles and drinks spill, the plane will keep flying.
Markets are not so different. Volatility may feel terrifying in the moment, but beneath the surface lies a firm structure and resilience. And just like seasoned pilots know that air-turbulence is normal on certain routes, seasoned investors know that the route through September often brings added market turmoil.

Graphs are for illustrative and discussion purposes only. Please read important disclosures at the end of this commentary.
Since 1990, September has been the weakest-month for stocks. That fact can unnerve investors already conditioned by gloomy headlines. Negative seasonality layered on top of scary news can spook even the steadiest hand. But when we strip away fear and look at the data, this September is off to a hot start.
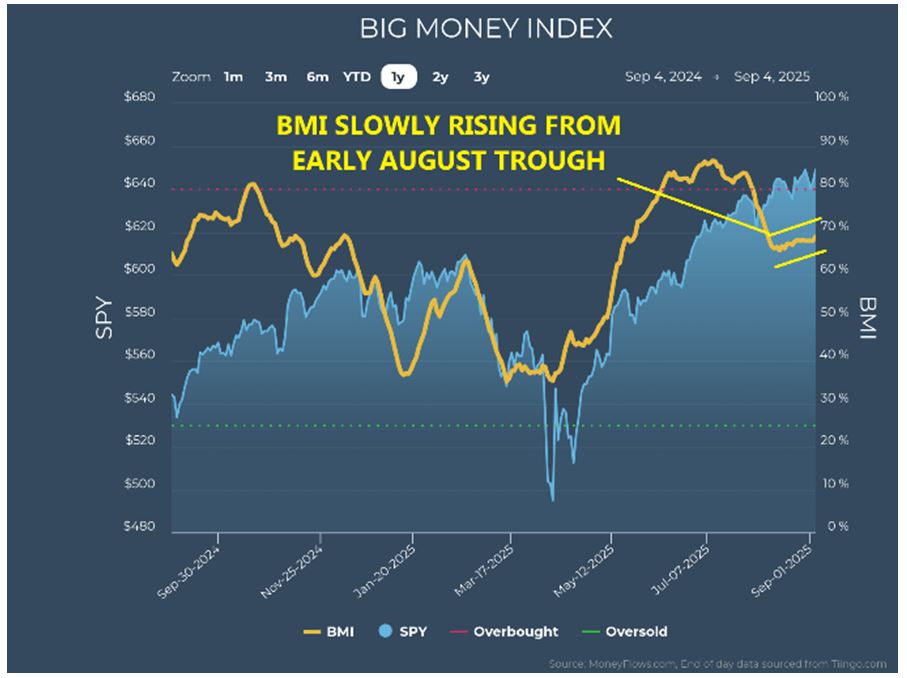
As the monthly data reveals (above), August also has a weak seasonal profile, yet the S&P 500 gained nearly 2% in August. Those gains nudged the Big Money Index higher, from a low of 66.2 to 68.9.

While the latest BMI rise looks meager, its meaning is important: inflows are outpacing outflows on a 25-day rolling basis. The BMI is a great gauge of institutional activity. A rising BMI means greater demand.
Graphs are for illustrative and discussion purposes only. Please read important disclosures at the end of this commentary.
Even in August, a month that “should” have been weak, institutions stepped up to buy more stocks. That means the underlying currents don’t support the media’s incessant narrative of rising dangers.
Mapping Outflows vs. Inflows
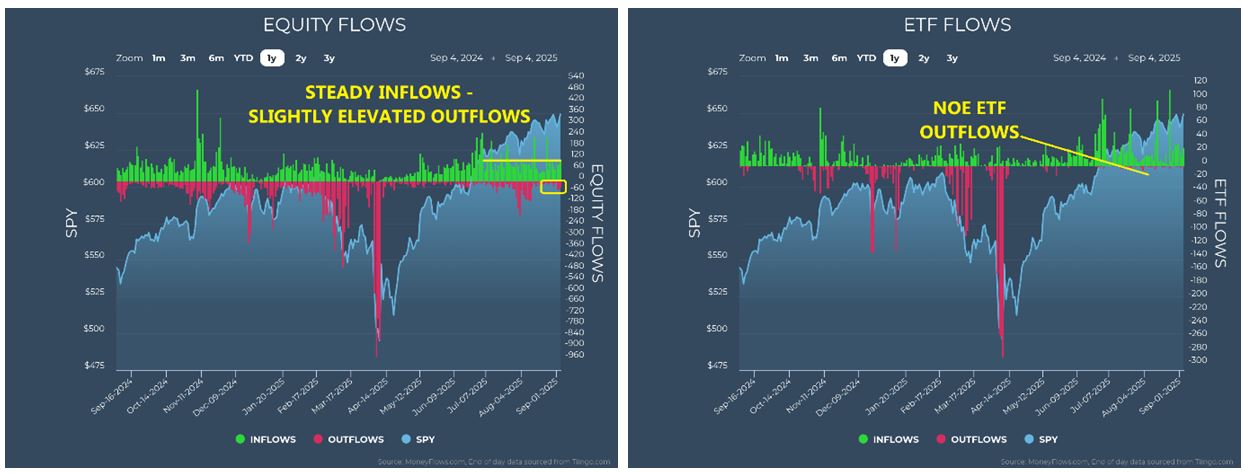
So far, September’s picture sharpens when we drill down into money flows. Outflows over the past three-sessions averaged 42 per day, well below the 20-year average of 50. By comparison, inflows averaged 97 per day, far above the 20-year average of 65. That’s net lift, not greater turbulence.
Here’s another encouraging detail: ETFs are showing no net outflows. This matters because large asset managers use ETFs as instruments for exposure to markets, sectors, or investing themes. When ETFs register sharp outflows, it signals broad-based risk reduction, while absences of outflow suggest money managers are not dumping anything meaningful. Put simply, no one is reaching for the eject handle.
Graphs are for illustrative and discussion purposes only. Please read important disclosures at the end of this commentary.
Market Cap and Risk Appetite
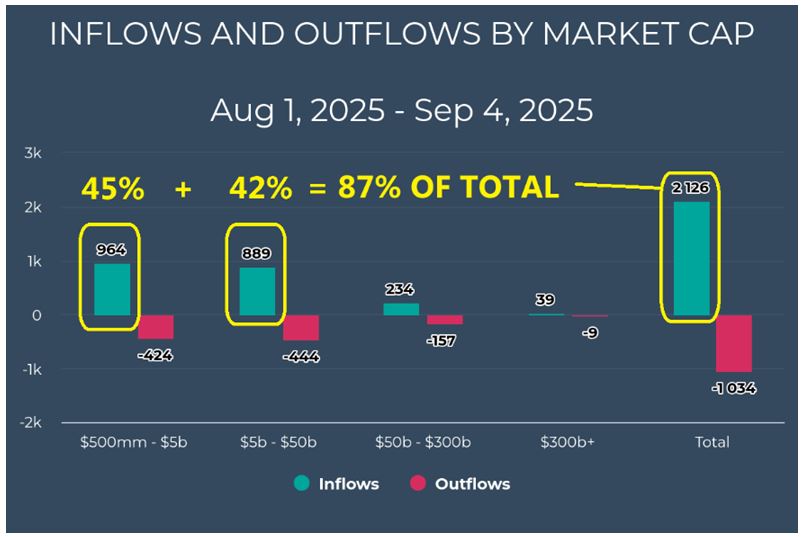
Looking at money flows by market cap since August 1st, we see healthy action. Eighty-seven percent of inflows have gone into small-caps and mid-caps, with inflows outnumbering outflows by two to one.
Historically, when capital moves into these higher-beta segments, it reflects confidence and appetite for risk. This is not defensive-posturing, it is growth-seeking behavior.
Graphs are for illustrative and discussion purposes only. Please read important disclosures at the end of this commentary.
This alone contradicts history, which says September must be weak. The flows are saying the opposite.
Sector Flows Confirm the Story
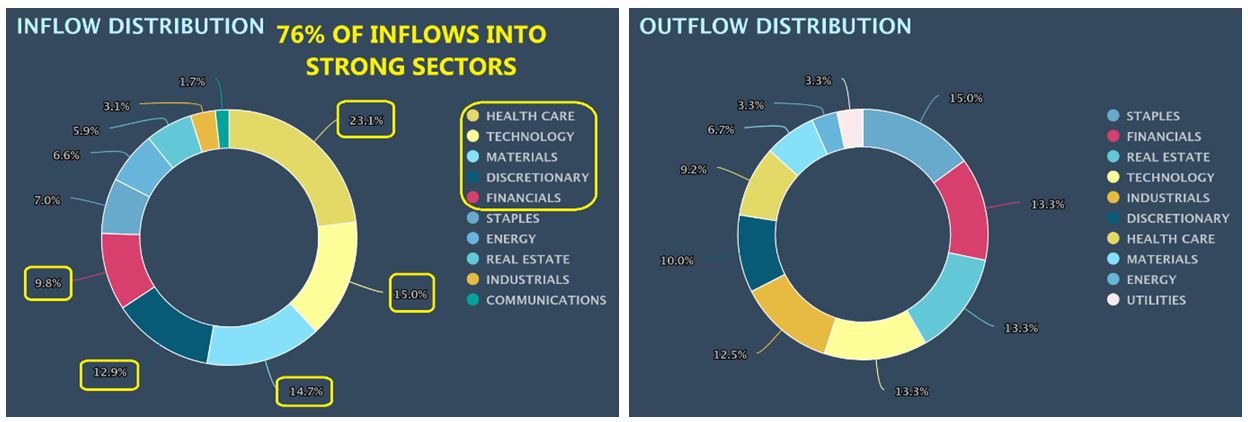
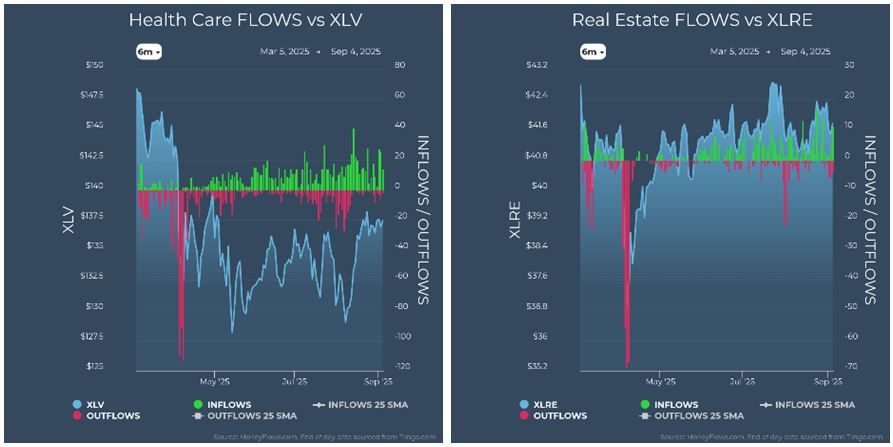
In the past week, 76% of inflows were concentrated in Healthcare, Technology, Materials, Discretionary, and Financials. Outflows, small as they were, came from Staples and Real Estate – defensive havens. When investors embrace risk-on sectors and avoid defensive-sectors, it speaks of optimism, not fear.
Graphs are for illustrative and discussion purposes only. Please read important disclosures at the end of this commentary.
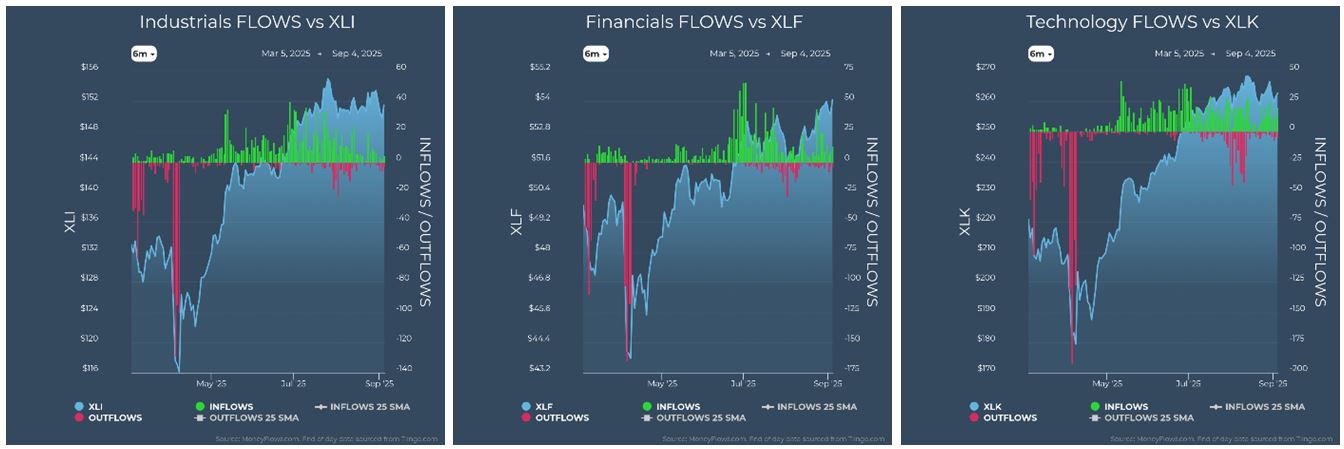
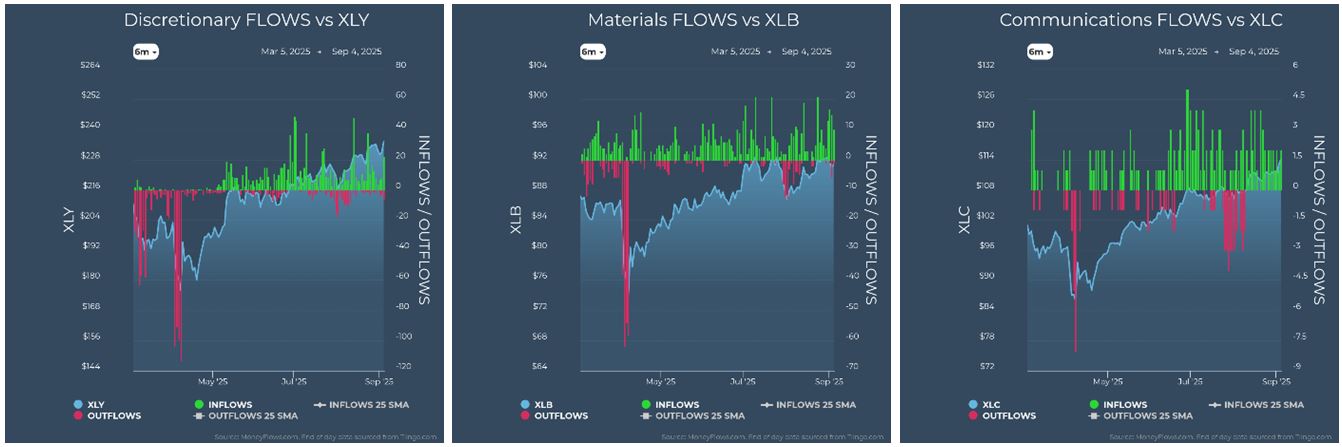
Sector rankings echo this tale. Industrials sit atop the list, followed by Financials, Technology and Discretionary. Industrials reflect strength in infrastructure. Financials benefit from falling rates, with cheaper credit spurring M&A activity, IPOs and lending. Technology and Discretionary, my preferred yardsticks for economic strength, represent innovation and consumer confidence. When these rank high, bull-markets strengthen.
![]()
Graphs are for illustrative and discussion purposes only. Please read important disclosures at the end of this commentary.
Sector ETFs mirror this bullish backdrop. Health Care looks poised for a breakout, with the SPDR Biotech ETF (XBI) showing early sparks of recovery.
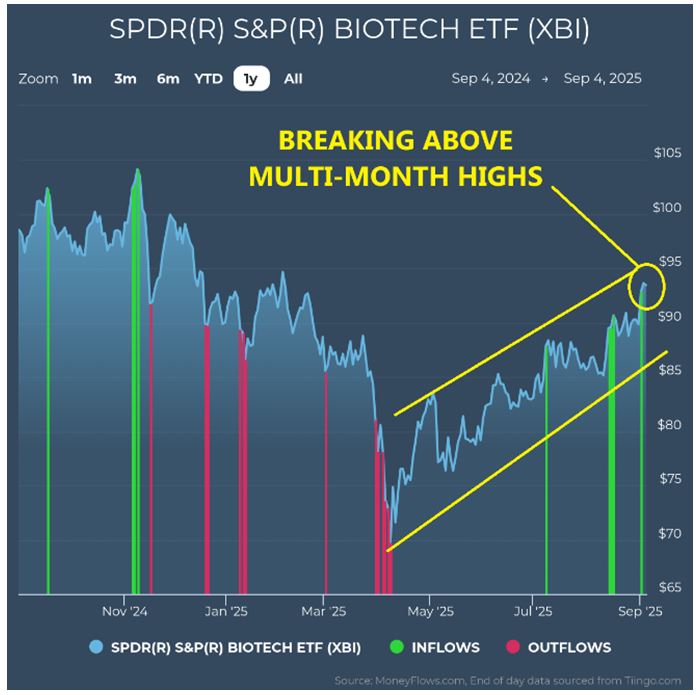
Graphs are for illustrative and discussion purposes only. Please read important disclosures at the end of this commentary.
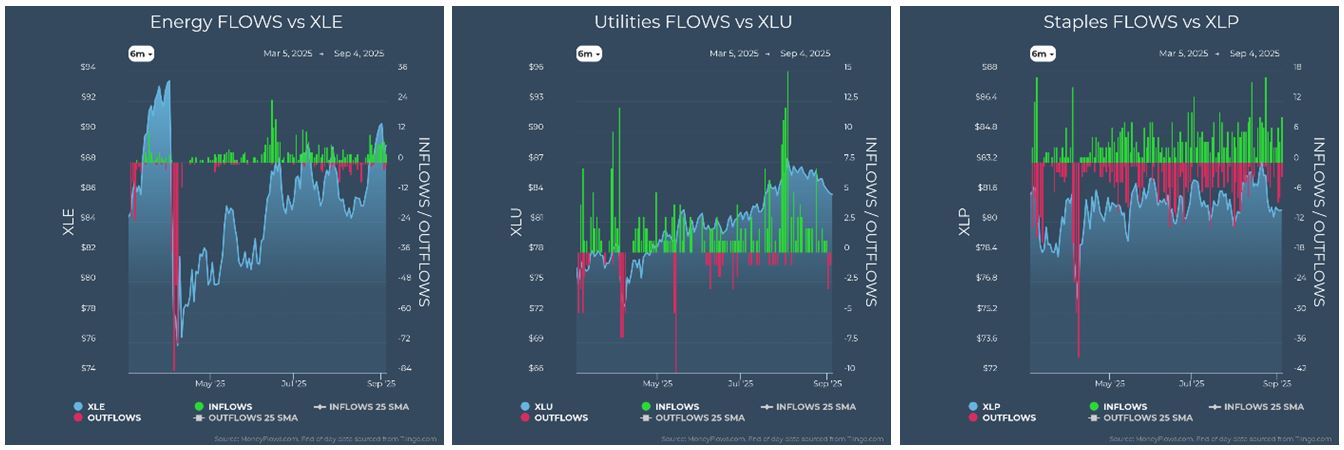
Industrials, Technology, and Discretionary are at or near highs. Energy remains range-bound, with oil at $63.35 per barrel – in the lower end of its six-month range. Staples, meanwhile, have drifted sideways for half a year. These divergences illustrate an economy tilting toward growth, not retreat.
Graphs are for illustrative and discussion purposes only. Please read important disclosures at the end of this commentary.
This isn’t the first time sentiment and reality have diverged. In August 2010, headlines screamed of a “double-dip recession,” yet the data quietly showed spending stabilizing and flows moving into growth sectors. Stocks rallied more than 25% over the next year. In September 2016, fears of a rate hike sent markets reeling, only for the S&P to finish the year strong. History teaches a simple lesson: Perception often overshadows reality in the short term, but money flows reveal where the confidence truly lies.
Let’s summarize…
September comes carrying baggage of negative headlines, seasonal weakness, and global uncertainty. Yet the hard data – a rising BMI, inflows dominating outflows, ETFs holding steady, small-caps and mid-caps attracting capital, and growth-sectors leading – all argue that the market is sturdy. Add to this backdrop an excellent earnings season, and you have a good case for more gains. FactSet recently reported that 81% of reporting S&P 500 companies beat sales and earnings expectations. Even where guidance was murky, the market’s reaction was saying dips were shallow, buying emerged, and selling pressure never took hold.
In other words, this airplane’s wings are flexing exactly as they should.
Anyone who has flown through turbulence knows the stomach-churning feeling, even as the crew calmly serve drinks or walk the aisles. Experience teaches us that what feels dangerous is often routine.
Investors should heed the same lesson. What shakes us emotionally rarely damages us financially, provided we stay disciplined and consider facts over fears. September has a reputation for weakness, and negative headlines will (always) continue pouring in. But the current data isn’t fragile; it is constructive. Markets are absorbing shocks, channeling flows into growth, and showing resilience in the face of doubt.
September is supposed to be the market’s roughest ride. But so far, the air is smoother than history would have us believe. Beneath the rattling daily headlines, investment currents are healthy signaling expansion.
Riding markets, like riding planes, means some inevitable turbulence. But the wings are strong and working how they should, so relax and enjoy the ride. As Marcus Aurelius wisely wrote: “Today I escaped anxiety. Or no, I discarded it, because it was within me, in my own perceptions, not outside.”
All content above represents the opinion of Jason Bodner of Navellier & Associates, Inc.
Also In This Issue
A Look Ahead by Louis Navellier
Last Week’s Jobs Data Lifted Most Major Markets
Income Mail by Bryan Perry
Digesting Slack Labor Markets and AI Amid Record Gold and Stock Prices
Growth Mail by Gary Alexander
Black Swans Often Fly in September
Global Mail by Ivan Martchev
What September’s Low Market Volatility Means
Sector Spotlight by Jason Bodner
September May Surprise Us – Just Like August Did
View Full Archive
Read Past Issues Here

Jason Bodner
MARKETMAIL EDITOR FOR SECTOR SPOTLIGHT
Jason Bodner writes Sector Spotlight in the weekly Marketmail publication and has authored several white papers for the company. He is also Co-Founder of Macro Analytics for Professionals which produces proprietary equity accumulation and distribution research for its clients. Previously, Mr. Bodner served as Director of European Equity Derivatives for Cantor Fitzgerald Europe in London, then moved to the role of Head of Equity Derivatives North America for the same company in New York. He also served as S.V.P. Equity Derivatives for Jefferies, LLC. He received a B.S. in business administration in 1996, with honors, from Skidmore College as a member of the Periclean Honors Society. All content of “Sector Spotlight” represents the opinion of Jason Bodner
Important Disclosures:
Jason Bodner is a co-founder and co-owner of Mapsignals. Mr. Bodner is an independent contractor who is occasionally hired by Navellier & Associates to write an article and or provide opinions for possible use in articles that appear in Navellier & Associates weekly Market Mail. Mr. Bodner is not employed or affiliated with Louis Navellier, Navellier & Associates, Inc., or any other Navellier owned entity. The opinions and statements made here are those of Mr. Bodner and not necessarily those of any other persons or entities. This is not an endorsement, or solicitation or testimonial or investment advice regarding the BMI Index or any statements or recommendations or analysis in the article or the BMI Index or Mapsignals or its products or strategies.
Although information in these reports has been obtained from and is based upon sources that Navellier believes to be reliable, Navellier does not guarantee its accuracy and it may be incomplete or condensed. All opinions and estimates constitute Navellier’s judgment as of the date the report was created and are subject to change without notice. These reports are for informational purposes only and are not a solicitation for the purchase or sale of a security. Any decision to purchase securities mentioned in these reports must take into account existing public information on such securities or any registered prospectus.To the extent permitted by law, neither Navellier & Associates, Inc., nor any of its affiliates, agents, or service providers assumes any liability or responsibility nor owes any duty of care for any consequences of any person acting or refraining to act in reliance on the information contained in this communication or for any decision based on it.
Past performance is no indication of future results. Investment in securities involves significant risk and has the potential for partial or complete loss of funds invested. It should not be assumed that any securities recommendations made by Navellier. in the future will be profitable or equal the performance of securities made in this report. Dividend payments are not guaranteed. The amount of a dividend payment, if any, can vary over time and issuers may reduce dividends paid on securities in the event of a recession or adverse event affecting a specific industry or issuer.
None of the stock information, data, and company information presented herein constitutes a recommendation by Navellier or a solicitation to buy or sell any securities. Any specific securities identified and described do not represent all of the securities purchased, sold, or recommended for advisory clients. The holdings identified do not represent all of the securities purchased, sold, or recommended for advisory clients and the reader should not assume that investments in the securities identified and discussed were or will be profitable.
Information presented is general information that does not take into account your individual circumstances, financial situation, or needs, nor does it present a personalized recommendation to you. Individual stocks presented may not be suitable for every investor. Investment in securities involves significant risk and has the potential for partial or complete loss of funds invested. Investment in fixed income securities has the potential for the investment return and principal value of an investment to fluctuate so that an investor’s holdings, when redeemed, may be worth less than their original cost.
One cannot invest directly in an index. Index is unmanaged and index performance does not reflect deduction of fees, expenses, or taxes. Presentation of Index data does not reflect a belief by Navellier that any stock index constitutes an investment alternative to any Navellier equity strategy or is necessarily comparable to such strategies. Among the most important differences between the Indices and Navellier strategies are that the Navellier equity strategies may (1) incur material management fees, (2) concentrate its investments in relatively few stocks, industries, or sectors, (3) have significantly greater trading activity and related costs, and (4) be significantly more or less volatile than the Indices.
ETF Risk: We may invest in exchange traded funds (“ETFs”) and some of our investment strategies are generally fully invested in ETFs. Like traditional mutual funds, ETFs charge asset-based fees, but they generally do not charge initial sales charges or redemption fees and investors typically pay only customary brokerage fees to buy and sell ETF shares. The fees and costs charged by ETFs held in client accounts will not be deducted from the compensation the client pays Navellier. ETF prices can fluctuate up or down, and a client account could lose money investing in an ETF if the prices of the securities owned by the ETF go down. ETFs are subject to additional risks:
- ETF shares may trade above or below their net asset value;
- An active trading market for an ETF’s shares may not develop or be maintained;
- The value of an ETF may be more volatile than the underlying portfolio of securities the ETF is designed to track;
- The cost of owning shares of the ETF may exceed those a client would incur by directly investing in the underlying securities and;
- Trading of an ETF’s shares may be halted if the listing exchange’s officials deem it appropriate, the shares are delisted from the exchange, or the activation of market-wide “circuit breakers” (which are tied to large decreases in stock prices) halts stock trading generally.
Grader Disclosures: Investment in equity strategies involves substantial risk and has the potential for partial or complete loss of funds invested. The sample portfolio and any accompanying charts are for informational purposes only and are not to be construed as a solicitation to buy or sell any financial instrument and should not be relied upon as the sole factor in an investment making decision. As a matter of normal and important disclosures to you, as a potential investor, please consider the following: The performance presented is not based on any actual securities trading, portfolio, or accounts, and the reported performance of the A, B, C, D, and F portfolios (collectively the “model portfolios”) should be considered mere “paper” or pro forma performance results based on Navellier’s research.
Investors evaluating any of Navellier & Associates, Inc.’s, (or its affiliates’) Investment Products must not use any information presented here, including the performance figures of the model portfolios, in their evaluation of any Navellier Investment Products. Navellier Investment Products include the firm’s mutual funds and managed accounts. The model portfolios, charts, and other information presented do not represent actual funded trades and are not actual funded portfolios. There are material differences between Navellier Investment Products’ portfolios and the model portfolios, research, and performance figures presented here. The model portfolios and the research results (1) may contain stocks or ETFs that are illiquid and difficult to trade; (2) may contain stock or ETF holdings materially different from actual funded Navellier Investment Product portfolios; (3) include the reinvestment of all dividends and other earnings, estimated trading costs, commissions, or management fees; and, (4) may not reflect prices obtained in an actual funded Navellier Investment Product portfolio. For these and other reasons, the reported performances of model portfolios do not reflect the performance results of Navellier’s actually funded and traded Investment Products. In most cases, Navellier’s Investment Products have materially lower performance results than the performances of the model portfolios presented.
This report contains statements that are, or may be considered to be, forward-looking statements. All statements that are not historical facts, including statements about our beliefs or expectations, are “forward-looking statements” within the meaning of The U.S. Private Securities Litigation Reform Act of 1995. These statements may be identified by such forward-looking terminology as “expect,” “estimate,” “plan,” “intend,” “believe,” “anticipate,” “may,” “will,” “should,” “could,” “continue,” “project,” or similar statements or variations of such terms. Our forward-looking statements are based on a series of expectations, assumptions, and projections, are not guarantees of future results or performance, and involve substantial risks and uncertainty as described in Form ADV Part 2A of our filing with the Securities and Exchange Commission (SEC), which is available at www.adviserinfo.sec.gov or by requesting a copy by emailing info@navellier.com. All of our forward-looking statements are as of the date of this report only. We can give no assurance that such expectations or forward-looking statements will prove to be correct. Actual results may differ materially. You are urged to carefully consider all such factors.
FEDERAL TAX ADVICE DISCLAIMER: As required by U.S. Treasury Regulations, you are informed that, to the extent this presentation includes any federal tax advice, the presentation is not written by Navellier to be used, and cannot be used, for the purpose of avoiding federal tax penalties. Navellier does not advise on any income tax requirements or issues. Use of any information presented by Navellier is for general information only and does not represent tax advice either express or implied. You are encouraged to seek professional tax advice for income tax questions and assistance.
IMPORTANT NEWSLETTER DISCLOSURE:The hypothetical performance results for investment newsletters that are authored or edited by Louis Navellier, including Louis Navellier’s Growth Investor, Louis Navellier’s Breakthrough Stocks, Louis Navellier’s Accelerated Profits, and Louis Navellier’s Platinum Club, are not based on any actual securities trading, portfolio, or accounts, and the newsletters’ reported hypothetical performances should be considered mere “paper” or proforma hypothetical performance results and are not actual performance of real world trades. Navellier & Associates, Inc. does not have any relation to or affiliation with the owner of these newsletters. There are material differences between Navellier Investment Products’ portfolios and the InvestorPlace Media, LLC newsletter portfolios authored by Louis Navellier. The InvestorPlace Media, LLC newsletters contain hypothetical performance that do not include transaction costs, advisory fees, or other fees a client might incur if actual investments and trades were being made by an investor. As a result, newsletter performance should not be used to evaluate Navellier Investment services which are separate and different from the newsletters. The owner of the newsletters is InvestorPlace Media, LLC and any questions concerning the newsletters, including any newsletter advertising or hypothetical Newsletter performance claims, (which are calculated solely by Investor Place Media and not Navellier) should be referred to InvestorPlace Media, LLC at (800) 718-8289.
Please note that Navellier & Associates and the Navellier Private Client Group are managed completely independent of the newsletters owned and published by InvestorPlace Media, LLC and written and edited by Louis Navellier, and investment performance of the newsletters should in no way be considered indicative of potential future investment performance for any Navellier & Associates separately managed account portfolio. Potential investors should consult with their financial advisor before investing in any Navellier Investment Product.
Navellier claims compliance with Global Investment Performance Standards (GIPS). To receive a complete list and descriptions of Navellier’s composites and/or a presentation that adheres to the GIPS standards, please contact Navellier or click here. It should not be assumed that any securities recommendations made by Navellier & Associates, Inc. in the future will be profitable or equal the performance of securities made in this report.
FactSet Disclosure: Navellier does not independently calculate the statistical information included in the attached report. The calculation and the information are provided by FactSet, a company not related to Navellier. Although information contained in the report has been obtained from FactSet and is based on sources Navellier believes to be reliable, Navellier does not guarantee its accuracy, and it may be incomplete or condensed. The report and the related FactSet sourced information are provided on an “as is” basis. The user assumes the entire risk of any use made of this information. Investors should consider the report as only a single factor in making their investment decision. The report is for informational purposes only and is not intended as an offer or solicitation for the purchase or sale of a security. FactSet sourced information is the exclusive property of FactSet. Without prior written permission of FactSet, this information may not be reproduced, disseminated or used to create any financial products. All indices are unmanaged and performance of the indices include reinvestment of dividends and interest income, unless otherwise noted, are not illustrative of any particular investment and an investment cannot be made in any index. Past performance is no guarantee of future results.