by Jason Bodner
September 4, 2024
The August run of market manipulation is over. Labor Day is here. As I write, the world is quiet…
Late August finds much of the tri-state area* on vacation. Hey, if you can’t take some time off around Labor Day, when can you? Labor Day also marks the start of the NFL season. 99.4% of the time the NFL plays the first official game on the Thursday after Labor Day, and the jobs report comes out the next day.
*The tri-state area – New York, Connecticut, and New Jersey – is home to many financial professionals. Traders, portfolio managers, and every other role related to the investment world need a break. During the week before Labor Day, it is a safe bet that most trading desks are staffed with a skeleton crew.
Empty offices mean low liquidity, potentially more volatility and possibly some trading shenanigans. I think it’s no coincidence that a popular stock saw a short-seller report come out last week, of all weeks. The volatility experienced in the aftermath was amplified due to low market participation (few buyers).
It’s hard to put much stake in trading action during the last week of August. That’s why I think it’s a good time to reflect on where we are by looking at historical analogs to give us an idea of where we are headed.
First, let’s look at where we are; then I will show you some compelling data that layers even more positives for the bullish case through the end of the year and beyond.
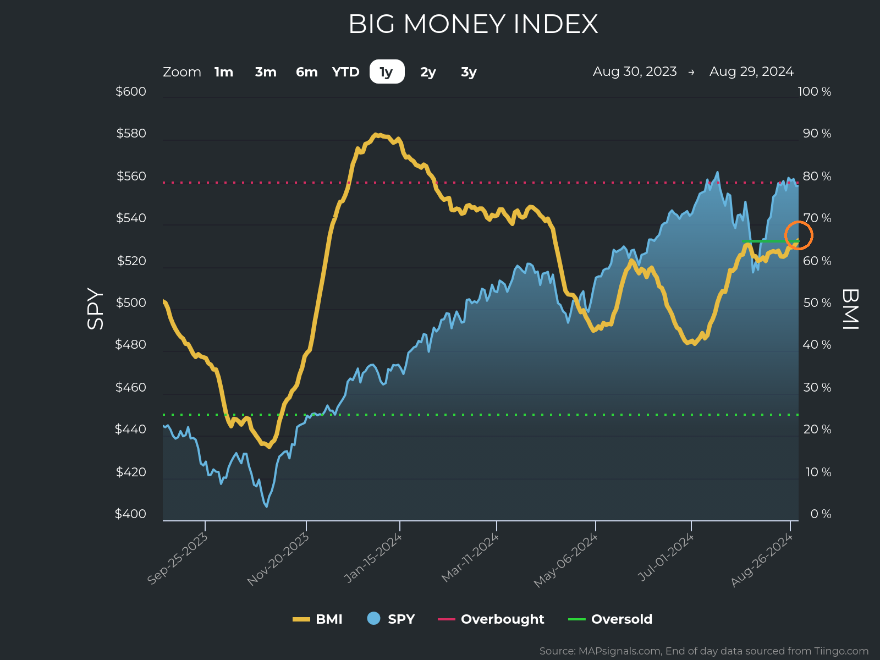
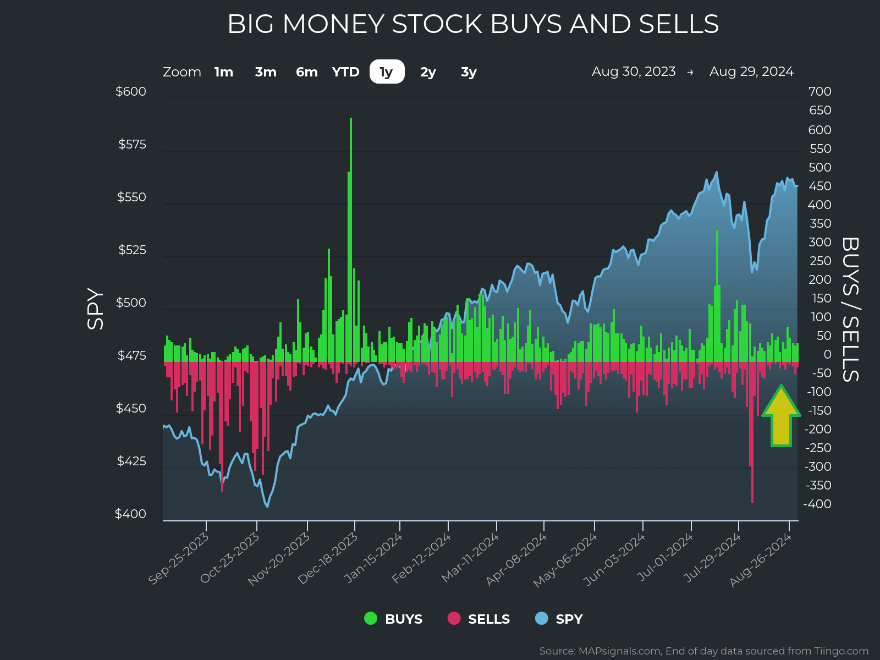
Looking at the Big Money Index (BMI), we see that it held stable after that nasty selloff in the first week of August. If anything, it is looking to break above recent highs made in July. Remember – that amber line is a 25-day moving average of unusual money flows. When it rises, that means money is moving into the market. So, despite the massive head-fake in the first week of August, money kept moving into stocks.
Graphs are for illustrative and discussion purposes only. Please read important disclosures at the end of this commentary.
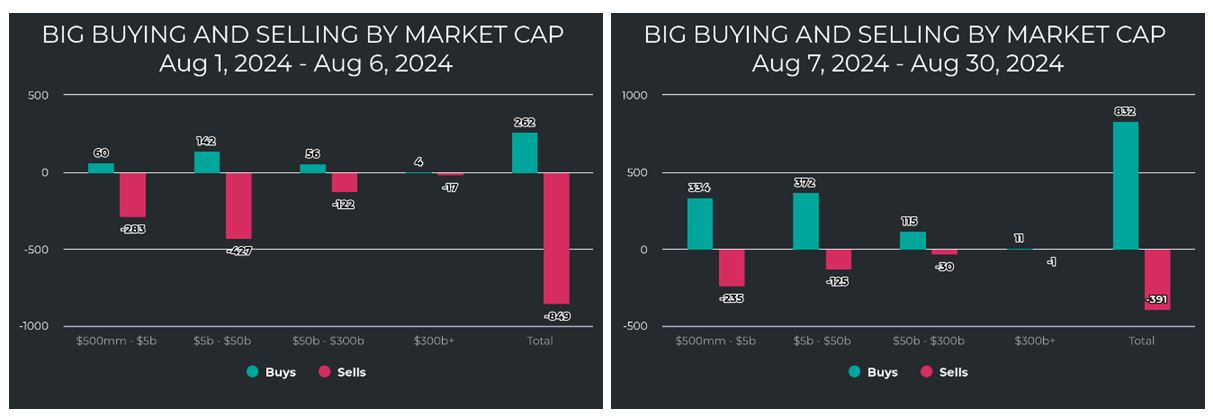
Speaking of the early August head-fake, let’s look at this tale of two markets, the first week of August, and the next three weeks. On the left, you will see the distribution of unusual buying and selling from August 1st through August 6th. There was huge, focused selling in small and mid-cap stocks. And on the right, you will see a total reversal since August 7th. Small and mid-caps have been snapped up:
Graphs are for illustrative and discussion purposes only. Please read important disclosures at the end of this commentary.
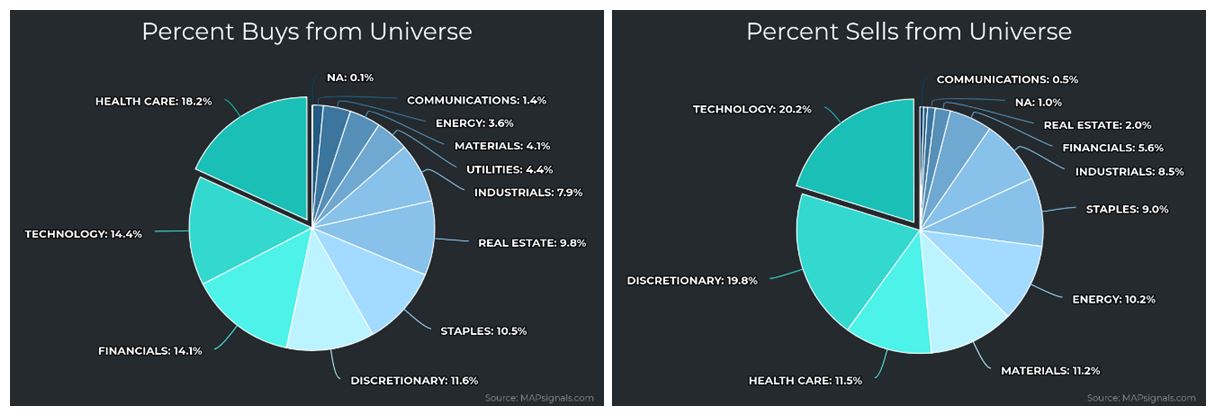
When we look at the distribution of what was bought up, we see more sector rotation. Health Care saw accumulation along with some technology names. On the selling side, we see other technology names and Discretionary stocks, so there has been undulation within the sectors themselves:
Graphs are for illustrative and discussion purposes only. Please read important disclosures at the end of this commentary.
The main takeaway is that I am seeing new leadership. And that leadership is in the form of small and mid-cap stocks. The pie charts above represent unusual money-flows into the sectors. When we break down the individual stocks, we saw 389 buys and 239 sells. When I looked at the highest-ranking stocks bought since August 7th, the top nine-ranked stocks have market capitalization below $15 billion.
As interest rates are nearly certain to start falling on September 18th, that will supply additional wind at the backs of smaller companies. Lower costs of financing growth will fall directly to the bottom lines of these firms. Add to that the effect that rate easing will stimulate the economy and consumerism and thus will also benefit the small and mid-cap stocks. Now we are seeing evidence that this is underway.
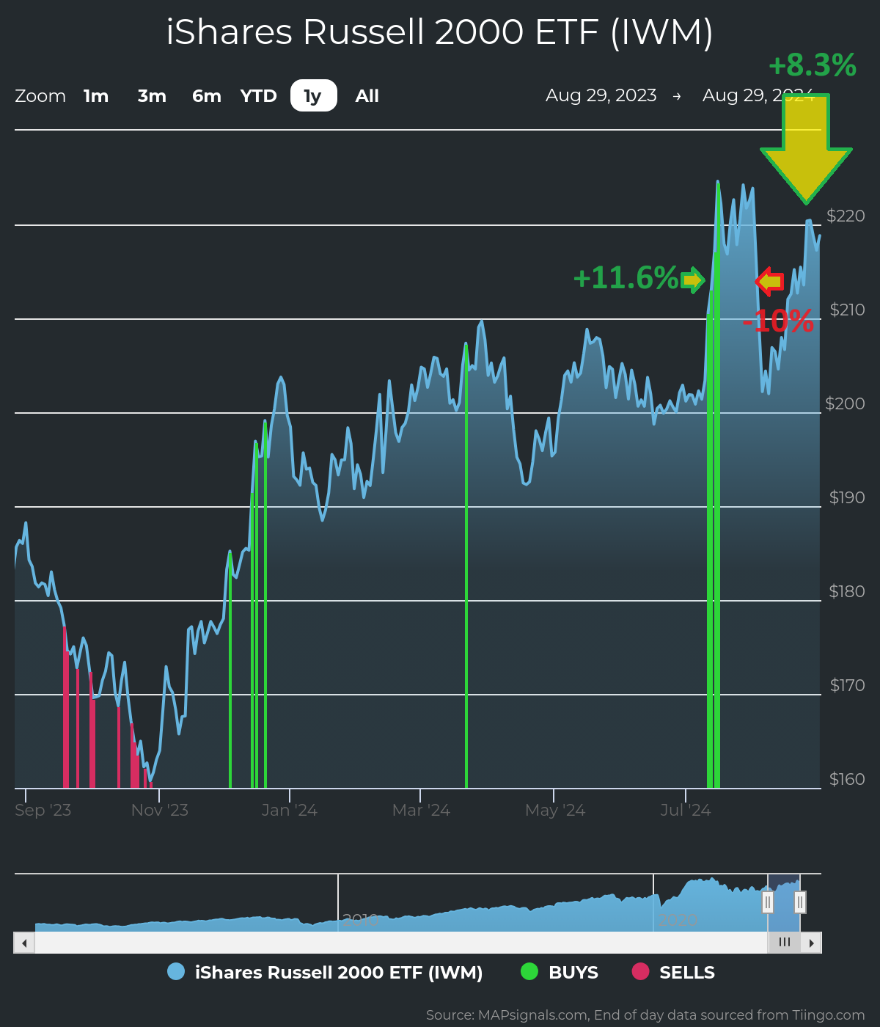
In July, we saw an epic rally of the Russell 2000 only to reverse during that first week of August. IWM (the Russell 2000 tracking ETF) rallied 11.6% in just six trading sessions. It then dropped 10% to the August 7th lows. The key here is that it has been slowly rallying ever since then – by another 8.3%:
Graphs are for illustrative and discussion purposes only. Please read important disclosures at the end of this commentary.
What’s really interesting here is the rate of change between heavy selling and virtually no selling.
On Monday, August 5th, there were 374 unusually large selling signals. By August 25th, selling had dropped to just eight sells. It created this visible vacuum of selling, which you can see here:
Graphs are for illustrative and discussion purposes only. Please read important disclosures at the end of this commentary.
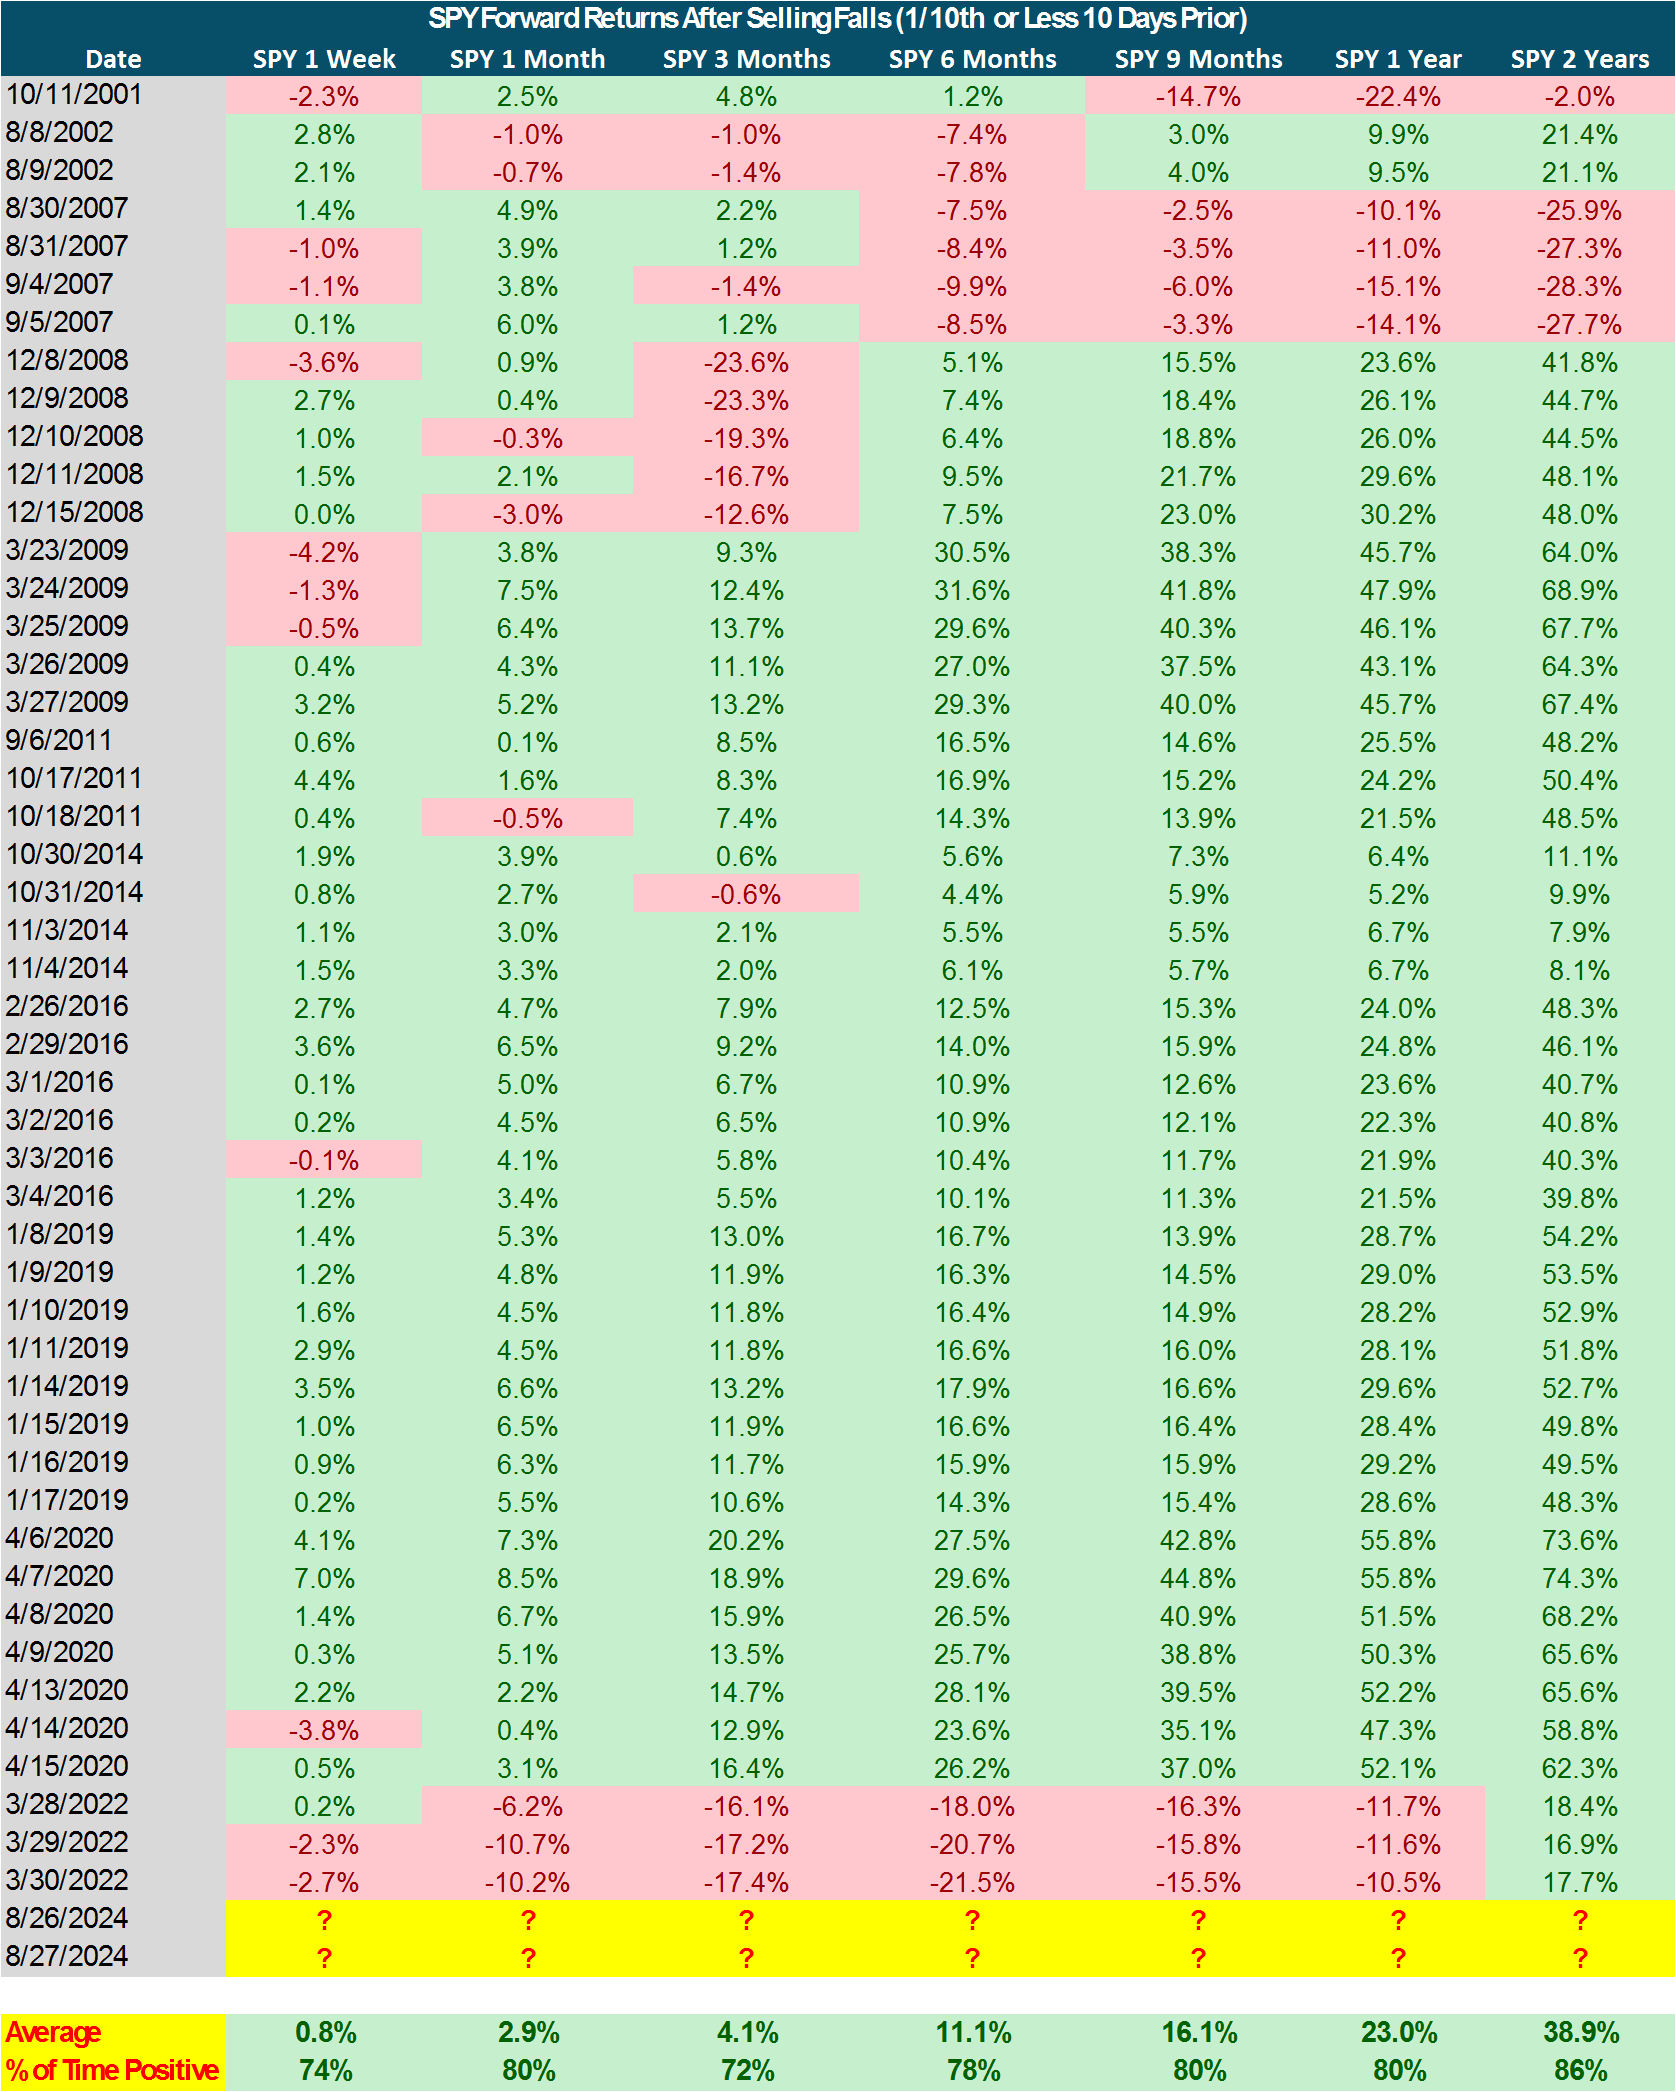
I found this curious and wanted to see similar periods in history to this, and what we could gleam from it, so I went back in my data history since 1990 to find similar times where selling had a wicked peak (a minimum of 100 sell signals) and then plummeted to just 10% or less 10 days later.
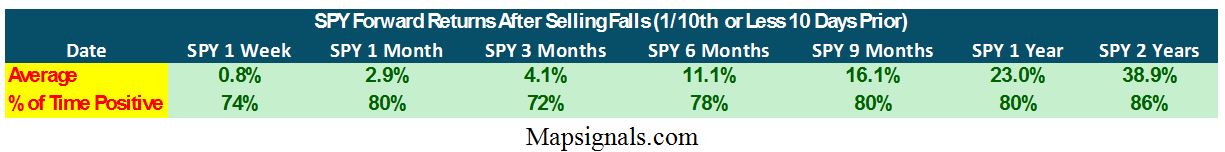
There were 48 prior instances to August 26th and 27th spanning 12 years. The key takeaway is that forward returns for SPY (the S&P 500 tracking ETF) were solidly positive over various time frames. Better yet, the returns were positive a vast majority of the time:
Graphs are for illustrative and discussion purposes only. Please read important disclosures at the end of this commentary.
Here is a detailed study with each instance when selling dropped to 10% or less 10 days later:
Mapsignals.com
Graphs are for illustrative and discussion purposes only. Please read important disclosures at the end of this commentary.
As I write, it’s Labor Day and there’s not much going on. In fact, one could get pessimistic knowing we are about to enter the seasonally weakest month of the year, September. Then we approach an election fraught with anxiety between two flawed candidates. It’s enough to sow the seeds of pessimism.
There is, however, cause for excitement when we look at the mounting supporting evidence for what I believe will be a bull run. This latest vacuum of selling just adds to the thesis. Rates are set to fall, and stocks are set to zoom – especially small- and mid-cap stocks based on my research. Add to this the seasonally strongest time of year being the fourth quarter and we have a lot of upside to look forward to.
So don’t get focused on the negative minutiae. Instead, focus on the positive horizon.
“Pessimism leads to weakness, optimism to power.” – William James
All content above represents the opinion of Jason Bodner of Navellier & Associates, Inc.
Also In This Issue
A Look Ahead by Louis Navellier
Nvidia Delivers Spectacular Earnings Report
Income Mail by Bryan Perry
Turning Volatility Into AI-Related Covered Call Trading Strategy
Growth Mail by Gary Alexander
A 1949 Book Provides a Key to Puncturing Political Panaceas
Global Mail by Ivan Martchev
Will This be a September to Remember?
Sector Spotlight by Jason Bodner
August is Mercifully Over – Will the Market Return to Reality?
View Full Archive
Read Past Issues Here

Jason Bodner
MARKETMAIL EDITOR FOR SECTOR SPOTLIGHT
Jason Bodner writes Sector Spotlight in the weekly Marketmail publication and has authored several white papers for the company. He is also Co-Founder of Macro Analytics for Professionals which produces proprietary equity accumulation and distribution research for its clients. Previously, Mr. Bodner served as Director of European Equity Derivatives for Cantor Fitzgerald Europe in London, then moved to the role of Head of Equity Derivatives North America for the same company in New York. He also served as S.V.P. Equity Derivatives for Jefferies, LLC. He received a B.S. in business administration in 1996, with honors, from Skidmore College as a member of the Periclean Honors Society. All content of “Sector Spotlight” represents the opinion of Jason Bodner
Important Disclosures:
Jason Bodner is a co-founder and co-owner of Mapsignals. Mr. Bodner is an independent contractor who is occasionally hired by Navellier & Associates to write an article and or provide opinions for possible use in articles that appear in Navellier & Associates weekly Market Mail. Mr. Bodner is not employed or affiliated with Louis Navellier, Navellier & Associates, Inc., or any other Navellier owned entity. The opinions and statements made here are those of Mr. Bodner and not necessarily those of any other persons or entities. This is not an endorsement, or solicitation or testimonial or investment advice regarding the BMI Index or any statements or recommendations or analysis in the article or the BMI Index or Mapsignals or its products or strategies.
Although information in these reports has been obtained from and is based upon sources that Navellier believes to be reliable, Navellier does not guarantee its accuracy and it may be incomplete or condensed. All opinions and estimates constitute Navellier’s judgment as of the date the report was created and are subject to change without notice. These reports are for informational purposes only and are not a solicitation for the purchase or sale of a security. Any decision to purchase securities mentioned in these reports must take into account existing public information on such securities or any registered prospectus.To the extent permitted by law, neither Navellier & Associates, Inc., nor any of its affiliates, agents, or service providers assumes any liability or responsibility nor owes any duty of care for any consequences of any person acting or refraining to act in reliance on the information contained in this communication or for any decision based on it.
Past performance is no indication of future results. Investment in securities involves significant risk and has the potential for partial or complete loss of funds invested. It should not be assumed that any securities recommendations made by Navellier. in the future will be profitable or equal the performance of securities made in this report. Dividend payments are not guaranteed. The amount of a dividend payment, if any, can vary over time and issuers may reduce dividends paid on securities in the event of a recession or adverse event affecting a specific industry or issuer.
None of the stock information, data, and company information presented herein constitutes a recommendation by Navellier or a solicitation to buy or sell any securities. Any specific securities identified and described do not represent all of the securities purchased, sold, or recommended for advisory clients. The holdings identified do not represent all of the securities purchased, sold, or recommended for advisory clients and the reader should not assume that investments in the securities identified and discussed were or will be profitable.
Information presented is general information that does not take into account your individual circumstances, financial situation, or needs, nor does it present a personalized recommendation to you. Individual stocks presented may not be suitable for every investor. Investment in securities involves significant risk and has the potential for partial or complete loss of funds invested. Investment in fixed income securities has the potential for the investment return and principal value of an investment to fluctuate so that an investor’s holdings, when redeemed, may be worth less than their original cost.
One cannot invest directly in an index. Index is unmanaged and index performance does not reflect deduction of fees, expenses, or taxes. Presentation of Index data does not reflect a belief by Navellier that any stock index constitutes an investment alternative to any Navellier equity strategy or is necessarily comparable to such strategies. Among the most important differences between the Indices and Navellier strategies are that the Navellier equity strategies may (1) incur material management fees, (2) concentrate its investments in relatively few stocks, industries, or sectors, (3) have significantly greater trading activity and related costs, and (4) be significantly more or less volatile than the Indices.
ETF Risk: We may invest in exchange traded funds (“ETFs”) and some of our investment strategies are generally fully invested in ETFs. Like traditional mutual funds, ETFs charge asset-based fees, but they generally do not charge initial sales charges or redemption fees and investors typically pay only customary brokerage fees to buy and sell ETF shares. The fees and costs charged by ETFs held in client accounts will not be deducted from the compensation the client pays Navellier. ETF prices can fluctuate up or down, and a client account could lose money investing in an ETF if the prices of the securities owned by the ETF go down. ETFs are subject to additional risks:
- ETF shares may trade above or below their net asset value;
- An active trading market for an ETF’s shares may not develop or be maintained;
- The value of an ETF may be more volatile than the underlying portfolio of securities the ETF is designed to track;
- The cost of owning shares of the ETF may exceed those a client would incur by directly investing in the underlying securities and;
- Trading of an ETF’s shares may be halted if the listing exchange’s officials deem it appropriate, the shares are delisted from the exchange, or the activation of market-wide “circuit breakers” (which are tied to large decreases in stock prices) halts stock trading generally.
Grader Disclosures: Investment in equity strategies involves substantial risk and has the potential for partial or complete loss of funds invested. The sample portfolio and any accompanying charts are for informational purposes only and are not to be construed as a solicitation to buy or sell any financial instrument and should not be relied upon as the sole factor in an investment making decision. As a matter of normal and important disclosures to you, as a potential investor, please consider the following: The performance presented is not based on any actual securities trading, portfolio, or accounts, and the reported performance of the A, B, C, D, and F portfolios (collectively the “model portfolios”) should be considered mere “paper” or pro forma performance results based on Navellier’s research.
Investors evaluating any of Navellier & Associates, Inc.’s, (or its affiliates’) Investment Products must not use any information presented here, including the performance figures of the model portfolios, in their evaluation of any Navellier Investment Products. Navellier Investment Products include the firm’s mutual funds and managed accounts. The model portfolios, charts, and other information presented do not represent actual funded trades and are not actual funded portfolios. There are material differences between Navellier Investment Products’ portfolios and the model portfolios, research, and performance figures presented here. The model portfolios and the research results (1) may contain stocks or ETFs that are illiquid and difficult to trade; (2) may contain stock or ETF holdings materially different from actual funded Navellier Investment Product portfolios; (3) include the reinvestment of all dividends and other earnings, estimated trading costs, commissions, or management fees; and, (4) may not reflect prices obtained in an actual funded Navellier Investment Product portfolio. For these and other reasons, the reported performances of model portfolios do not reflect the performance results of Navellier’s actually funded and traded Investment Products. In most cases, Navellier’s Investment Products have materially lower performance results than the performances of the model portfolios presented.
This report contains statements that are, or may be considered to be, forward-looking statements. All statements that are not historical facts, including statements about our beliefs or expectations, are “forward-looking statements” within the meaning of The U.S. Private Securities Litigation Reform Act of 1995. These statements may be identified by such forward-looking terminology as “expect,” “estimate,” “plan,” “intend,” “believe,” “anticipate,” “may,” “will,” “should,” “could,” “continue,” “project,” or similar statements or variations of such terms. Our forward-looking statements are based on a series of expectations, assumptions, and projections, are not guarantees of future results or performance, and involve substantial risks and uncertainty as described in Form ADV Part 2A of our filing with the Securities and Exchange Commission (SEC), which is available at www.adviserinfo.sec.gov or by requesting a copy by emailing info@navellier.com. All of our forward-looking statements are as of the date of this report only. We can give no assurance that such expectations or forward-looking statements will prove to be correct. Actual results may differ materially. You are urged to carefully consider all such factors.
FEDERAL TAX ADVICE DISCLAIMER: As required by U.S. Treasury Regulations, you are informed that, to the extent this presentation includes any federal tax advice, the presentation is not written by Navellier to be used, and cannot be used, for the purpose of avoiding federal tax penalties. Navellier does not advise on any income tax requirements or issues. Use of any information presented by Navellier is for general information only and does not represent tax advice either express or implied. You are encouraged to seek professional tax advice for income tax questions and assistance.
IMPORTANT NEWSLETTER DISCLOSURE:The hypothetical performance results for investment newsletters that are authored or edited by Louis Navellier, including Louis Navellier’s Growth Investor, Louis Navellier’s Breakthrough Stocks, Louis Navellier’s Accelerated Profits, and Louis Navellier’s Platinum Club, are not based on any actual securities trading, portfolio, or accounts, and the newsletters’ reported hypothetical performances should be considered mere “paper” or proforma hypothetical performance results and are not actual performance of real world trades. Navellier & Associates, Inc. does not have any relation to or affiliation with the owner of these newsletters. There are material differences between Navellier Investment Products’ portfolios and the InvestorPlace Media, LLC newsletter portfolios authored by Louis Navellier. The InvestorPlace Media, LLC newsletters contain hypothetical performance that do not include transaction costs, advisory fees, or other fees a client might incur if actual investments and trades were being made by an investor. As a result, newsletter performance should not be used to evaluate Navellier Investment services which are separate and different from the newsletters. The owner of the newsletters is InvestorPlace Media, LLC and any questions concerning the newsletters, including any newsletter advertising or hypothetical Newsletter performance claims, (which are calculated solely by Investor Place Media and not Navellier) should be referred to InvestorPlace Media, LLC at (800) 718-8289.
Please note that Navellier & Associates and the Navellier Private Client Group are managed completely independent of the newsletters owned and published by InvestorPlace Media, LLC and written and edited by Louis Navellier, and investment performance of the newsletters should in no way be considered indicative of potential future investment performance for any Navellier & Associates separately managed account portfolio. Potential investors should consult with their financial advisor before investing in any Navellier Investment Product.
Navellier claims compliance with Global Investment Performance Standards (GIPS). To receive a complete list and descriptions of Navellier’s composites and/or a presentation that adheres to the GIPS standards, please contact Navellier or click here. It should not be assumed that any securities recommendations made by Navellier & Associates, Inc. in the future will be profitable or equal the performance of securities made in this report.
FactSet Disclosure: Navellier does not independently calculate the statistical information included in the attached report. The calculation and the information are provided by FactSet, a company not related to Navellier. Although information contained in the report has been obtained from FactSet and is based on sources Navellier believes to be reliable, Navellier does not guarantee its accuracy, and it may be incomplete or condensed. The report and the related FactSet sourced information are provided on an “as is” basis. The user assumes the entire risk of any use made of this information. Investors should consider the report as only a single factor in making their investment decision. The report is for informational purposes only and is not intended as an offer or solicitation for the purchase or sale of a security. FactSet sourced information is the exclusive property of FactSet. Without prior written permission of FactSet, this information may not be reproduced, disseminated or used to create any financial products. All indices are unmanaged and performance of the indices include reinvestment of dividends and interest income, unless otherwise noted, are not illustrative of any particular investment and an investment cannot be made in any index. Past performance is no guarantee of future results.