by Ivan Martchev
September 23, 2025
In trading lingo, there are plenty of common sense sayings that need to be respected. “The trend is your friend” is one of the more common axioms. So, where is the trend of the market now? Up!
“Don’t fight the Fed” is another favorite saying, so what is the Fed doing now? Cutting interest rates, fueling all-time highs for the S&P 500. A third-popular saying – born in the time when stock prices were transmitted via telegraph and ticker tape – is “Don’t fight the tape.” Translated, that meant “reading the tape,” with an eye toward figuring out how the market is acting, in order to position oneself accordingly.

Reading today’s “digital-tape,” the stock market looks to be very extended, but there is a saying for that, too. British economist John Maynard Keynes put it this way: “The market can be irrational longer than you can be solvent.” With that saying in mind, here are some observations.
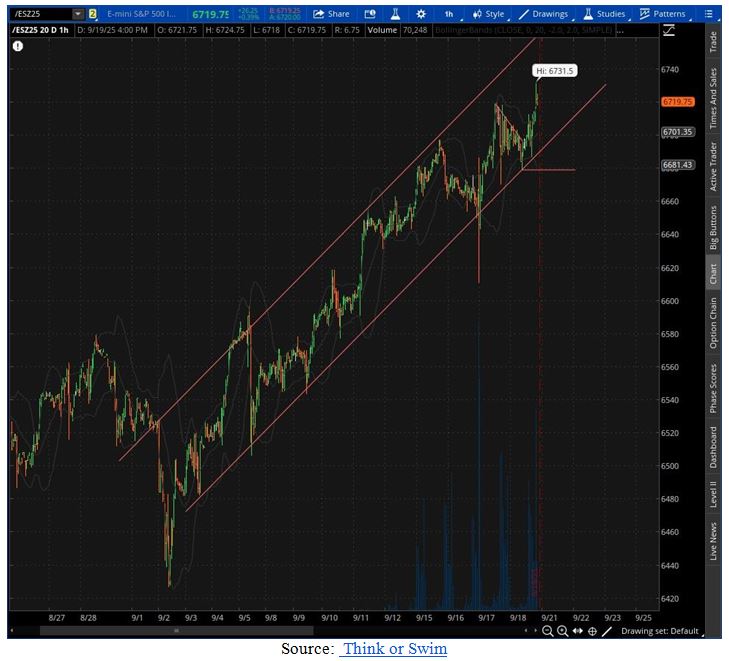
First, the chart below shows how the December S&P futures have performed for the whole of September.
Graphs are for illustrative and discussion purposes only. Please read important disclosures at the end of this commentary.
The September S&P futures expired last Friday on quadruple-witching expiration day, which is one reason why the stock market ran up going into Friday. Quad-witching expirations at the end of a big rally often mark a short-term top, or a “buying-climax,” even though that has not yet become obvious. If Friday marked a top, that fact should become crystal clear in the next five-trading days (by September 30).
If the December S&P futures start to trade below Friday’s lows – or better yet, close below that key level – they would be violating hourly support trend-lines that have held for the last 300 S&P points. That would probably mean that a sharp pullback has started. The biggest pullback in this surge was over 200-points in late July and early August. A great trader told me to “never lose sight of the hourlies.” If you go back and study hourly trend-lines over the summer, you will see sizable pullbacks – not hard to spot ahead of time.
Remember that a pullback is different from a correction, as a pullback tends to reverse very quickly as the stock market makes new all-time highs. We will know if a pullback has turned into a correction if the S&P 500 begins to trend lower, below 6400, as that level will be below several key moving-averages.
The market is certainly due for a correction, but the stupidest thing one can do is to declare that the rally is either irrational or crazy and then bet on a pullback before it has started in earnest.
What Other World Markets Tell Us About America’s Market
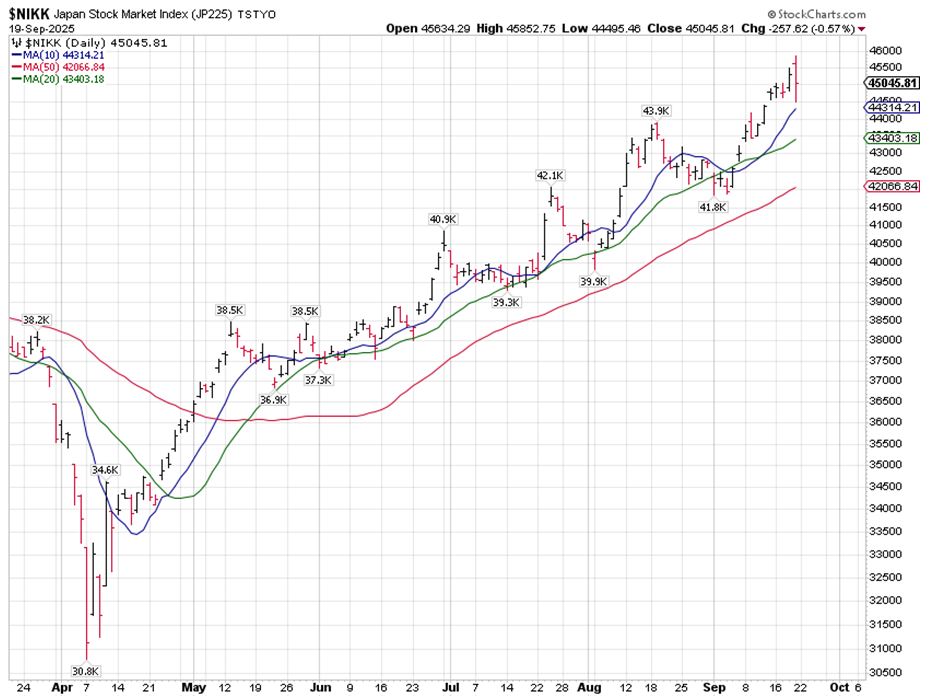
I can spend all day talking about interest rates and credit spreads, but individual investors love charts and many readers of this missive are individual investors, so here are some more observations on the Nikkei 225, based on the fact that one famous investment strategist based in Asia used to say all the time that the Japanese are the ultimate momentum traders and that charts are not pure hocus-pocus.
Graphs are for illustrative and discussion purposes only. Please read important disclosures at the end of this commentary.
If you look closely, you will see beyond a beautiful uptrend and some very dramatic action last Friday.
Bear in mind that Nikkei cash trading runs from 8 pm Eastern Time on Thursday in America (which is morning in Japan), until 2 am Eastern Time. Because Nikkei futures trade 24-hours a day, both in Chicago and Singapore, the index can be more “gappy” from day to day as European markets and the U.S. markets can pull and push Nikkei stock index futures quite a bit before Nikkei cash-trading has even started.
That said, late on Thursday night after Nikkei cash trading had already started, I saw some dramatic moves in the Nikkei as I was waiting for the Bank of Japan to come up with their version of an FOMC statement, which did not disappoint – if one was looking for drama. The chart shows only a 257-point decline in the Nikkei, but it also shows that it was up a lot at the open, so it had a 1350-point sell-off from the opening highs before rebounding. The reason for such aggressive selling at an all-time high was that the Bank of Japan statement implied they would begin selling some of their stock holdings.
Unlike the Fed, which officially does not buy U.S. stocks, the BOJ did buy a lot of Japanese stocks to support the Japanese stock market. From the Taipei Times, we read:
“The BOJ’s ETF holdings are worth about 3-trillion by book value and was about ¥74.5-trillion at market value at the end of March. It became the single biggest holder of Japanese stocks in 2020 during its massive monetary easing program, which ended last year. While the bank stopped its regular buying of ETFs some time ago, the value of its holdings has continued to rise as the stock market hit record highs earlier this week. The Nikkei 225 has gained about 26-percent since the start of this fiscal year.”
Book value is what they bought them at, market value is what they are worth now or $537-billion at current exchange rates. While the BOJ will be selling slowly over many years, this press statement from the BOJ for Japanese futures traders was like feeding red-meat to hungry dogs.
What the Nikkei exhibited on Friday is what Japanese traders call a bearish engulfing pattern, or a high-volume big range reversal that comes at a high. Such messy trading often signifies a trend change from up to down. Because the Japanese are the ultimate momentum traders, I think they will run with the ball they have been given by the BOJ and press the Nikkei lower about 3 to 5%.
At a minimum, I see very high chances of a sharp pullback in the Nikkei index.
But what about the German DAX Index?
Graphs are for illustrative and discussion purposes only. Please read important disclosures at the end of this commentary.
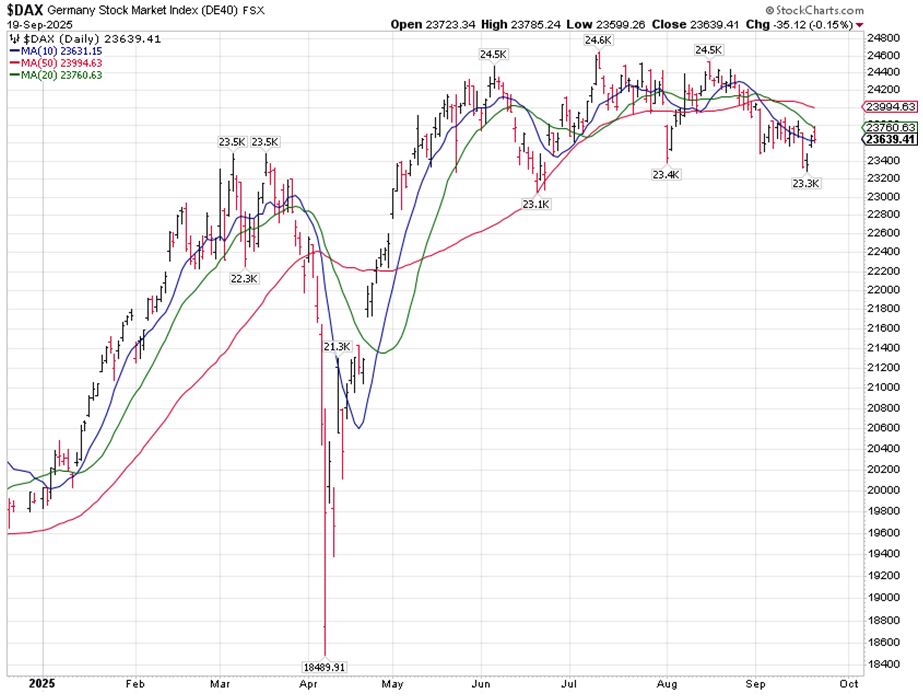
The German DAX outperformed the S&P dramatically in January and February, but since June it has been as flat as a pancake, while the S&P 500 has begun to outperform dramatically. The reason why the S&P 500 outperformed so dramatically over the past 15-years is mostly the technology sector in the U.S. About 40% of the value of the S&P 500 Index is in its top 10-components, only two of which are non-technology. The eight technology giants are the Mag 7 plus a famous electric car company, which is a technology company as far as I am concerned. Those companies are about 70% of the value of the NASDAQ 100.
It appears that the EU, and Germany in particular, completely missed the boat on digital transformation of the world economy. They are falling behind as the digital business is dominated by U.S. companies (and increasingly Chinese ones). Still, the DAX Index does have some indication of where the winds in investor sentiment are blowing in Europe, and those investors do not feel very bullish. All key short-term moving-averages in the DAX (10, 20 and 50-day) are pointing lower. This index is sending bearish vibes and the most likely thing one would expect here is a deeper sell-off. Some deep pocketed investors have been selling into strength for a while, and they may tip the market into a further sell-off.
To recap, the Nikkei had a highly potent bearish reversal Friday, and the DAX looks outright miserable. If they are sending any signals as to where the S&P 500 is headed next, it is at a minimum a sharp pullback.
All content above represents the opinion of Ivan Martchev of Navellier & Associates, Inc.
Also In This Issue
A Look Ahead by Louis Navellier
The Case for More Interest Rate Cuts in 2025
Income Mail by Bryan Perry
Russell 2000 Delivers Broad-Based Rally Confirmation
Growth Mail by Gary Alexander
In Market Lingo, a “Fall” (Season) Means a Rise (in Stocks)
Global Mail by Ivan Martchev
We’re In “Thin-Air” Territory in the U.S. Stock Market
Sector Spotlight by Jason Bodner
Welcome to the “Bamboo” Market
View Full Archive
Read Past Issues Here

Ivan Martchev
INVESTMENT STRATEGIST
Ivan Martchev is an investment strategist with Navellier. Previously, Ivan served as editorial director at InvestorPlace Media. Ivan was editor of Louis Rukeyser’s Mutual Funds and associate editor of Personal Finance. Ivan is also co-author of The Silk Road to Riches (Financial Times Press). The book provided analysis of geopolitical issues and investment strategy in natural resources and emerging markets with an emphasis on Asia. The book also correctly predicted the collapse in the U.S. real estate market, the rise of precious metals, and the resulting increased investor interest in emerging markets. Ivan’s commentaries have been published by MSNBC, The Motley Fool, MarketWatch, and others. All content of “Global Mail” represents the opinion of Ivan Martchev
Important Disclosures:
Although information in these reports has been obtained from and is based upon sources that Navellier believes to be reliable, Navellier does not guarantee its accuracy and it may be incomplete or condensed. All opinions and estimates constitute Navellier’s judgment as of the date the report was created and are subject to change without notice. These reports are for informational purposes only and are not a solicitation for the purchase or sale of a security. Any decision to purchase securities mentioned in these reports must take into account existing public information on such securities or any registered prospectus.To the extent permitted by law, neither Navellier & Associates, Inc., nor any of its affiliates, agents, or service providers assumes any liability or responsibility nor owes any duty of care for any consequences of any person acting or refraining to act in reliance on the information contained in this communication or for any decision based on it.
Past performance is no indication of future results. Investment in securities involves significant risk and has the potential for partial or complete loss of funds invested. It should not be assumed that any securities recommendations made by Navellier. in the future will be profitable or equal the performance of securities made in this report. Dividend payments are not guaranteed. The amount of a dividend payment, if any, can vary over time and issuers may reduce dividends paid on securities in the event of a recession or adverse event affecting a specific industry or issuer.
None of the stock information, data, and company information presented herein constitutes a recommendation by Navellier or a solicitation to buy or sell any securities. Any specific securities identified and described do not represent all of the securities purchased, sold, or recommended for advisory clients. The holdings identified do not represent all of the securities purchased, sold, or recommended for advisory clients and the reader should not assume that investments in the securities identified and discussed were or will be profitable.
Information presented is general information that does not take into account your individual circumstances, financial situation, or needs, nor does it present a personalized recommendation to you. Individual stocks presented may not be suitable for every investor. Investment in securities involves significant risk and has the potential for partial or complete loss of funds invested. Investment in fixed income securities has the potential for the investment return and principal value of an investment to fluctuate so that an investor’s holdings, when redeemed, may be worth less than their original cost.
One cannot invest directly in an index. Index is unmanaged and index performance does not reflect deduction of fees, expenses, or taxes. Presentation of Index data does not reflect a belief by Navellier that any stock index constitutes an investment alternative to any Navellier equity strategy or is necessarily comparable to such strategies. Among the most important differences between the Indices and Navellier strategies are that the Navellier equity strategies may (1) incur material management fees, (2) concentrate its investments in relatively few stocks, industries, or sectors, (3) have significantly greater trading activity and related costs, and (4) be significantly more or less volatile than the Indices.
ETF Risk: We may invest in exchange traded funds (“ETFs”) and some of our investment strategies are generally fully invested in ETFs. Like traditional mutual funds, ETFs charge asset-based fees, but they generally do not charge initial sales charges or redemption fees and investors typically pay only customary brokerage fees to buy and sell ETF shares. The fees and costs charged by ETFs held in client accounts will not be deducted from the compensation the client pays Navellier. ETF prices can fluctuate up or down, and a client account could lose money investing in an ETF if the prices of the securities owned by the ETF go down. ETFs are subject to additional risks:
- ETF shares may trade above or below their net asset value;
- An active trading market for an ETF’s shares may not develop or be maintained;
- The value of an ETF may be more volatile than the underlying portfolio of securities the ETF is designed to track;
- The cost of owning shares of the ETF may exceed those a client would incur by directly investing in the underlying securities; and
- Trading of an ETF’s shares may be halted if the listing exchange’s officials deem it appropriate, the shares are delisted from the exchange, or the activation of market-wide “circuit breakers” (which are tied to large decreases in stock prices) halts stock trading generally.
Grader Disclosures: Investment in equity strategies involves substantial risk and has the potential for partial or complete loss of funds invested. The sample portfolio and any accompanying charts are for informational purposes only and are not to be construed as a solicitation to buy or sell any financial instrument and should not be relied upon as the sole factor in an investment making decision. As a matter of normal and important disclosures to you, as a potential investor, please consider the following: The performance presented is not based on any actual securities trading, portfolio, or accounts, and the reported performance of the A, B, C, D, and F portfolios (collectively the “model portfolios”) should be considered mere “paper” or pro forma performance results based on Navellier’s research.
Investors evaluating any of Navellier & Associates, Inc.’s, (or its affiliates’) Investment Products must not use any information presented here, including the performance figures of the model portfolios, in their evaluation of any Navellier Investment Products. Navellier Investment Products include the firm’s mutual funds and managed accounts. The model portfolios, charts, and other information presented do not represent actual funded trades and are not actual funded portfolios. There are material differences between Navellier Investment Products’ portfolios and the model portfolios, research, and performance figures presented here. The model portfolios and the research results (1) may contain stocks or ETFs that are illiquid and difficult to trade; (2) may contain stock or ETF holdings materially different from actual funded Navellier Investment Product portfolios; (3) include the reinvestment of all dividends and other earnings, estimated trading costs, commissions, or management fees; and, (4) may not reflect prices obtained in an actual funded Navellier Investment Product portfolio. For these and other reasons, the reported performances of model portfolios do not reflect the performance results of Navellier’s actually funded and traded Investment Products. In most cases, Navellier’s Investment Products have materially lower performance results than the performances of the model portfolios presented.
This report contains statements that are, or may be considered to be, forward-looking statements. All statements that are not historical facts, including statements about our beliefs or expectations, are “forward-looking statements” within the meaning of The U.S. Private Securities Litigation Reform Act of 1995. These statements may be identified by such forward-looking terminology as “expect,” “estimate,” “plan,” “intend,” “believe,” “anticipate,” “may,” “will,” “should,” “could,” “continue,” “project,” or similar statements or variations of such terms. Our forward-looking statements are based on a series of expectations, assumptions, and projections, are not guarantees of future results or performance, and involve substantial risks and uncertainty as described in Form ADV Part 2A of our filing with the Securities and Exchange Commission (SEC), which is available at www.adviserinfo.sec.gov or by requesting a copy by emailing info@navellier.com. All of our forward-looking statements are as of the date of this report only. We can give no assurance that such expectations or forward-looking statements will prove to be correct. Actual results may differ materially. You are urged to carefully consider all such factors.
FEDERAL TAX ADVICE DISCLAIMER: As required by U.S. Treasury Regulations, you are informed that, to the extent this presentation includes any federal tax advice, the presentation is not written by Navellier to be used, and cannot be used, for the purpose of avoiding federal tax penalties. Navellier does not advise on any income tax requirements or issues. Use of any information presented by Navellier is for general information only and does not represent tax advice either express or implied. You are encouraged to seek professional tax advice for income tax questions and assistance.
IMPORTANT NEWSLETTER DISCLOSURE:The hypothetical performance results for investment newsletters that are authored or edited by Louis Navellier, including Louis Navellier’s Growth Investor, Louis Navellier’s Breakthrough Stocks, Louis Navellier’s Accelerated Profits, and Louis Navellier’s Platinum Club, are not based on any actual securities trading, portfolio, or accounts, and the newsletters’ reported hypothetical performances should be considered mere “paper” or proforma hypothetical performance results and are not actual performance of real world trades. Navellier & Associates, Inc. does not have any relation to or affiliation with the owner of these newsletters. There are material differences between Navellier Investment Products’ portfolios and the InvestorPlace Media, LLC newsletter portfolios authored by Louis Navellier. The InvestorPlace Media, LLC newsletters contain hypothetical performance that do not include transaction costs, advisory fees, or other fees a client might incur if actual investments and trades were being made by an investor. As a result, newsletter performance should not be used to evaluate Navellier Investment services which are separate and different from the newsletters. The owner of the newsletters is InvestorPlace Media, LLC and any questions concerning the newsletters, including any newsletter advertising or hypothetical Newsletter performance claims, (which are calculated solely by Investor Place Media and not Navellier) should be referred to InvestorPlace Media, LLC at (800) 718-8289.
Please note that Navellier & Associates and the Navellier Private Client Group are managed completely independent of the newsletters owned and published by InvestorPlace Media, LLC and written and edited by Louis Navellier, and investment performance of the newsletters should in no way be considered indicative of potential future investment performance for any Navellier & Associates separately managed account portfolio. Potential investors should consult with their financial advisor before investing in any Navellier Investment Product.
Navellier claims compliance with Global Investment Performance Standards (GIPS). To receive a complete list and descriptions of Navellier’s composites and/or a presentation that adheres to the GIPS standards, please contact Navellier or click here. It should not be assumed that any securities recommendations made by Navellier & Associates, Inc. in the future will be profitable or equal the performance of securities made in this report.
FactSet Disclosure: Navellier does not independently calculate the statistical information included in the attached report. The calculation and the information are provided by FactSet, a company not related to Navellier. Although information contained in the report has been obtained from FactSet and is based on sources Navellier believes to be reliable, Navellier does not guarantee its accuracy, and it may be incomplete or condensed. The report and the related FactSet sourced information are provided on an “as is” basis. The user assumes the entire risk of any use made of this information. Investors should consider the report as only a single factor in making their investment decision. The report is for informational purposes only and is not intended as an offer or solicitation for the purchase or sale of a security. FactSet sourced information is the exclusive property of FactSet. Without prior written permission of FactSet, this information may not be reproduced, disseminated or used to create any financial products. All indices are unmanaged and performance of the indices include reinvestment of dividends and interest income, unless otherwise noted, are not illustrative of any particular investment and an investment cannot be made in any index. Past performance is no guarantee of future results.