by Jason Bodner
September 17, 2024
This is an exciting time for stocks.
It may not be as exciting as when the whole idea for a stock market started more than 400 years ago! That was in 1602, when the Dutch East India Company issued shares, which led to the creation of the oldest stock exchange, the Amsterdam Exchange, now known as Euro-next.
But today’s market is exciting, all the same. And that’s because we are on the precipice of a policy change at the Fed this week. Interest rates are set to commence a retreat, for the first time in years.
The market is already showing signs of pre-digesting this rate change. This week, I’ll go over some of the tell-tale signs that the market is prepared for lower rates, and I will also show you why the data of unusual buying and selling reveals bullish signs ahead.
So, let’s ignore the rhetoric, the pundits, and the headlines bent on spreading fear. Let’s lock in on the hard data and look towards the horizon. I assure you that it is a bright one.
What the Big Money Index is Telling Us Now
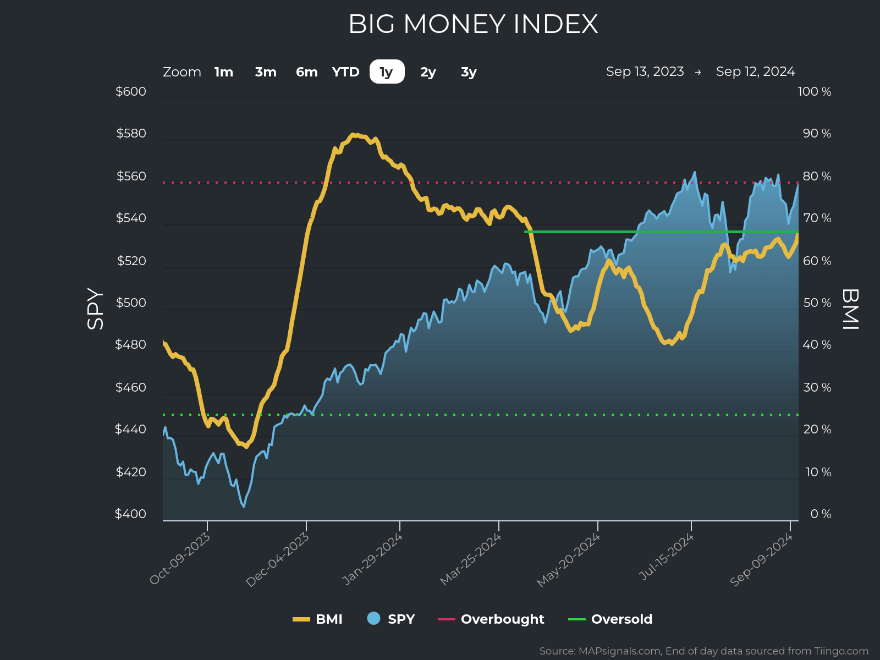
My favorite place to begin is with my old reliable indicator, which has to do with unusual money flows. The Big Money Index (BMI) measures unusual institutional money flows over a 25-day moving average. Here, we can often get a sense of what the big investors are positioning for, in terms of risk appetite.
History tells us that during election years, September and October are often weak. And this September certainly started out that way, but – as we saw in August – much can change in a week’s time. As we can see below, since early September’s weakness, money has been flowing into stocks. And the latest uptick in the BMI is a convincing one. The BMI just reached five-month highs, not seen since April of this year:
Graphs are for illustrative and discussion purposes only. Please read important disclosures at the end of this commentary.
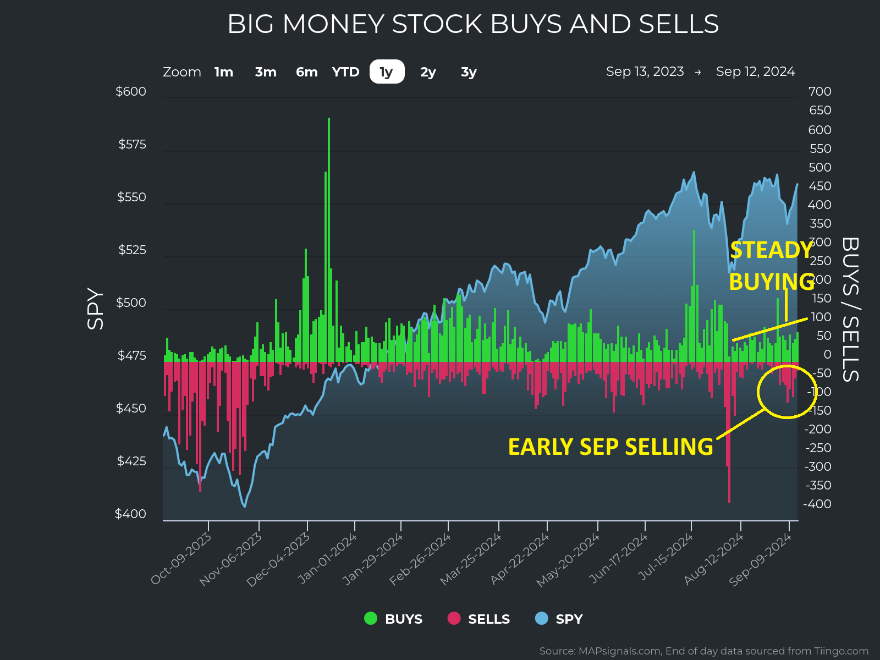
This is reinforced when we drill down into the daily unusual buy and sell counts. We see that some moderate selling took place early this month, only to be replaced with steadily increasing buying:
Graphs are for illustrative and discussion purposes only. Please read important disclosures at the end of this commentary.
This is great news. We should always prepare for weak and volatile Septembers, and bumpy Octobers during election years. But we should also welcome a nice inflow of money into stocks.
Volatility is not always a matter of stock prices falling. While the term has become synonymous with gut-wrenching drops in stock prices, volatility just means that things are moving around a lot – up or down.
The New Leading Sectors in Late 2024
This year has shown massive volatility that is not necessarily visible in the overall indexes. Some of the most wicked volatility is happening as sectors rotate and jostle for higher places on the totem pole.
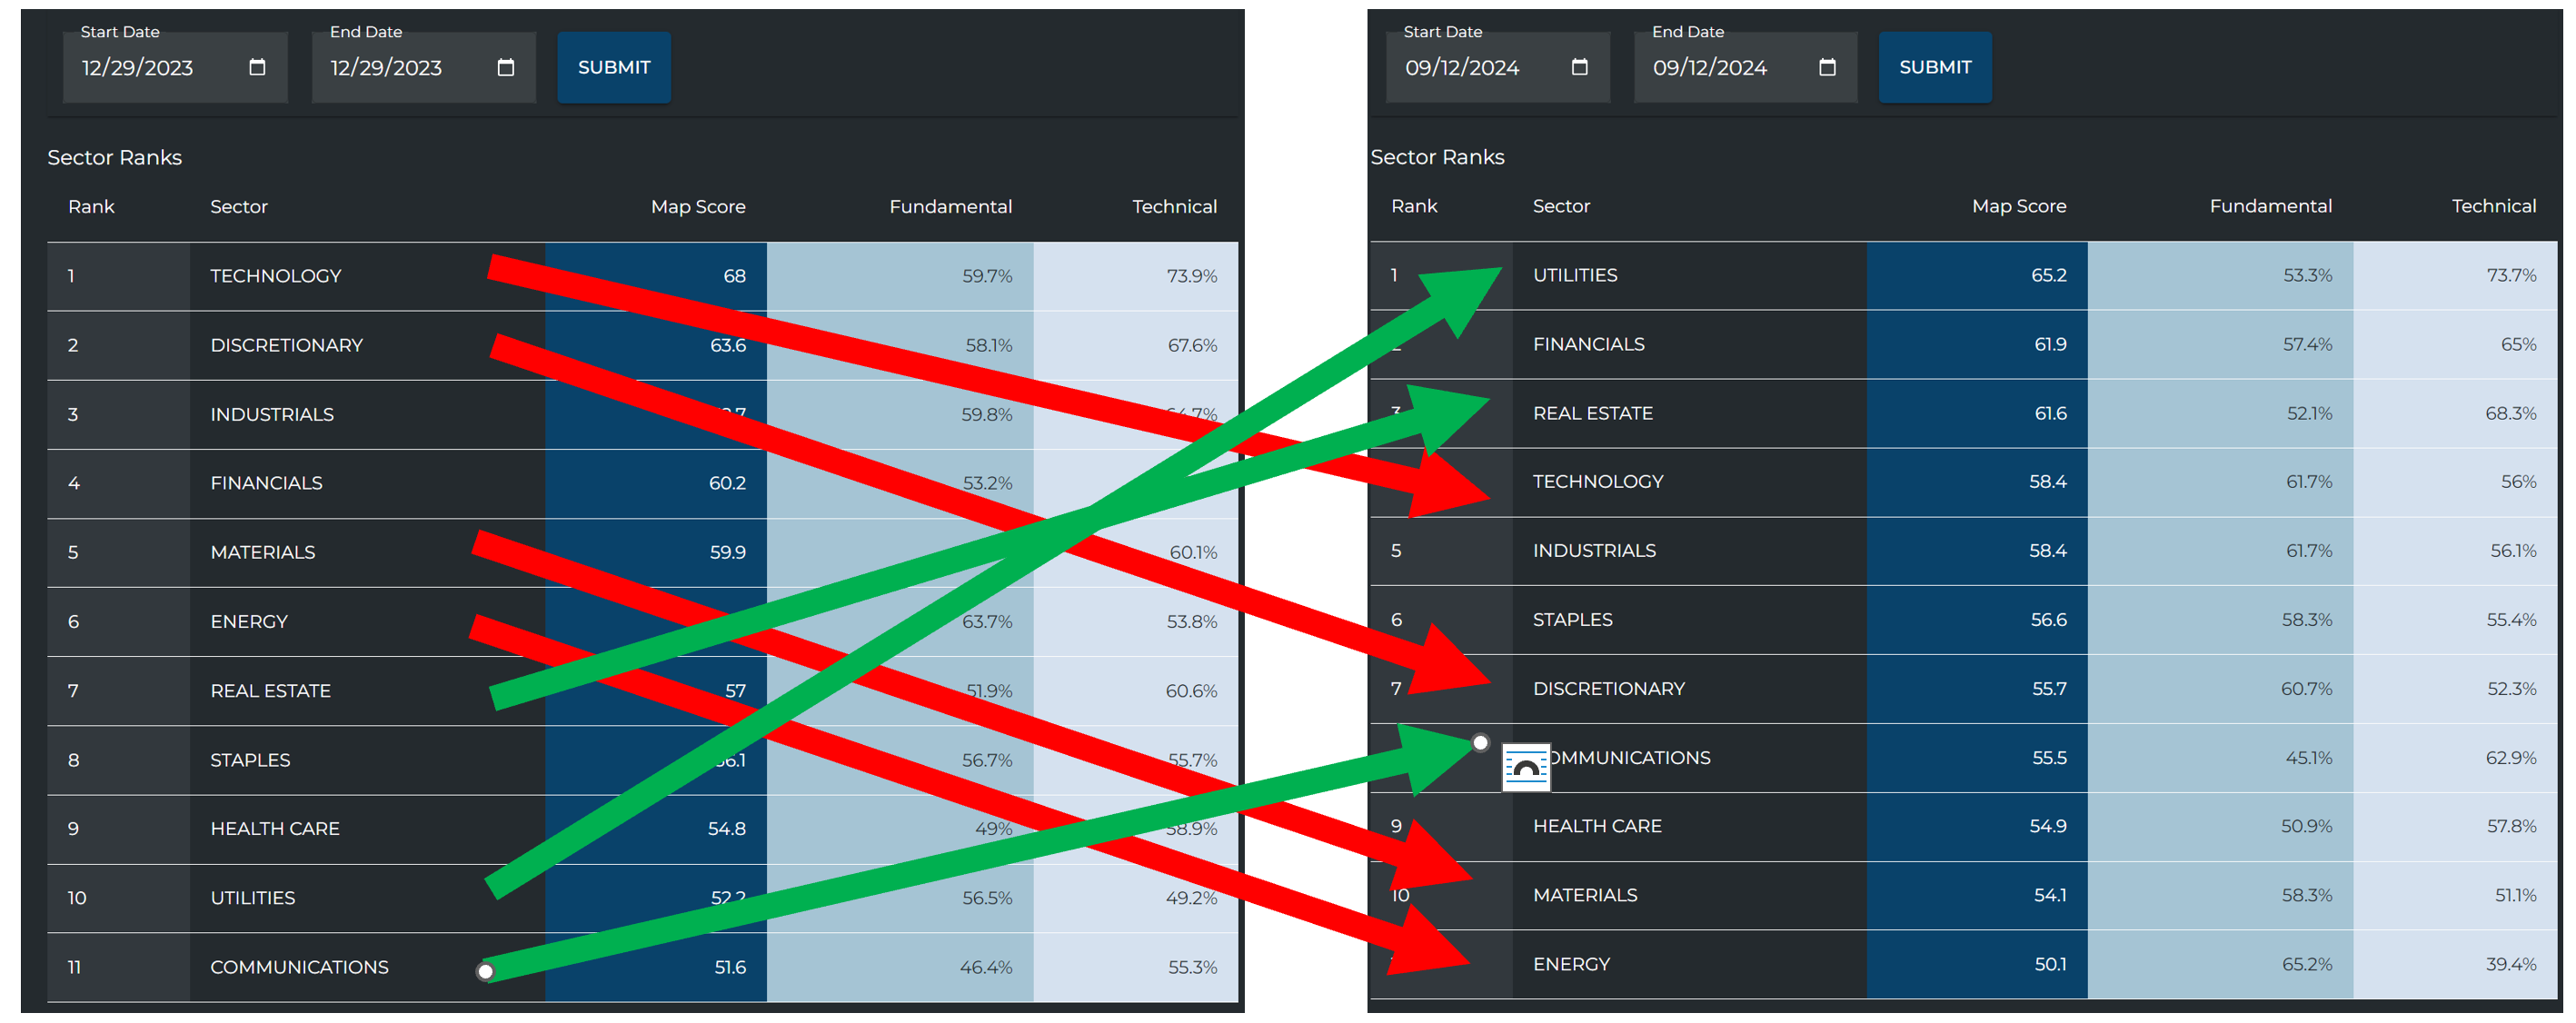
This sector volatility is very evident in this graphic of sector leadership year-to-date:
Graphs are for illustrative and discussion purposes only. Please read important disclosures at the end of this commentary.
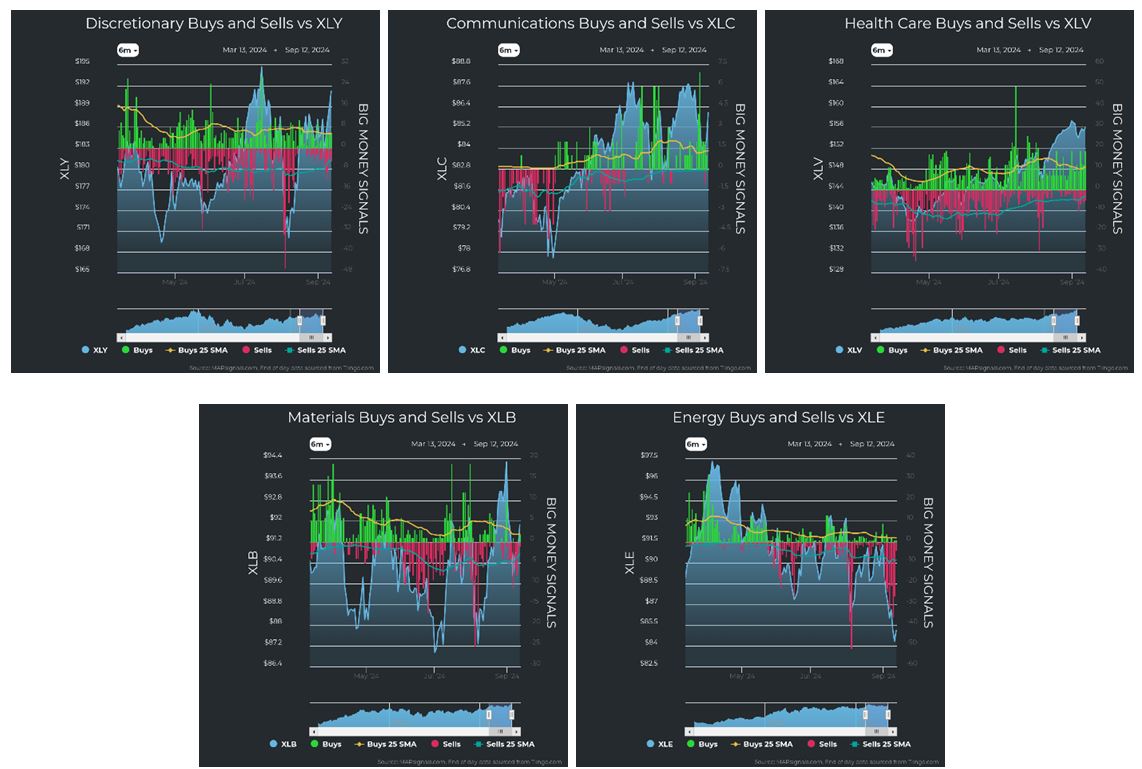
The familiar engines of the bull market for years were tops of the charts at year-end 2023: Technology and Discretionary. If you would have told me then that they would fall to #4 and #7, to be replaced by Utilities and Real Estate, and the market would be up, I would have been shocked… for a minute. Then I would realize that interest rates were bound to fall. In fact, I’ll admit, I thought rates would fall in late 2023 in my most aggressive model. As rates are set to fall next week, stock investors have been preparing.
Looking below, we can see sizeable inflows into Utilities, Financials, and Real Estate. Utilities, and Real Estate are attractive places to park capital in a falling rate environment. Gone are the days when you can hide in money markets and earn 5% doing nothing. Rates are set to fall, and the market knows it. In fact, the average mortgage rate just dropped to a multi-year low. Utilities often pay a hefty dividend. And Real Estate stocks, as REITs, are required by law to pay between 70% and 90% of net profits in dividends. And Financials are major beneficiaries of lower rates and M&A activity ramps up, as does lending in general.
Graphs are for illustrative and discussion purposes only. Please read important disclosures at the end of this commentary.
Technology is still muddling through a choppy period. Large-cap technology stocks are doing well but have been priced for perfection. Any language not overly rosy in forward-looking statements can impact its share price.
Clearly, the weakest sector is Energy, as oil prices have sunk 23% from their April highs.
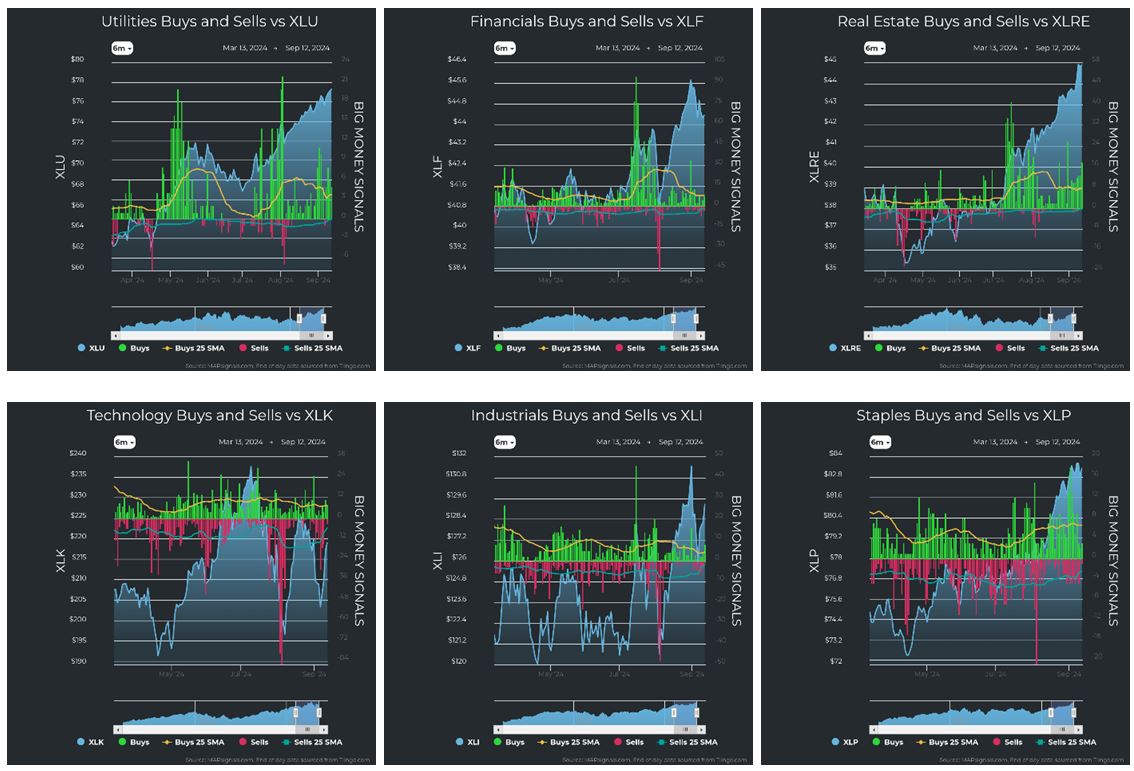
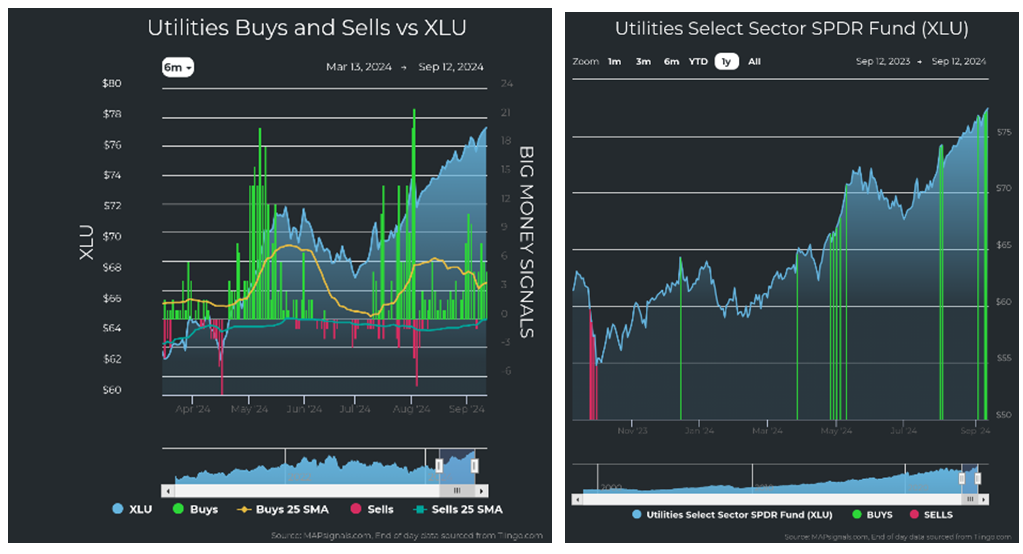
Revisiting Utilities for a moment, the unusual buying of individual stocks can lift an entire sector. The chart on the left reflects individual buys and sells. The chart on the right shows the XLU (SPDR Select Utilities Sector ETF). As you can see the unusual buying is helping to push the sector ETF higher.
Graphs are for illustrative and discussion purposes only. Please read important disclosures at the end of this commentary.
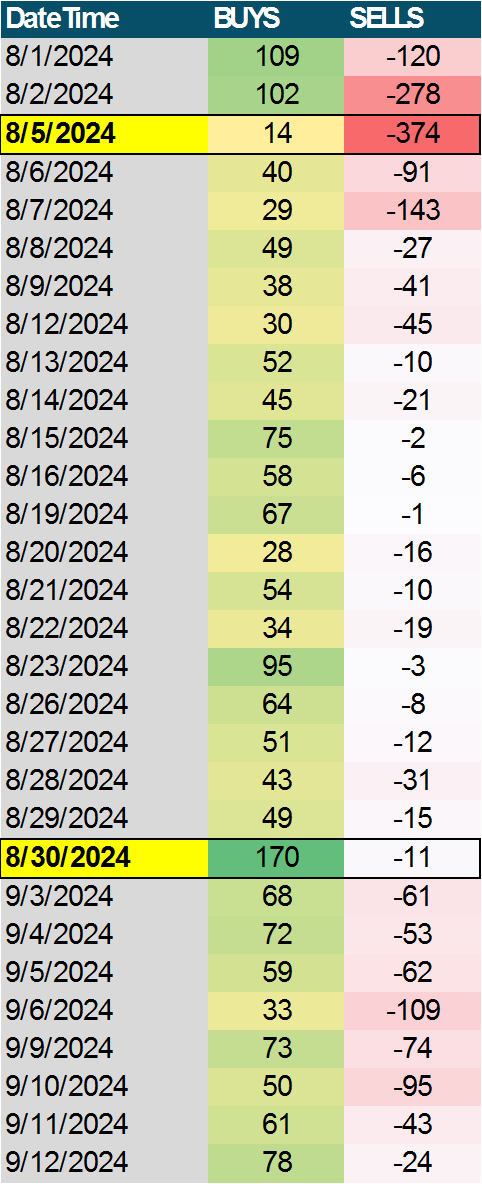
So far, the data is pretty rosy, but to continue this picture, I have found two extreme readings in the data over the last few weeks, and they both point to greener pastures. On August 5th, we logged a huge day of unusual selling: 374 stocks and ETFs were sold unusually that day. That was followed by August 30th seeing a big day of unusual buying, logging 170 buys, as shown in the daily log below:
![]()
Graphs are for illustrative and discussion purposes only. Please read important disclosures at the end of this commentary.
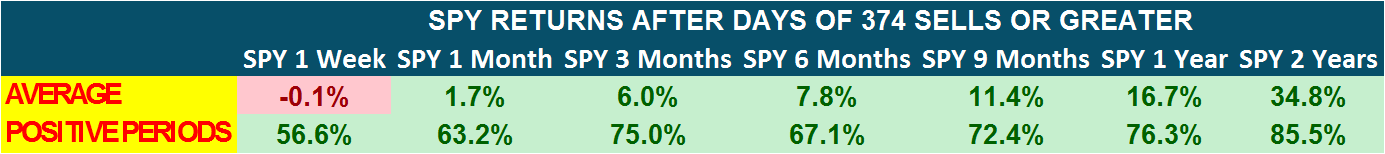
I wanted to see what these extreme days meant for the near future, historically speaking, so I looked for days of selling equal to or greater than August 5th, and days of buying equal or greater than August 30th.
I found that these are both rare events:
- There have only been 76 days with selling of 374 or greater since 1990 – or 0.87% of the time.
- There have only been 240 days with buying of 170 or greater since 1990 – or 2.75% of the time.
In each case, the forward returns were strong. Heavy selling days prefaced higher absolute returns long-term, but both profiles were strong, with high percentage of positive returns:

![]()
Graphs are for illustrative and discussion purposes only. Please read important disclosures at the end of this commentary.
Summing up, the news still sucks (as usual), and the election is exhausting us all. But when we focus on the data, we see that there is much to look forward to. Don’t forget that, as rates fall, small- and mid-cap stocks tend to be great beneficiaries due to the falling costs of leveraged financing.
Let’s focus on identifying winning stocks within each sector. Currently Utilities, Financials, and Real Estate are the new leaders. My game plan is to focus on these sectors and look for smaller and mid-sized companies with strong fundamentals that will lead their respective sectors higher.
As legendary bond investor Bill Gross said, of bonds: “It’s sort of like a teeter-totter; when interest rates go down, prices go up.” Well, that same formula goes for most stock prices, too.
All content above represents the opinion of Jason Bodner of Navellier & Associates, Inc.
Also In This Issue
A Look Ahead by Louis Navellier
We Barely Dodged World War III (Again) Last Week
Income Mail by Bryan Perry
The Rally That Nobody Saw Coming
Growth Mail by Gary Alexander
Debaters Dodge Deficits (and Growth, and Lots More)
Global Mail by Ivan Martchev
A Fresh All-Time High in the S&P 500 Likely This Week
Sector Spotlight by Jason Bodner
September 18th Creates a Turning Point for Stocks
View Full Archive
Read Past Issues Here

Jason Bodner
MARKETMAIL EDITOR FOR SECTOR SPOTLIGHT
Jason Bodner writes Sector Spotlight in the weekly Marketmail publication and has authored several white papers for the company. He is also Co-Founder of Macro Analytics for Professionals which produces proprietary equity accumulation and distribution research for its clients. Previously, Mr. Bodner served as Director of European Equity Derivatives for Cantor Fitzgerald Europe in London, then moved to the role of Head of Equity Derivatives North America for the same company in New York. He also served as S.V.P. Equity Derivatives for Jefferies, LLC. He received a B.S. in business administration in 1996, with honors, from Skidmore College as a member of the Periclean Honors Society. All content of “Sector Spotlight” represents the opinion of Jason Bodner
Important Disclosures:
Jason Bodner is a co-founder and co-owner of Mapsignals. Mr. Bodner is an independent contractor who is occasionally hired by Navellier & Associates to write an article and or provide opinions for possible use in articles that appear in Navellier & Associates weekly Market Mail. Mr. Bodner is not employed or affiliated with Louis Navellier, Navellier & Associates, Inc., or any other Navellier owned entity. The opinions and statements made here are those of Mr. Bodner and not necessarily those of any other persons or entities. This is not an endorsement, or solicitation or testimonial or investment advice regarding the BMI Index or any statements or recommendations or analysis in the article or the BMI Index or Mapsignals or its products or strategies.
Although information in these reports has been obtained from and is based upon sources that Navellier believes to be reliable, Navellier does not guarantee its accuracy and it may be incomplete or condensed. All opinions and estimates constitute Navellier’s judgment as of the date the report was created and are subject to change without notice. These reports are for informational purposes only and are not a solicitation for the purchase or sale of a security. Any decision to purchase securities mentioned in these reports must take into account existing public information on such securities or any registered prospectus.To the extent permitted by law, neither Navellier & Associates, Inc., nor any of its affiliates, agents, or service providers assumes any liability or responsibility nor owes any duty of care for any consequences of any person acting or refraining to act in reliance on the information contained in this communication or for any decision based on it.
Past performance is no indication of future results. Investment in securities involves significant risk and has the potential for partial or complete loss of funds invested. It should not be assumed that any securities recommendations made by Navellier. in the future will be profitable or equal the performance of securities made in this report. Dividend payments are not guaranteed. The amount of a dividend payment, if any, can vary over time and issuers may reduce dividends paid on securities in the event of a recession or adverse event affecting a specific industry or issuer.
None of the stock information, data, and company information presented herein constitutes a recommendation by Navellier or a solicitation to buy or sell any securities. Any specific securities identified and described do not represent all of the securities purchased, sold, or recommended for advisory clients. The holdings identified do not represent all of the securities purchased, sold, or recommended for advisory clients and the reader should not assume that investments in the securities identified and discussed were or will be profitable.
Information presented is general information that does not take into account your individual circumstances, financial situation, or needs, nor does it present a personalized recommendation to you. Individual stocks presented may not be suitable for every investor. Investment in securities involves significant risk and has the potential for partial or complete loss of funds invested. Investment in fixed income securities has the potential for the investment return and principal value of an investment to fluctuate so that an investor’s holdings, when redeemed, may be worth less than their original cost.
One cannot invest directly in an index. Index is unmanaged and index performance does not reflect deduction of fees, expenses, or taxes. Presentation of Index data does not reflect a belief by Navellier that any stock index constitutes an investment alternative to any Navellier equity strategy or is necessarily comparable to such strategies. Among the most important differences between the Indices and Navellier strategies are that the Navellier equity strategies may (1) incur material management fees, (2) concentrate its investments in relatively few stocks, industries, or sectors, (3) have significantly greater trading activity and related costs, and (4) be significantly more or less volatile than the Indices.
ETF Risk: We may invest in exchange traded funds (“ETFs”) and some of our investment strategies are generally fully invested in ETFs. Like traditional mutual funds, ETFs charge asset-based fees, but they generally do not charge initial sales charges or redemption fees and investors typically pay only customary brokerage fees to buy and sell ETF shares. The fees and costs charged by ETFs held in client accounts will not be deducted from the compensation the client pays Navellier. ETF prices can fluctuate up or down, and a client account could lose money investing in an ETF if the prices of the securities owned by the ETF go down. ETFs are subject to additional risks:
- ETF shares may trade above or below their net asset value;
- An active trading market for an ETF’s shares may not develop or be maintained;
- The value of an ETF may be more volatile than the underlying portfolio of securities the ETF is designed to track;
- The cost of owning shares of the ETF may exceed those a client would incur by directly investing in the underlying securities and;
- Trading of an ETF’s shares may be halted if the listing exchange’s officials deem it appropriate, the shares are delisted from the exchange, or the activation of market-wide “circuit breakers” (which are tied to large decreases in stock prices) halts stock trading generally.
Grader Disclosures: Investment in equity strategies involves substantial risk and has the potential for partial or complete loss of funds invested. The sample portfolio and any accompanying charts are for informational purposes only and are not to be construed as a solicitation to buy or sell any financial instrument and should not be relied upon as the sole factor in an investment making decision. As a matter of normal and important disclosures to you, as a potential investor, please consider the following: The performance presented is not based on any actual securities trading, portfolio, or accounts, and the reported performance of the A, B, C, D, and F portfolios (collectively the “model portfolios”) should be considered mere “paper” or pro forma performance results based on Navellier’s research.
Investors evaluating any of Navellier & Associates, Inc.’s, (or its affiliates’) Investment Products must not use any information presented here, including the performance figures of the model portfolios, in their evaluation of any Navellier Investment Products. Navellier Investment Products include the firm’s mutual funds and managed accounts. The model portfolios, charts, and other information presented do not represent actual funded trades and are not actual funded portfolios. There are material differences between Navellier Investment Products’ portfolios and the model portfolios, research, and performance figures presented here. The model portfolios and the research results (1) may contain stocks or ETFs that are illiquid and difficult to trade; (2) may contain stock or ETF holdings materially different from actual funded Navellier Investment Product portfolios; (3) include the reinvestment of all dividends and other earnings, estimated trading costs, commissions, or management fees; and, (4) may not reflect prices obtained in an actual funded Navellier Investment Product portfolio. For these and other reasons, the reported performances of model portfolios do not reflect the performance results of Navellier’s actually funded and traded Investment Products. In most cases, Navellier’s Investment Products have materially lower performance results than the performances of the model portfolios presented.
This report contains statements that are, or may be considered to be, forward-looking statements. All statements that are not historical facts, including statements about our beliefs or expectations, are “forward-looking statements” within the meaning of The U.S. Private Securities Litigation Reform Act of 1995. These statements may be identified by such forward-looking terminology as “expect,” “estimate,” “plan,” “intend,” “believe,” “anticipate,” “may,” “will,” “should,” “could,” “continue,” “project,” or similar statements or variations of such terms. Our forward-looking statements are based on a series of expectations, assumptions, and projections, are not guarantees of future results or performance, and involve substantial risks and uncertainty as described in Form ADV Part 2A of our filing with the Securities and Exchange Commission (SEC), which is available at www.adviserinfo.sec.gov or by requesting a copy by emailing info@navellier.com. All of our forward-looking statements are as of the date of this report only. We can give no assurance that such expectations or forward-looking statements will prove to be correct. Actual results may differ materially. You are urged to carefully consider all such factors.
FEDERAL TAX ADVICE DISCLAIMER: As required by U.S. Treasury Regulations, you are informed that, to the extent this presentation includes any federal tax advice, the presentation is not written by Navellier to be used, and cannot be used, for the purpose of avoiding federal tax penalties. Navellier does not advise on any income tax requirements or issues. Use of any information presented by Navellier is for general information only and does not represent tax advice either express or implied. You are encouraged to seek professional tax advice for income tax questions and assistance.
IMPORTANT NEWSLETTER DISCLOSURE:The hypothetical performance results for investment newsletters that are authored or edited by Louis Navellier, including Louis Navellier’s Growth Investor, Louis Navellier’s Breakthrough Stocks, Louis Navellier’s Accelerated Profits, and Louis Navellier’s Platinum Club, are not based on any actual securities trading, portfolio, or accounts, and the newsletters’ reported hypothetical performances should be considered mere “paper” or proforma hypothetical performance results and are not actual performance of real world trades. Navellier & Associates, Inc. does not have any relation to or affiliation with the owner of these newsletters. There are material differences between Navellier Investment Products’ portfolios and the InvestorPlace Media, LLC newsletter portfolios authored by Louis Navellier. The InvestorPlace Media, LLC newsletters contain hypothetical performance that do not include transaction costs, advisory fees, or other fees a client might incur if actual investments and trades were being made by an investor. As a result, newsletter performance should not be used to evaluate Navellier Investment services which are separate and different from the newsletters. The owner of the newsletters is InvestorPlace Media, LLC and any questions concerning the newsletters, including any newsletter advertising or hypothetical Newsletter performance claims, (which are calculated solely by Investor Place Media and not Navellier) should be referred to InvestorPlace Media, LLC at (800) 718-8289.
Please note that Navellier & Associates and the Navellier Private Client Group are managed completely independent of the newsletters owned and published by InvestorPlace Media, LLC and written and edited by Louis Navellier, and investment performance of the newsletters should in no way be considered indicative of potential future investment performance for any Navellier & Associates separately managed account portfolio. Potential investors should consult with their financial advisor before investing in any Navellier Investment Product.
Navellier claims compliance with Global Investment Performance Standards (GIPS). To receive a complete list and descriptions of Navellier’s composites and/or a presentation that adheres to the GIPS standards, please contact Navellier or click here. It should not be assumed that any securities recommendations made by Navellier & Associates, Inc. in the future will be profitable or equal the performance of securities made in this report.
FactSet Disclosure: Navellier does not independently calculate the statistical information included in the attached report. The calculation and the information are provided by FactSet, a company not related to Navellier. Although information contained in the report has been obtained from FactSet and is based on sources Navellier believes to be reliable, Navellier does not guarantee its accuracy, and it may be incomplete or condensed. The report and the related FactSet sourced information are provided on an “as is” basis. The user assumes the entire risk of any use made of this information. Investors should consider the report as only a single factor in making their investment decision. The report is for informational purposes only and is not intended as an offer or solicitation for the purchase or sale of a security. FactSet sourced information is the exclusive property of FactSet. Without prior written permission of FactSet, this information may not be reproduced, disseminated or used to create any financial products. All indices are unmanaged and performance of the indices include reinvestment of dividends and interest income, unless otherwise noted, are not illustrative of any particular investment and an investment cannot be made in any index. Past performance is no guarantee of future results.